Construction Analysis for Pavement Rehabilitation Strategies
View the PDF
Version [2.2 MB]
![]() You will need the Adobe
Reader to view the PDFs on this page.
You will need the Adobe
Reader to view the PDFs on this page.
slide 1
FHWA – AASHTO Endorsement Product
CA4PRS Peer-Exchange Workshop
September 22, 2010
Eul-Bum (E.B.) Lee (Ph.D, PE, PMP)
Institute of Transportation Studies
Univ. of Cal. – Berkeley

slide notes
None.
slide 2
AGENDA
CA4PRS Introduction
Schedule Module
Traffic Module
Cost Module
slide notes
Four states participated in FHWA pool fund study to develop the tool. CA took the lead and used the CA4PRS in few locations.
slide 3
Challenge
AASHTO President (MO-DOT)
- Transconomy:
- No Transportation → No Economy
- AASHTO Report: "Unlocking Freight"
Demand-Supply unbalance ('80-'06)
- 150% more traffic vs 15% highway capacity up
- $63 billion of yearly user delay cost
- Freight: Trucks carry 74% of loads
- In 10 years: 1.8 mil more trucks
- In 20 years: 50% more trucks than NOW
slide notes
Better Roads (Aug 2010): Freight Movement Crisis
slide 4
Highway Infrastructure Renewal & Impacts
- Aging highway infrastructure needs renewal
- State DOT 4-R projects; Renewal research-SHRP2
- How to minimize the Impacts of WZ lane closures?
- Quantify impacts to motorists and local businesses
- FHWA 2008 WZ regulation: 23 CFR Part 630 Subpart J
- Work-zone mobility and safety
- State-wide process & project-level procedure: TMP
- Integration approach: analysis tools to balance
- Tolerable traffic delays in WZ
- Faster construction delivery
- Longer lasting pavements
- Affordable agency budget
- TRB: "Get-in, Get-out & Stay-out"
slide notes
Much of the urban freeway network in the United States was built between 1955 and 1970. All designed for 20 years of life. If we do the math, these pavements reached their design life between 1975 and 1990, and have been continuously maintained and rehabilitated since then.
Most of the rest of the highway network was completed by 1980. Again, 20 years design life being reached some years ago, maintenance and rehab since then.
As the underlying pavement structure continues to be damaged by traffic and the environment, the frequency of maintenance and rehab increases. This causes increased frequency of closures, which causes more delays and safety problems. And costs the agency more money.
Studies by Texas Transportation Institute in 2003 shows the impact of construction...
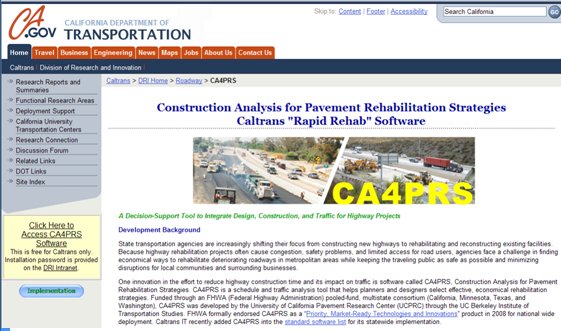
slide 5
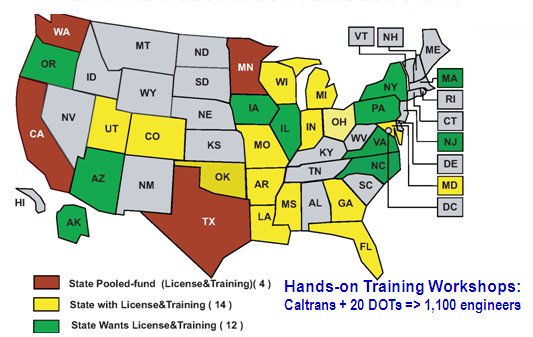
CA4PRS Software Development and Nationwide Implementation
- CA4PRS software development
- Pooled-fund (CA, MN, TX, WA): UCB-FHWA-Caltrans
- Help develop optimum construction-staging plans and TMP
- Multi-discipline collaboration and teamwork building
- FHWA Outreach
- 2009 Market-ready Innovation and Technology Product
- Arranged Free-group License for all 50 State DOTs
- Trainings: 1,000 Engineers in 20 states, 10 universities
- AASHTO Promotion
- CAST: WZ Traffic Tools: 2007-2009
- Exhibit, Presentation: AASHTO Committee, Conference
- 2007 International Road Federation Award
slide notes
The tools allow the implementation of an integrated analysis process. This allows the analysis of a project with all stakeholders (each seeking to optimize one of the competing objectives) together.
What helps with this is to use an integrated project development work process instead of the traditioal sequential work process. Traditional process is: plan, traffic windows, design, construction in order. When a problem is found the project gets sent back upstream. In the integrated multi-discipline process have the planners, traffic engineers, designers, and construction and maintenance engineers all sit together, and work together using the tools to try different scenarios. This results in the "what-ifs" being analyzed ONE time. Minimizes rework, speeds project delivery.
Decisions are made on calculation of Traffic Delay, Agency Cost and User Delay Cost.
Traffic simulation software allows simultaneous and QUANTITATIVE analysis of construction schedule and traffic delay.
Can use traffic delay calculations to calculate appropriate schedule intensives and disincentives for contractors, so the agency isn't paying too much.
slide 6
CA4PRS Nationwide Promotion (2010)
slide notes
- CA4PRS Implementation Follow-Ups for DOTs:
- Send the CA4PRS CD package to 50 DOTs (Design and Traffic Chief) – within 1 month.
- Provide 2-hour Webinar to DOTs (from March).
- Provide 1-day Introductory Training (visiting the State) (from March).
- Develop 4-hour Online Training Course (available from end of 2010).
- CA4PRS has been used on the projects shown here. Three of them have been built. Selected information on them is presented in next slides.
- The whole integrated process was used by Caltrans District 8 on I-15 Devore, including for public outreach efforts.
- WA and MN DOTs have used CA4PRS for analyses for two corridor rehabilitations.
slide 7
CA4PRS Implementation Projects
| No | Route | Location | Type | Project Cost | Savings | Distance | Year | Status |
|---|---|---|---|---|---|---|---|---|
| CA DOT (Caltrans) Projects | ||||||||
| 1 | I-10 | Pomona, D7 | Rehab | $16M | $0.3M | 1 mile | 2000 | Partially adopted |
| 2 | I-710 | Long Beach, D7 | Rehab | $17M | $1M | 5 miles | 2003 | Adopted |
| 3 | I-15 | Devore-I, D8 | Rehab | $16M | $8M | 3 miles | 2005 | Adopted |
| 4 | I-15 | Devore-II, D8 | Rehab | $24M | $4M | 5 miles | 2007 | Adopted |
| 5 | I-15 | Ontario, D8 | Rehab | $59M | $5M | 8 miles | 2009 | Adopted |
| 6 | I-280 | Santa Clara, D4 | CAPM | $20M | $2M | 6 miles | 2009 | Not adopted |
| 7 | US-101 | San Jose, D4 | CAPM | $27M | $3M | 7 miles | 2009 | Partially adopted |
| 8 | I-680 | San Ramon, D4 | Rehab | $70M | $1M | 12 miles | 2010 | Partially Adopted |
| 9 | US-101 | Ukiah, D1 | CAPM | $19M | $2M | 6 miles | 2010 | Partially adopted |
| 10 | I-5 | Redding, D2 | Rehab | $50M | – | 14 miles | 2011 | Not adopted |
| 11 | I-80 | Sacramento, D3 | Rehab | $92M | $3M | 9 miles | 2011 | Partially adopted |
| 12 | I-5 | Sacramento, D3 | Rehab | $88M | – | 17 miles | 2011 | Partially adopted |
| 13 | SR-99 | Elk Grove, D3 | CAPM | $21M | $3.5M | 14 miles | 2010 | Not adopted |
| 14 | I-5 | Yolo/Colusa, D3 | CAPM | $25M | – | 24 miles | 2010 | Not adopted |
| 15 | I-5 | Stockton, D10 | Rehab | $45M | – | 3 mile | 2012 | Adopted |
| Other State DOT Projects | ||||||||
| 16 | I-5 | Seattle, WA | Rehab | $5 | – | 2 miles | 2005 | Verification |
| 17 | I-494 | St. Paul, MN | Rehab | $10M | – | 10 miles | 2004 | Verification |
| 18 | I-15 | St. George, UT | Rehab | $16 | $2M | 8 miles | 2010 | Adopted |
| 19 | I-35 | Oklahoma City, OK | Rehab | 2010 | Verification | |||
slide notes
None.
slide 8
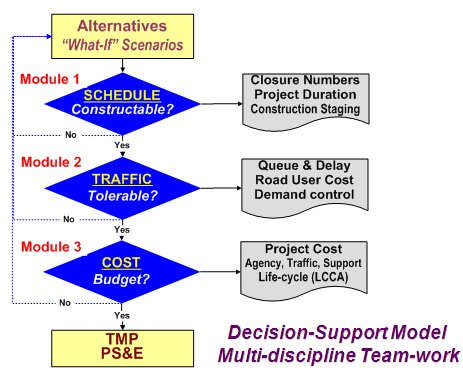
CA4PRS Analysis Process
slide notes
None.
slide 9
CA4PRS Comparison Alternatives
- Pavement Design Alternatives
- Rehabilitation Strategies
- Rigid: JPCP, CRCP, Precast
- Flexible: Overlay, Milling-filling AC, Full-depth AC
- Variation: Cross-section, Mix, Base type
- Rehabilitation Strategies
- Work-zone Traffic Alternatives
- Construction window: Night, Day, Weekend, Continuous
- WZ Capacity Sensitivity: Lane width, Geometry, Trucks
- Demand Sensitivity: No-shows and Detours
- Constructability and Logistics Alternatives
- Construction trucks: Loading & discharging cycle
- Construction sequence: Site access
- Constructability: Demolition methods, and Mix types
slide notes
The tools allow the implementation of an integrated analysis process. This allows the analysis of a project with all stakeholders (each seeking to optimize one of the competing objectives) together.
What helps with this is to use an integrated project development work process instead of the traditioal sequential work process. Traditional process is: plan, traffic windows, design, construction in order. When a problem is found the project gets sent back upstream. In the integrated multi-discipline process have the planners, traffic engineers, designers, and construction and maintenance engineers all sit together, and work together using the tools to try different scenarios. This results in the « what-ifs » being analyzed ONE time. Minimizes rework, speeds project delivery.
Decisions are made on calculation of Traffic Delay, Agency Cost and User Delay Cost.
Traffic simulation software allows simultaneous and QUANTITATIVE analysis of construction schedule and traffic delay.
Can use traffic delay calculations to calculate appropriate schedule intensives and disincentives for contractors, so the agency isn't paying too much.
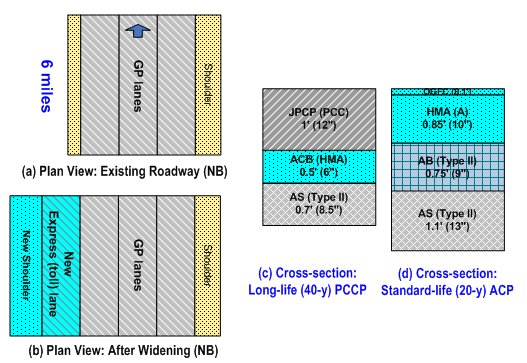
slide 10
Concrete Pavement Cross-sections
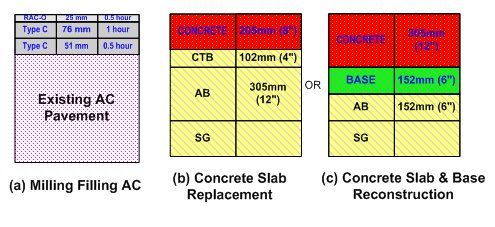
CA4PRS Compares Cross-section Change Alternatives from SCHEDULE-TRAFFIC-COST
slide notes
None.
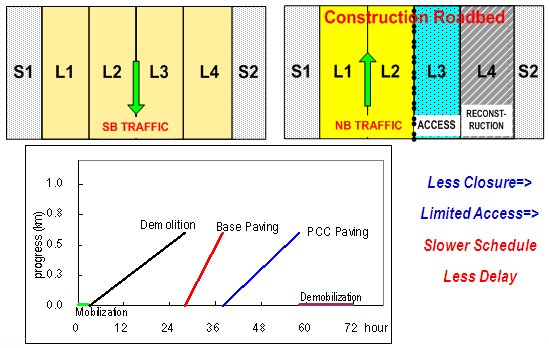
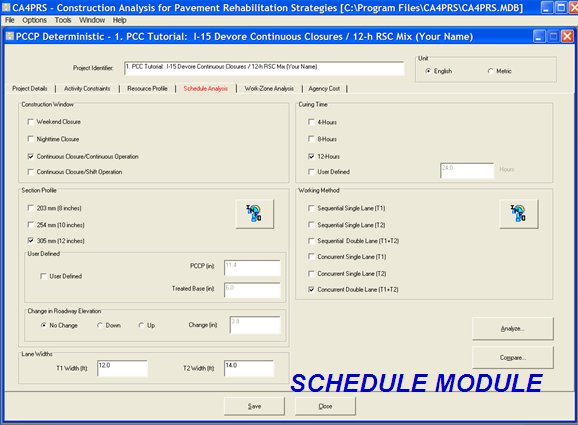
slide 11
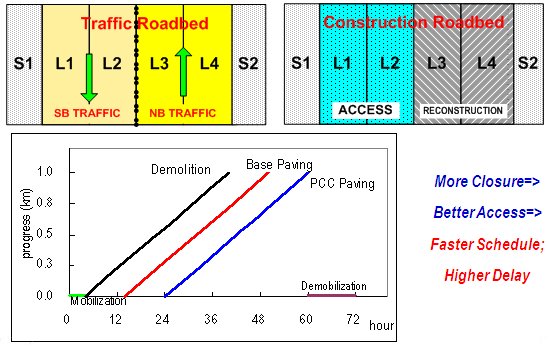
Closure ↔ Access ↔ Production Full Closure for Concurrent Method
slide notes
None.
slide 12
Closure ↔ Access ↔ Production Partial Closure for Sequential Method
slide notes
None.
slide 13
Work-zone Traffic Delay Analysis Demand-Capacity (Macro-model): HCM 2000
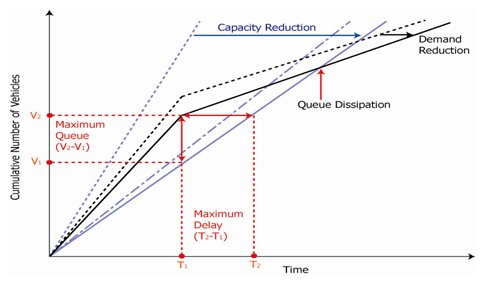
- Road user cost (RUC)
- Delay cost: Queue-delay (traveler's time value)
- Vehicle operation costs: maintenance, fuel, emission, crash
- Detour cost: circuity or diversion (better in network analysis)
slide notes
None.
slide 14
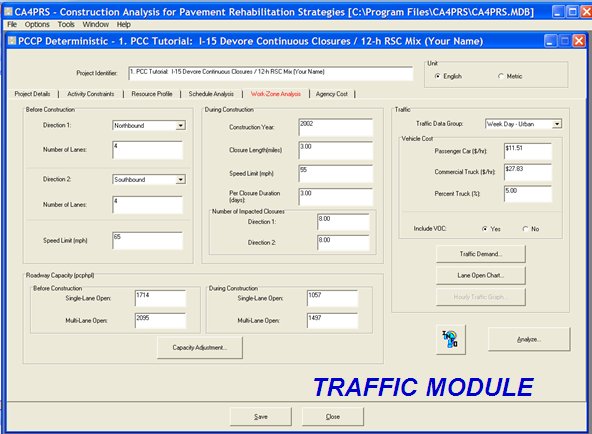
CA4PRS WZ Traffic Module Inputs & Outputs (HCM Model)
- Basic Input Data
- Closure schedule inputs: from SCHEDULE module
- 24 hourly traffic volumes
- Lanes open (closure) schemes
- User's Time values (vehicle cost)
- WZ Capacity (Sensitivity) and Demand Management
- Demand-management & Capacity-adjustment
- Demand reduction: no-shows and detour
- WZ capacity: Terrain, Truck, lane-width, lateral clearance
- WZ Impact Analysis Outputs
- Max queue length and Max delay per closure
- Total Road User Cost
- WZ Analysis Application
- Evaluate TMPs and develop Lane closure charts
- Contract: Incentives/Disincentive & A+B
slide notes
Federal Regulation Amendment 23 CFR Part 630 (Effective Oct 2007)
Caltrans has recognized this since the mid-1990s. Other states realize this as well. There is now a new federal regulation addressing this issue.
Regulation calls for a state-wide process outlined here, that includes development of procedures, performance data collection, training and process review.
slide 15
slide notes
None.
slide 16
slide notes
None.
slide 17
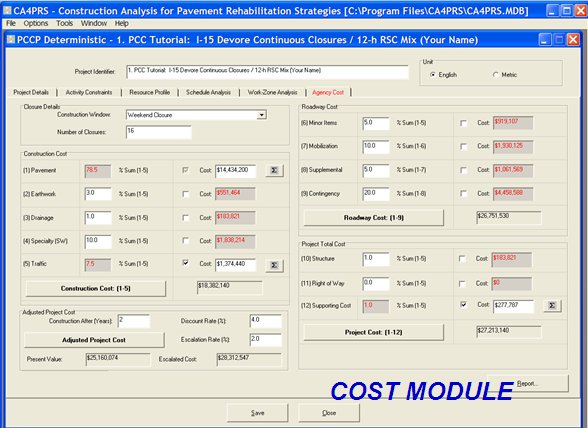
CA4PRS Estimate Agency (Project) Cost
- Pavement Cost: Itemized unit-price and Qty
- Materials (PCC, HMA, RAC, Pre-cast), Base, Subbase
- Item unit-price from Bid-database
- Non-pavement Cost: % of Construction-cost
- Earth work cost; Drainage cost
- Specialty (Retaining/Barrier), Storm-water (SWPPP)
- Traffic Cost
- TMP (COZEEP, I/D) and Traffic-handling, Outreach
- Indirect Cost: % of Construction-cost
- Minor, Mobilization, Supplemental, Contingency
- Supporting: Agency (Plan, Design, Traffic, Construction)
- Other Optional Cost
- Structure and ROW
→ Project Cost
slide notes
The tools allow the implementation of an integrated analysis process. This allows the analysis of a project with all stakeholders (each seeking to optimize one of the competing objectives) together.
What helps with this is to use an integrated project development work process instead of the traditioal sequential work process. Traditional process is: plan, traffic windows, design, construction in order. When a problem is found the project gets sent back upstream. In the integrated multi-discipline process have the planners, traffic engineers, designers, and construction and maintenance engineers all sit together, and work together using the tools to try different scenarios. This results in the "what-ifs" being analyzed ONE time. Minimizes rework, speeds project delivery.
Decisions are made on calculation of Traffic Delay, Agency Cost and User Delay Cost.
Traffic simulation software allows simultaneous and QUANTITATIVE analysis of construction schedule and traffic delay.
Can use traffic delay calculations to calculate appropriate schedule intensives and disincentives for contractors, so the agency isn't paying too much.
slide 18
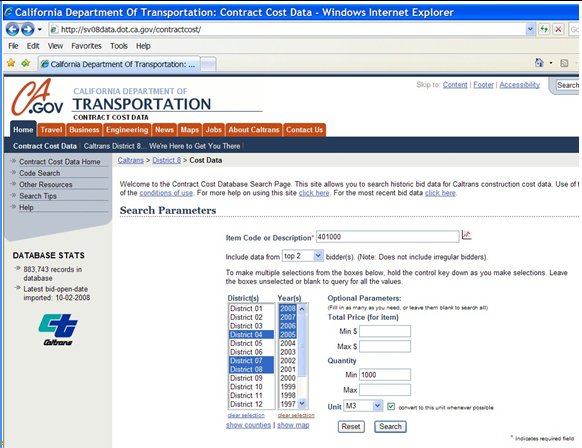
Caltrans Bid Cost DB Website: http://sv08data.dot.ca.gov/contractcost
slide notes
None.
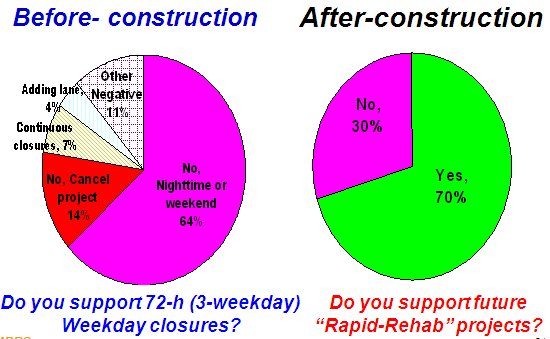
slide 19
I-15 Devore PCC Reconstruction Project, 2005
- 10 lane-mile of PCC Pavement were Rebuilt
- TWO 8-day closures (Non-stop Construction)
- Saved $8M Agency Cost!
- It would take 10 month of Nighttime Closures
slide notes
I-15 notes:
Replacement of outer lane with thicker slab, doweled, new asphalt base. Inner truck lane was originally to also be replaced, but cost was too high. Instead had slab replacements. Centerline 3 mile section. Major corridor connecting LA to the mid-west. Also many commuters between high desert and the basin.
Traffic handling: used Moveable Concrete Barrier (MCB) to move all traffic onto one side of the freeway, freeing the other side for construction.
Major traffic to Las Vegas on Friday afternoon and returning on Sunday afternoon made 55 hour weekend closures not the optimal solution.
Schedule: two continuous 9 day closures.
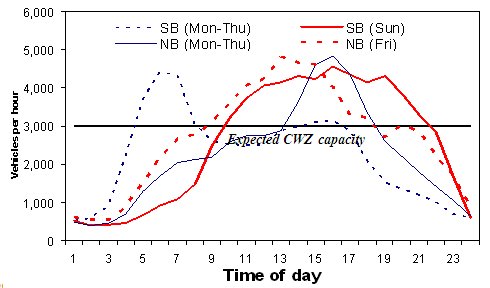
slide 20
I-15 Devore Daily Traffic Patterns
- Approximately 120,000 ADT (10% trucks)
- Weekdays Commuters + Weekend Leisure
slide notes
None.
slide 21
slide notes
None.
slide 22
CA4PRS on the Web (CD)
http://www.dot.ca.gov/hq/research/roadway/ca4prs/index.htm
slide notes
None.
slide 23
CA4PRS Implementation in Project Life Cycle Process
- Planning Stage (PSR/PA&ED): Scope and Priority
- VE Analysis and Life-cycle Cost Analysis
- Design Stage: PS&E & TMP packages
- Working-days (CPM); Construction staging plans
- TMP Report and Lane closure charts
- Construction Stage
- Validate contractor's work-plans and CCO
- Upcoming Enhancement Modules
- Currently V2.5: Schedule-Traffic-Cost for M & R
- V3.0 Roadway Widening Module
- V3.5 Bridge Replacement Module
- V4.0 LCCA Interaction Module
slide notes
The tools allow the implementation of an integrated analysis process. This allows the analysis of a project with all stakeholders (each seeking to optimize one of the competing objectives) together.
What helps with this is to use an integrated project development work process instead of the traditioal sequential work process. Traditional process is: plan, traffic windows, design, construction in order. When a problem is found the project gets sent back upstream. In the integrated multi-discipline process have the planners, traffic engineers, designers, and construction and maintenance engineers all sit together, and work together using the tools to try different scenarios. This results in the "what-ifs" being analyzed ONE time. Minimizes rework, speeds project delivery.
Decisions are made on calculation of Traffic Delay, Agency Cost and User Delay Cost.
Traffic simulation software allows simultaneous and QUANTITATIVE analysis of construction schedule and traffic delay.
Can use traffic delay calculations to calculate appropriate schedule intensives and disincentives for contractors, so the agency isn't paying too much.
slide 24
More CA4PRS Information?
Contacts
Dr. E.B. Lee: UC Berkeley-ITS
(510) 665-3637
eblee@berkeley.edu
Ken Jacoby: FHWA Office of Asset Management
202-366-6503
Ken.Jacoby@dot.gov
Dr. Nadarajah Sivaneswaran (Siva): FHWA Turner-Fairbank
(202) 493-3147
n.sivaneswaran@dot.gov
Michael Samadian: Caltrans Research
(916) 324-2048
Michael_M_Samadian@dot.ca.gov
slide notes
Version 1.5 of CA4PRS has a Highway Capacity Manual type traffic analysis module available. Version 2.0 of CA4PRS (under development) will have the module embedded in the software with a good user interface, as well as the ability to analyze more construction scenarios. Contact Michael Samadian for more information.
slide 25
I-15 Devore Pre-construction Analysis CA4PRS Schedule-Traffic-Cost Comparison
| Construction Scenario | Construction Schedule: Total Closures | Construction Schedule: Closure Hours | WZ Traffic Max. Delay (Min) | WZ Traffic Delay RUC) Cost ($M) | Agency Cost ($M) | Total Cost ($M) |
|---|---|---|---|---|---|---|
| One Roadbed Continuous (24/7) | 2 | 400 | 80 | 5.0 | 25.0 | 30.0 |
| 72-Hour Weekday Non-stop | 8 | 576 | 50 | 8.0 | 26.0 | 34.0 |
| 55-Hour Weekend Extended | 16 | 880 | 80 | 14.0 | 27.0 | 41.0 |
| 9-Hour Nighttime Closures | 230 | 2,100 | 50 | 7.0 | 31.0 | 38.0 |
| 8-Hour Nighttime Closures | 300 | 2,400 | 20 | 3.0 | 33.0 | 36.0 |
| 7-Hour Nighttime Closures | 410 | 2,900 | 10 | 1.0 | 35.0 | 36.0 |
slide notes
Agency cost savings are for construction cost and traffic handling ONLY. They do NOT include any calculation of Caltrans support costs.
Costs shown are for:
- Project length was 3 miles, 1 truck lane reconstructed in each direction, 1 truck lane with slab replacements
- Alternatives scenarios considered by integrated team
- CA4PRS used to calculate schedules
- Demand/Capacity; FREQ and Paramics traffic analyses to calculate road user delay, calculate delay costs
- Paramics simulations and CA4PRS results used for public outreach meetings
- Costs for each alternative shown
- Project selected was first one: 1 Roadbed Continuous closure (2 closures, each 9 days)
- This information was used for the public hearing and conveyed what Caltrans was trying to do (save $ and minimize total impact on public).
slide 26
Constructability Inputs: Truck-numbers for Demolition and Mix-type
- PCC slab Saw-cut and Lift Method
- PCC Slcab Cracking and Excavation Method
- FSHCC (Nighttime): Ready-mixer Truck
- PCC or RSC: End-dump Truck
slide notes
None.
slide 27
Milling (Cold-plane) Production Trend
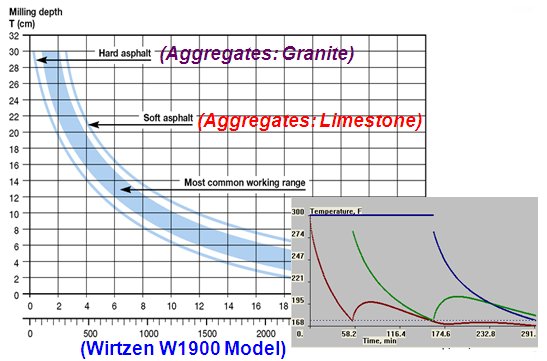
(Note: Graph is for the Wirtgen W1900 Model)
slide notes
None.
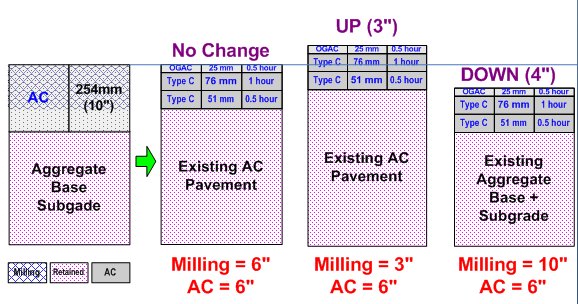
slide 28
Roadway Elevation Change No-, Up-, or Down-elevation
slide notes
None.
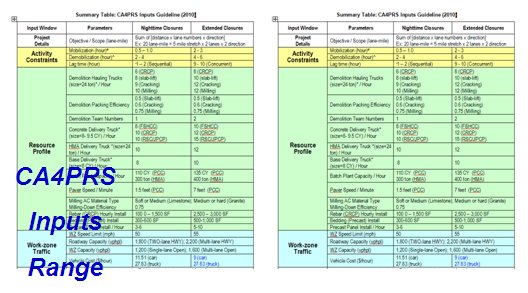
slide 29
CA4PRS Inputs Range
slide notes
None.
slide 30
I-15 Devore WZ Capacity: Full-closure Dynamic Lane Configuration Using QCMB
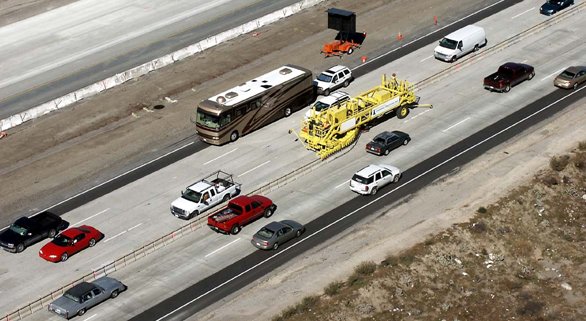
QCMB Operation Video
slide notes
None.
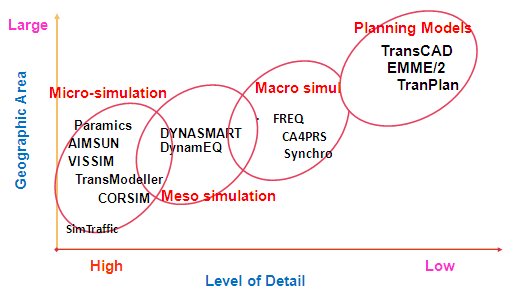
slide 31
Classification of Traffic Analysis Models Scale & Level of Detail
Bridging Gap: Transportation Planning and Traffic Operations
slide notes
None.
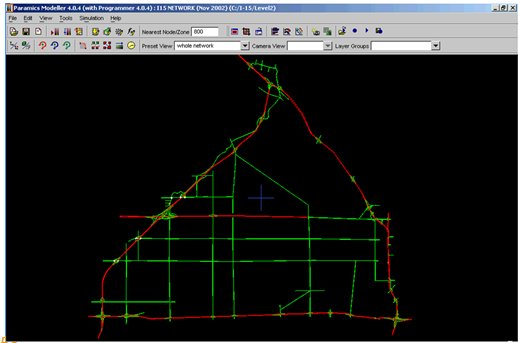
slide 32
I-15 Devore Simulation for TMP: Paramics Microscopic Network Traffic Analysis
slide notes
None.
slide 33
Vissim 3-D: Work-zone Lane-closure and Traffic-movement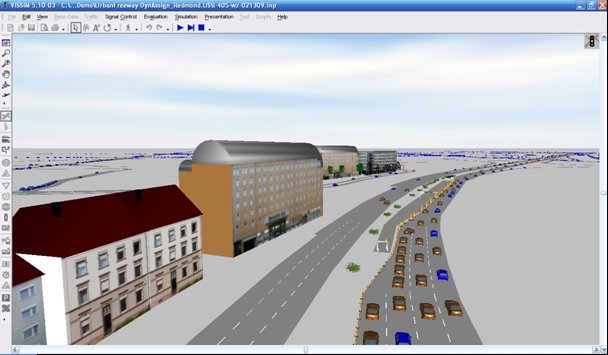
slide notes
None.
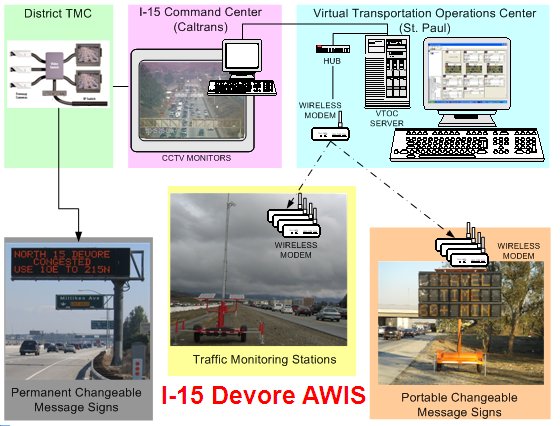
slide 34
I-15 Devore AWIS
slide notes
None.
slide 35
Challenges: WZ Simulation Tools
- Usability Challenges
- Limited work zone behaviors: utilize incident functionality
- Poor menu & interfaces for work zone configuration
- Need complicated post-analysis process: time & costs
- Weekend OD is not available: converted from Weekday data (peak-hour commuter traffic).
- Not enough model for travelers' learning mechanism short-term vs long-term closures (user equilibrium)
- Implementation Challenges
- Require large amount of data and calibration: time – cost
- User needs traffic and simulation knowledge (UE & SO)
- Usually expensive license of commercial package
- Oftentimes, outsourcing to consultants
slide notes
None.
slide 36
CA4PRS → LCCA Integration: I-15 HOT Widening
slide notes
None.
slide 37
I-15 Riverside Widening Life-Cycle Cost (30 analysis)
ACP needs $8M less Initial Cost, but $10M more LCC than PCCP
| Construction | Life | Year | AGENCY COST NPV Discounted ($ Millions) |
AGENCY COST Un-discount ($ Millions) |
|---|---|---|---|---|
| PCCP(40-yearLong-life) | ||||
| PCCP Widening | 40 | 2015 | $46 | $46 |
| 1st PCCP CAPM | 5 | 2055 | $1 | $3 |
| 2nd PCCP CAPM | 5 | 2060 | $2 | $9 |
| 3rd PCCP CAPM | 10 | 2065 | $2 | $11 |
| Annual Maint. Cost | $1 | $2 | ||
| PCCP Total | 60 | $51 | $71 | |
| ACP (20-yearStandard-life) | ||||
| ACP Widening | 20 | 2015 | $38 | $38 |
| 1st OGFC | 10 | 2025 | $3 | $4 |
| 1st ACP CAPM | 10 | 2035 | $7 | $15 |
| 2nd ACP CAPM | 10 | 2045 | $5 | $15 |
| 1st ACP Rehab. | 20 | 2055 | $5 | $24 |
| 2nd OGFC | 10 | 2065 | $1 | $4 |
| Annual Maint. Cost | $3 | $7 | ||
| ACP Total | 60 | $61 | $108 | |
| Difference (PCCP-ACP) | ($10) | ($37) | ||
slide notes
None.
slide 38
CA4PRS Implementation Issues
- Primary Users
- Agency: Planning, Roadway Design, Traffic Operations, Construction and Materials
- Industry: Consultants, Contractors, Vendors
- Candidate Projects
- Major maintenance, Rehab/Reconstruction, Widening projects
- High-profile, public outstanding, urban corridor projects
- Implementation Stages
- The earlier, the better; mainly in Design stage
- LCCA Interactions
- Analysis time needed
- Pre-construction Analysis (scenario comparison): 1-2 months
- Construction-staging plans and TMPs: about 2-3 months
- Data collection take time
- Incorporate with WZ network simulation: 6-12 months
slide notes
None.
slide 39
- CA4PRS Coding Platform
- MS Windows (~ Win 7)
- Visual Basic 6.0
- MS ACCESS DB (backend)
slide notes
None.
slide 40
Schedule Module
slide notes
None.
slide 41
Traffic Module
slide notes
None.
slide 42
Cost Module
slide notes
None.