CA4PRS I-5 and I-680 Projects
View the PDF
Version [1.1 MB]
![]() You will need the Adobe
Reader to view the PDFs on this page.
You will need the Adobe
Reader to view the PDFs on this page.
slide 1

- CA4PRS used for both projects.
- I-680 — Ready for bid. Start construction 2011. Commute corridor.
- I-5 — Middle of design stage. Start construction 2012 – 2 years. First CRCP during the 40 years. Freight corridor.
- Long life projects. High profile, high traffic urban freeway.
slide 2
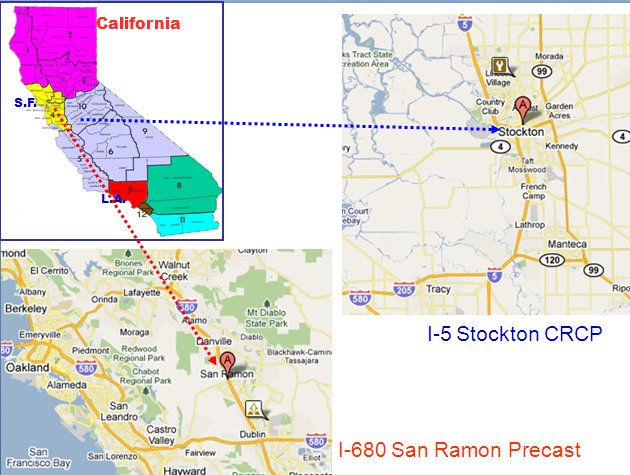
I-680 San Ramon (Walnut Creek) Precast and CSOL Rehabilitation
- $70M pavement rehabilitation project
- 12 miles of stretch: two rehab types
- 6 miles of CSOL: 3 layers HMA (6")
- 6 miles of Precast: 9" Precast + 6" LCB
- 4 lanes each direction, including 1 HOV
- about 170,000 ADT (7% trucks)
- Schedule estimate: about 500 working days
- Nighttime → 2-D Weekend → 1-D weekend → Nighttime
- Precast Type:
- Post-tensioning precast: Continuous lane-reconstruction
- Precast (Super slab): Random slab-replacement
- CA4PRS WZ Traffic: TMP & lane closure charts
- PeMS → data input to CA4PRS
slide notes
- Started with short (6-7 hour) nighttime closure – maximum delay 15 mins as standard. Caltrans policy 30 mins but district 4 is 15 mins.
- District 4 TMP engineers (15) had CA4PRS training in 2008 required by management. Recognized short term closure's negative impacats (lengthy, higher agency cost). Looked at innovative closures – if not applicable, increase nighttime to 8 – 9 hours closures.
- Started with 6-7 hour strategy – changed to 55-hour extended closure – discussion / disagreement among engineers involved. 55-hour too risky for without convenient detour route. Dropped 55-hour and selected 33-hour (Sat night to Monday AM).
- Developed TMP for 33-hour. Just before went to bid District Construction Engineer still concerned with 33-hour closure and the real difference in production between 33-hour vs. nighttime. Worried about impact local area residents. With 5% no show (in So. CA typically get up to 20% demand reduction public outreach), the delay would be tolerable for 33-hour but perception was otherwise and decided to go with 8-9 hour nighttime closure.
- If total length of slabs to be replaced > 400', used post-tensioning continuous, else Precast (Super Slab)
slide 3
slide notes
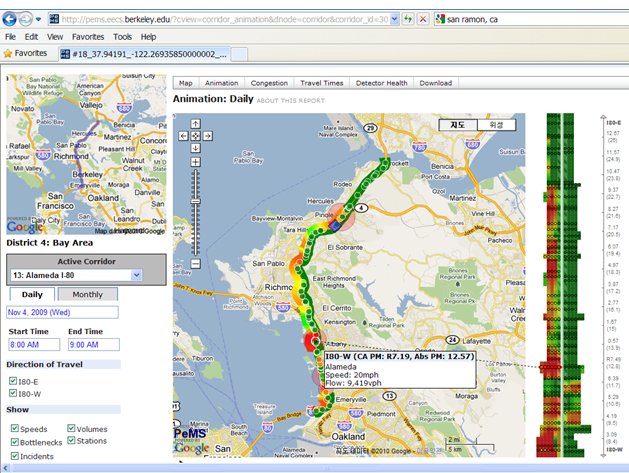
- PeMS (Highway Performance Measurement System) – enabled easy access and direct reading of hourly traffic demand by direction. Not only most current and location specific data but ease of access made it a success. Live traffic data includes historical data. Can export hourly demand by particular day / or average over selected duration.
- During the last 12 years PeMS was operated from UCB and Caltrans did not widely use. During last year, it was moved to Caltrans domain and is used widely.
- Until PeMS was available, they have to get hard copies of hourly traffic demand from internal traffic data base and manually enter it. Traffic database is electronic but export feature was not available or easy to access.
- PeMS initial developer started a company to further develop and manage PeMS for CA. Recently also joined force with traffic.com to deploy to other states. Traffic.com paying for the hardware and all costs and SHAs are getting the data free of charge for next 20-30 years. Utah on board in 2008.
slide 4
slide notes
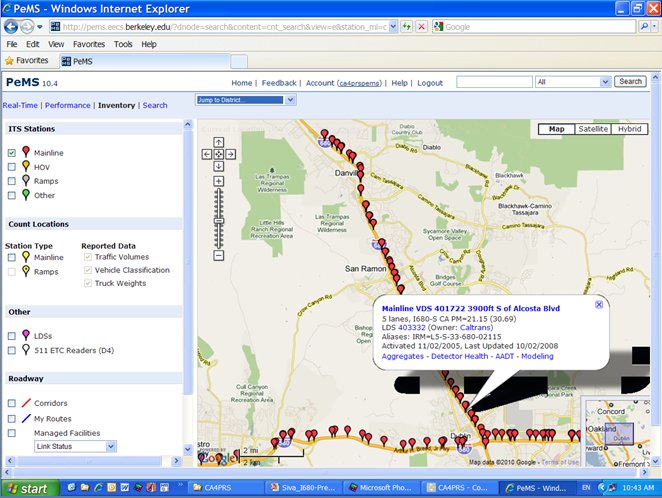
- Location of loop detector stations near the project site. Work-zone delay analysis is done for many loop detector locations within the project.
slide 5
slide notes
- The TMP Engineer navigates through loops and select locations to export data and to be analyzed.
slide 6
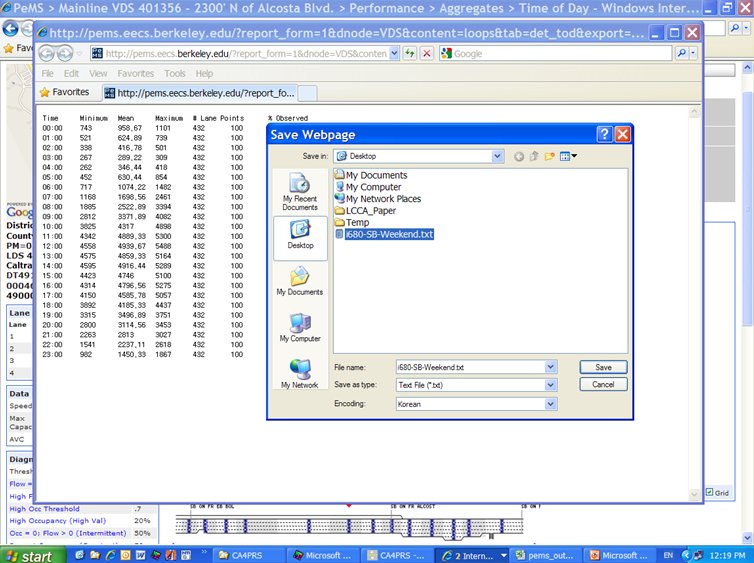
slide notes
- Exporting of August, Sunday, Saturday average one Month SB data.
slide 7
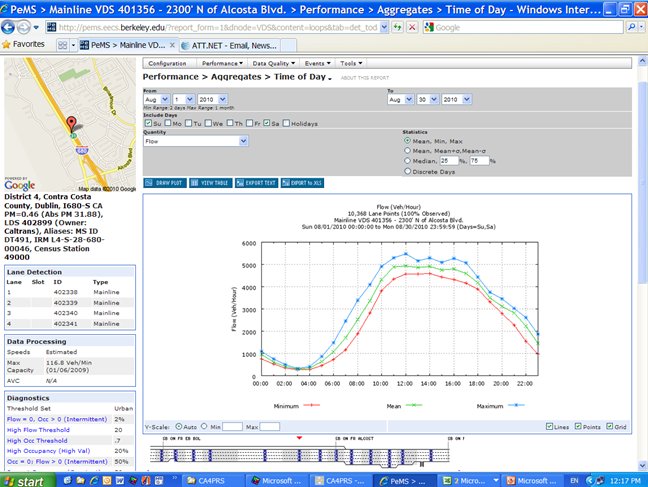
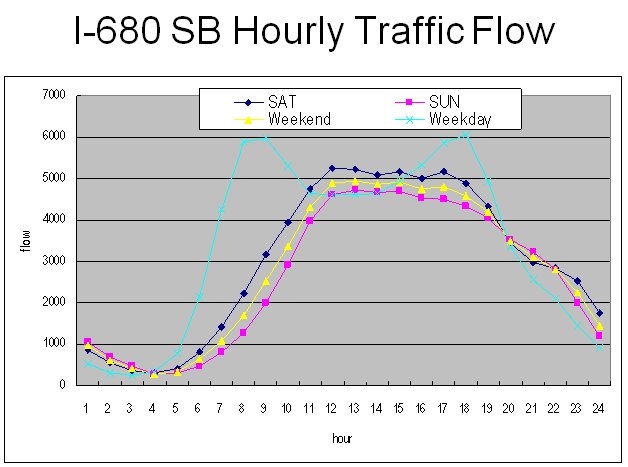
I-680 SB Hourly Traffic Flow
slide notes
- I-680 SB monthly average traffic demand. Saturday has 10% more than Sunday – reason for TMP pick Sunday (33-hour closure) only closure.
slide 8
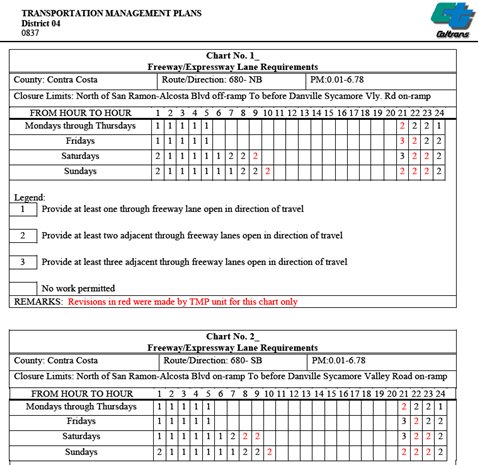
Lane Closure Charts: 9-h Nighttime
slide notes
CA4PRS work-zone module simulates this lane closure strategy for traffic analysis. Use CA4PRS work-zone module to optimize the lane open chart.
slide 9
I-5 Stockton CRCP Rehabilitation
- $42M pavement rehabilitation project
- 2.5 miles of stretch: CRCP (40 year long-life)
- 4 lanes each direction
- Scope = 2.5 miles x 4 lanes x 2 dir + aux = 21 lane-mile
- 13 inch CRCP + 3" ACB
- About 140,000 ADT (25% trucks)
- Contract duration: about 2 years
- Continuous closure daytime-shift only construction
- Estimated about 1 year → CA4PRS indicates 2 years
- WZ Traffic
- 2 lane open with 2 lane closure: too much delay
- Considering 1 lane couterflow on opposite side
slide notes
- Initial plan was 2 lanes open without counted flow. Analysis showed 6 hour delay. So, went to counter flow taking 1 lane from the other direction.
- Preliminary estimate based on experience 1-year. Based on CA4PRS, longer than that – 2 year.
- It is possible CRCP may be changed to JPCP.