Feasibility Study on Implementation of CA4PRS in Oklahoma
slide 1
September 23, 2010
Saeed Abdollahipour, doctoral student
David Jeong, Ph.D. Assistant Professor
School of Civil & Environmental Engineering Oklahoma State University
View the PDF
Version [1.1 MB]
![]() You will need the Adobe
Reader to view the PDFs on this page.
You will need the Adobe
Reader to view the PDFs on this page.
slide 2
Outline
- Introduction
- CA4PRS Workshop
- Case Studies
- Resource Profile Information
- Development of a Model for Resource Profile Information
- Limited Number of Activities
- Conclusions
slide 3
Introduction
slide 4
Roads Condition in Oklahoma
- 40% of Oklahoma's major roads are rated in poor or mediocre condition (ASCE 2009).
- Costs Oklahoma motorists $1 billion a year in extra vehicle repairs and operating costs (OTC 2009).
- Total projected revenues from FY2009 to FY2028 amount to 39 percent of needs, resulting in a shortfall of $16.9 billion (ODOT 2009).
- Urgent need to improve management strategies; minimize the costs and optimize rehabilitation activities.
slide 5
Objectives
- Study the feasibility of using CA4PRS for PCC pavement rehabilitation projects in Oklahoma
slide 6
CA4PRS Workshop
slide 7
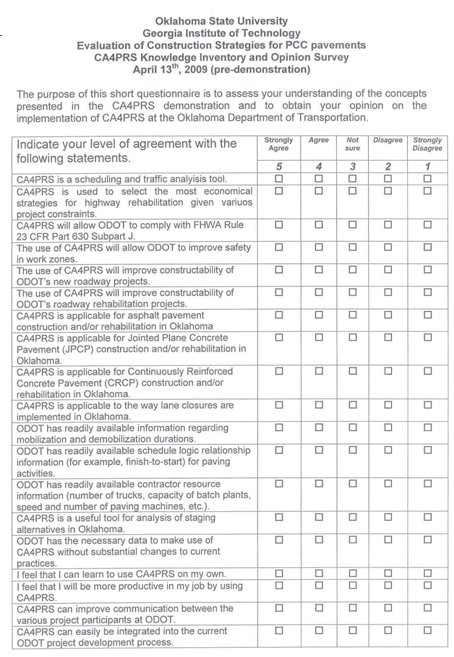
CA4PRS One day Workshop
- Date: April 13, 2010
- Instructor: Dr. E.B. Lee
- Participants: ODOT Engineers
- Survey Topics:
- General knowledge of the program
- Applicability to ODOT operations
- Potential for improvement of process
- Availability of information
- Usability of the program
slide 8
CA4PRS One day Workshop
- Questionnaire
slide 9
Survey Results
slide 10
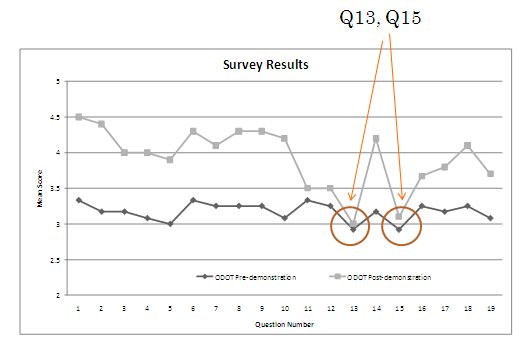
Interpretation of Results
- A general increase (approximately 20%) in the level of agreement with the potential applicability of the program for analysis of procedures used in Oklahoma.
- A general increase in the level of agreement of participants with the idea that CA4PRS could improve ODOT current practices.
- Participants have been consistent with their perception that ODOT does not have the readily available input information to run CA4PRS (Q13, Q15).
slide 11
Case Studies
slide 12
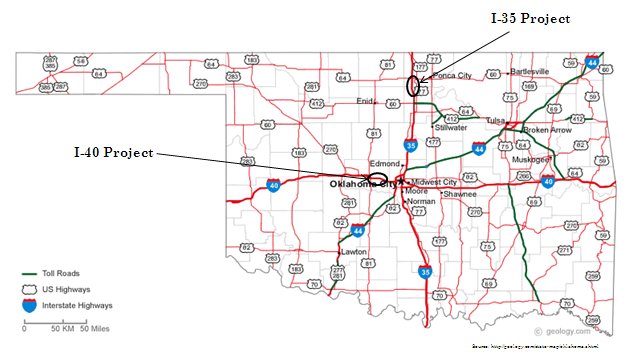
Case Projects
- Two PCC pavement rehabilitation projects studied (I-35 & I-40)
- I-35 is finished / I-40 is ongoing
slide 13
I-35 Scheduling & Traffic Analysis
slide 14
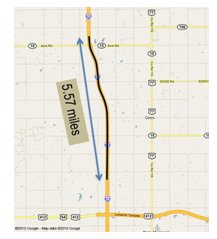
Project Overview
- North-South Interstate highway
- Two lanes in each direction
- Project starts from the mile post of 197 and ends in the mile post of 204
slide 15
Rehabilitation Profile
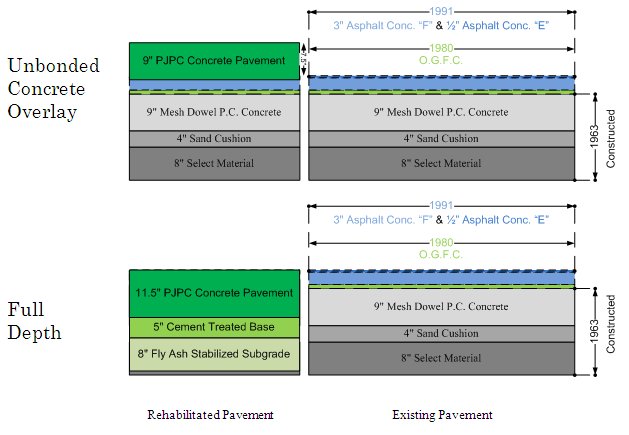
slide 16
Contractual Features
- A+B Contract; A=$13.1 M & B=275 c-days
- Incentive/Disincentive → $7,500/c-day
- Incentive Cap → 90 c-days
- Started on August 2009
- Finished on May 2010
- Actual Duration → 275 c-days
slide 17
Problems Faced During Analysis
- The project had to be divided into different phases in order to be modeled by CA4PRS.
- Resource profile information had to be collected by performing regular site visits.
- Neither ODOT nor contractors had information regarding Mobilization, Demobilization, and lead lag times.
slide 18
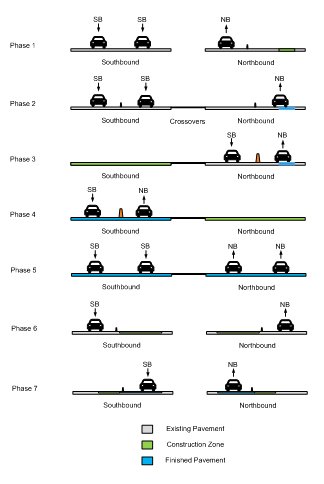
Phasing plans
- Phase 1: 6' concrete temporary shoulder
- Phase 2: Construct X-overs
- Phase 3: 2x12'+1x14' Overlay & Full Depth
- Phase 4: 2x12'+1x14' Overlay & Full Depth
- Phase 5: Open lanes
- Phase 6: 2x12' inside lanes mill & overlay
- Phase 7: 2x12' outside lanes mill & overlay
slide 19
Analysis & Results
| Phase | Description | Duration (working days) | User cost ($) |
|---|---|---|---|
| 1 | NB temporary shoulder | 15 | 51,108 |
| 2 | Pave crossovers | 5 | 14,720 |
| 3&4, Section 1 | SB & NB Concrete overlays | 47 | 176,736 |
| 3&4, Section 2 | SB & NB full depth reconstruction | 85 | 498,027 |
| 6&7 | Mill and overlay | 4 | 23,552 |
| 8 | Other activities | 38 | 322,869 |
| Total | 194 | 1,087,012 |
- Considering 15% expansion; the final suggested duration for this project would be 230 working days or 316 c-days.
- Has been scheduled and finished by the contractor in 200 working days or 275 c-days.
- Actual productivity rate of the project was higher than CA4PRS calculations.
- User cost per c-day = $4,000 < Actual Incentive = $7,500 / c-day
slide 20
I-40 Scheduling & Traffic Analysis
slide 21
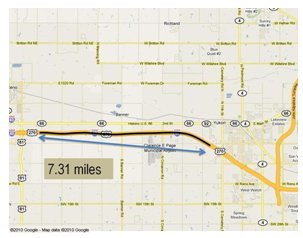
Project Overview
- West-East Interstate highway
- Two lanes in each direction
- Project starts from the mile marker 125 to mile marker 136.
- Still on going
slide 22
Contractual Features
- A+B Contract; A=$59 M & B=800 c-days
- Incentive/Disincentive → $15,000/c-day
- Incentive Cap → 150 c-days
- Liquidated damage →$2,000/c-day
- Lane Rental Fee → $30,000/hour
| Time | Monday thru Friday | Saturday | Sunday |
|---|---|---|---|
| 12 am – 6 am | $0 | $0 | $0 |
| 6 am – 9 am | $30,000 | $0 | $0 |
| 9 am – 12 pm | $30,000 | $0 | $0 |
| 12 pm – 6 pm | $30,000 | $30,000 | $30,000 |
| 6 pm – 9 pm | $30,000 | $30,000 | $0 |
| 9 pm – 12 am | $0 | $0 | $0 |
slide 23
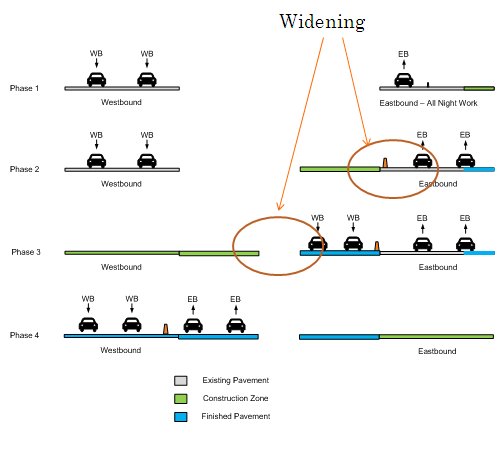
Unique Features
- Phase 1: 10' concrete temporary shoulder
- Phase 2: 28' EB widening
- Phase 3: Reconstruction and WB widening
- Phase 4: EB Reconstruction
slide 24
Problems Faced During Analysis
- Most of the activities could not be modeled by CA4PRS.
- The project was a combination of widening and rehabilitation which is not supported by CA4PRS.
- Project was divided into four phases for traffic analysis.
slide 25
Results and Analysis
| |
Duration | User Cost | Queue |
|---|---|---|---|
| Phase 1 | 50 | $528,958.00 | Saturdays 6 am - 12 pm |
| Phase 2 | 200 | $1,589,221.00 | - |
| Phase 3 | 200 | $3,178,443.00 | - |
| Phase 4 | 100 | $1,589,221.00 | - |
| Total | $6,885,843.00 |
- User cost per c-day = $8,700 < Actual Incentive = $15,000 / c-day
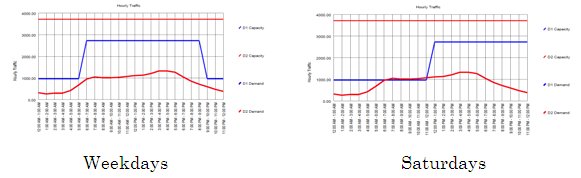
- Traffic demand is more than capacity from 6 am to 12 pm during Saturdays
- User cost for closing one lane = $27,000/hr ≈ Lane Rental Fee = $30,000/hr
slide 26
Resource Profile Information
slide 27
Scheduling Process of CA4PRS
- The results are highly dependent on resource profile information.
slide 28
Observed Resource Information
| Resource Description | Suggested Input Data | Minimum Observed | Maximum Observed | Mean | CA4PRS Manual |
|---|---|---|---|---|---|
| Demolition Hauling Truck |
|
3 | 5 | 4 | 8 to 13 |
| Base Delivery Truck |
|
2 | 20 | 7 | - |
| Batch Plant |
|
||||
| Concrete Delivery Truck |
|
5 | 22 | 14 | 9 to 16 |
| Paver |
|
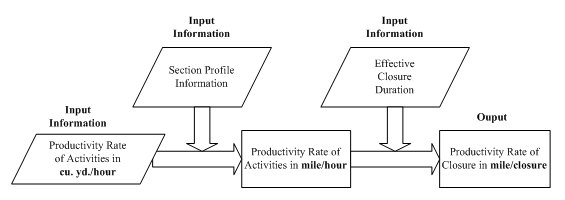
(Productivity Rate Required in Oklahoma) < (Productivity Rate Required in California)
slide 29
Assessment of Resource Analysis
| Resource | Allocated | Utilized |
|---|---|---|
| Demolition Hauling Truck (per Hour per Team) | 10 | 10 |
| Base Delivery Truck (per Hour) | 5 | 5 |
| Batch Plant (cu-yd/hour) | 120 | 120 |
| Concrete Delivery Truck (per Hour) | 20 | 16.7 |
| Paver Speed (ft/min) | 6.6 | 4.6 |
slide 30
Development of a Model for Resource Profile Information
slide 31
Cyclone Simulation Model
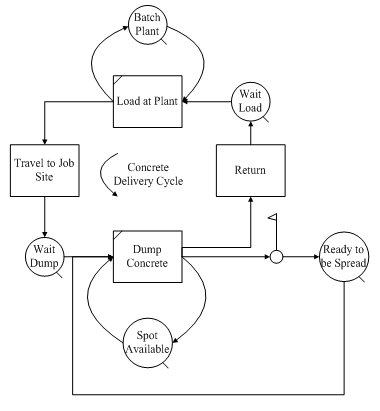
| Tasks | Duration (min) | Resources | Numbers |
|---|---|---|---|
| Load at Plant | 5 | Batch Plant | 1 |
| Travel to Job Site | 15 | Trucks | 10 |
| Dump | 10 | Spot Available | 1 |
| Return | 15 |
slide 32
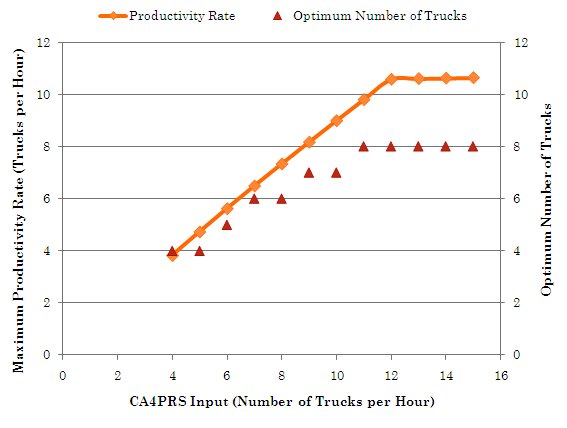
- Productivity does not increase necessarily by increasing CA4PRS input variable or by increasing the total number of trucks.
- There is a maximum productivity rate which is achieved by the CA4PRS input of 12 Trucks per Hour.
- Optimum number of trucks (which is required by contractors) is different from CA4PRS input.
slide 33
Distance from Batch-Plant
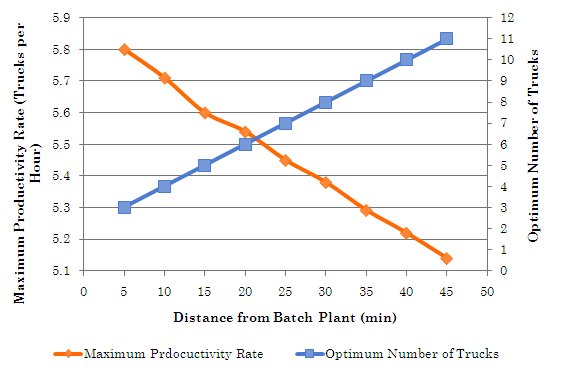
- The further the distance from the Batch Plant the less the productivity rate is.
- The further the distance from the Batch Plant the more trucks are needed, but even by allocating more trucks the maximum productivity rate decreases.
slide 34
Limited Number of Activities
slide 35
CPM Analysis
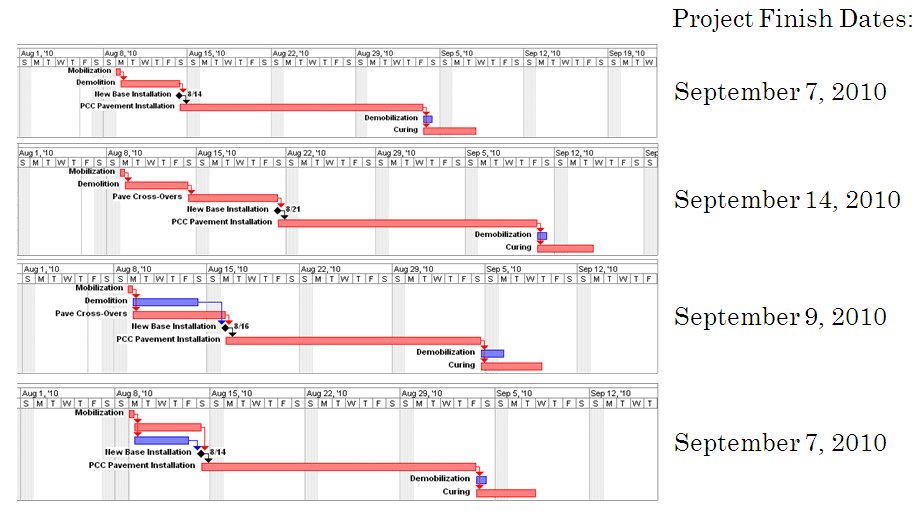
- The relationship between the main activities in CA4PRS and other rehabilitation activities not available in CA4PRS is critical
slide 36
Conclusions
slide 37
Results
- Contractor finished the project 30 working days sooner than CA4PRS schedule.
- User cost calculated by CA4PRS ($4,000/day) is smaller than actual incentive amount ($7,500/day). (the incentive amount has been set higher to encourage the contractor to accelerate the project)
- Scheduling module cannot be used properly for large size rehabilitation projects (I-40).
- Lane rental fee calculated by CA4PRS in I-40 project is almost the same as ODOT calculations.
- The ODOT user cost calculation process is not considering the difference between traffic patterns during weekdays and weekends. CA4PRS provide the required platform for a more comprehensive work zone traffic analysis.
- The Agency Cost module was not utilized in case projects.
slide 38
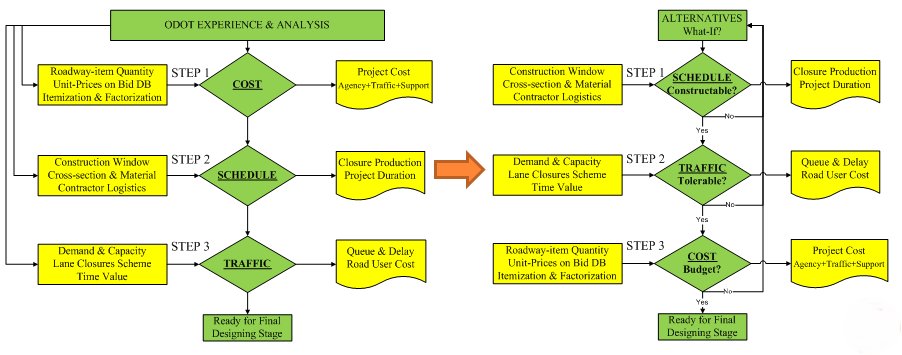
Recommendations
- ODOT; based on experience.
- Innovative; compare What-If scenarios, the optimized scenario is selected.
slide 39
Recommendations
- The Construction Windows and Working Methods are limited in Oklahoma therefore there is a limited number of what-if scenarios.
- Currently, there is no any reliable resource profile database in ODOT.
- The daily traffic distribution data is required for Work-Zone traffic analysis.
- ODOT is encouraged to start collecting resource profile information for scheduling analysis.
- ODOT may start scheduling the projects with CA4PRS in the inception phase but they are not encouraged to use CA4PRS scheduling module extensively until the necessary data base is available.
- ODOT is encouraged to start using the Work-Zone Analysis module of CA4PRS and replace it with the existing spreadsheet program.
slide 40