CA4PRS Application for Determination of Incentive/Disincentive Dollar Amount
slide 1
Federal Highway Administration
CA4PRS Peer Exchange Workshop
St. Louis, MO
Jae H. Pyeon
Assistant Professor
Department of Civil and Environmental Engineering
San Jose State University
E. B. Lee
Associate Researcher
Institute of Transportation Studies (UC-PRC)
University of California at Berkeley
View the PDF
Version [592 KB]
![]() You will need the Adobe
Reader to view the PDFs on this page.
You will need the Adobe
Reader to view the PDFs on this page.
slide 2
Agenda
- Overview of I/D Contracting
- I/D provisions for Early Completion
- Issues for Implementation of I/D Contracting
- Evaluation of I/D Project Performance
- Selection of I/D Projects
- Determination of I/D Dollar Amount
- Case Study
- I-80 Sacramento Project
- Recommendations for Future Study
slide 3
Improving Time Performance of Highway Construction Contracts
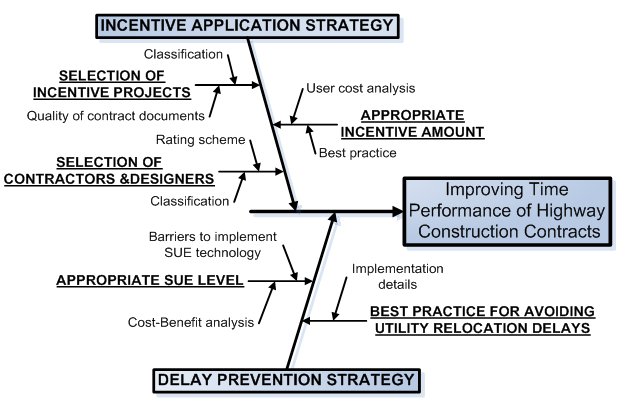
(Source: Pyeon 2010)
slide 4
Average Time and Cost Savings: I/D vs. Non-I/D
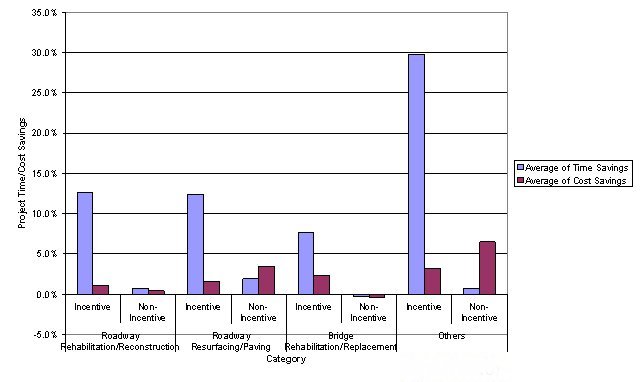
(Source: Pyeon 2010)
slide 5
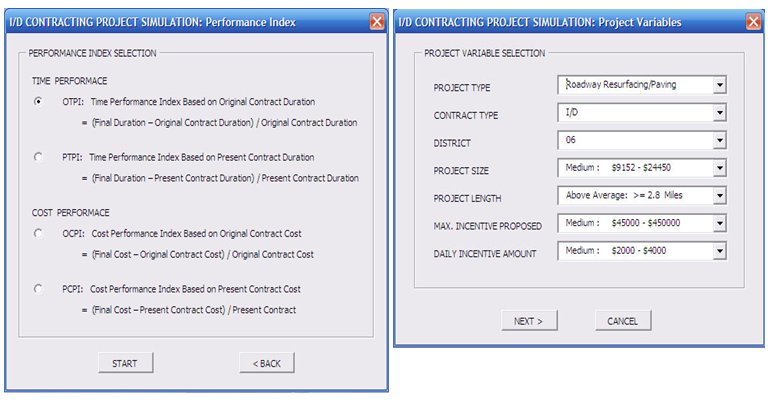
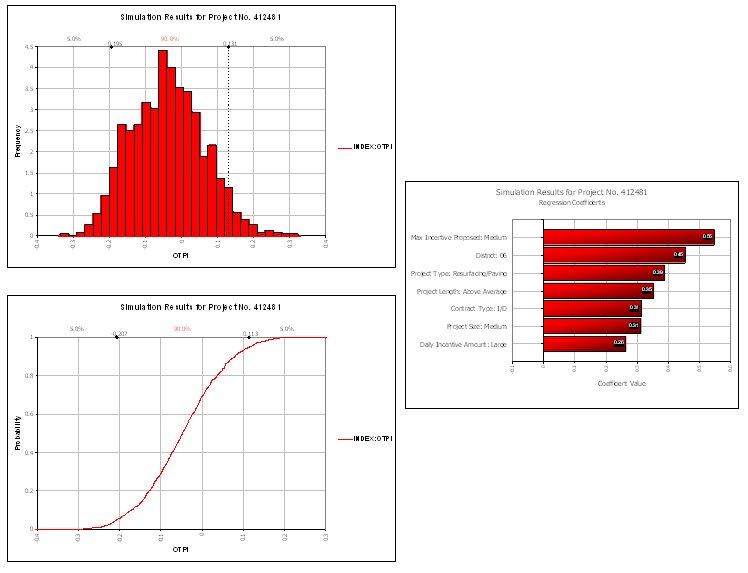
Decision Support Model to Predict Project Performance of I/D Contracts
slide 6
slide 7
Systematic Procedures to Determine I/D Dollar Amount Using CA4PRS
- STEP 1: Set up a schedule baseline
- STEP 2: Estimate the impact of work-zone on traveling public
- STEP 3: Use a factor to discount the value of the road user cost to match with agency cost
- STEP 4: Set up the maximum incentive amount using the closure incentive bonus and the achievable maximum number of closures
slide 8
Case Study: I-80 Sacramento Project
- Purpose of the project
- To rehabilitate about 8.6 miles of the existing roadway on I-80 in the City of Sacramento
- Need for the project
- The concrete pavement has deteriorated in both directions
- The Nos. 2 and 3 lanes are currently at first- and third-stage cracking and are beyond regular maintenance repair
- The outside shoulder is spalling and separating from the mainline roadway
- Annual Average Daily Traffic (AADT) on I-80 with three lanes
- Each direction is app. 140,000
- Expected to increase to app. 200,000 by 2030
- With roughly 10% of trucks
- Total project costs for all elements of the project
- Currently estimated at $93.1 million
- CA4PRS was used as a Value-Engineering analysis tool
- Construction is expected to start 2011
slide 9
Case Study:I-80 Sacramento Project
- The median is to be widened 17 feet with asphalt concrete pavement in both directions
- Designed for future HOV lanes in order to shift traffic during construction as primary detours
- Various random failed concrete slabs in the No. 1 lane will be replaced
- The Nos. 2 and 3 lanes will be replaced completely utilizing jointed plain concrete pavement (JPCP) with about 14-inch concrete slabs and 4-inch AC base
- The No. 3 lane is to be paved 14 feet wide
- Will provide lateral support for the lane
slide 10
Case Study: I-80 Sacramento Project
- Non-stop construction
- About 10 lane-mile segments on the mainline near off- and on-ramp areas at 7 interchanges are selected for weekend works using 12-hour curing-time rapid strength concrete
- Whereas majority of pavements in other areas are rebuilt using normal concrete with daytime-shift works behind K-rails with shifted detour traffic to the median side
slide 11
I/D Dollar Amount Decision
- STEP 1: Set up a schedule baseline
- Total number of weekend closures needed for the pavement rehabilitation, estimated from the CA4PRS schedule module
- Inputs for CA4PRS Schedule Analysis
- Project Details
- Schedule Analysis
- Closure Option, Section Profile, Lane Width, Curing Time, Working Method
slide 12
I-80 Sacramento Project: CA4PRS Schedule Analysis Input Screen (1)
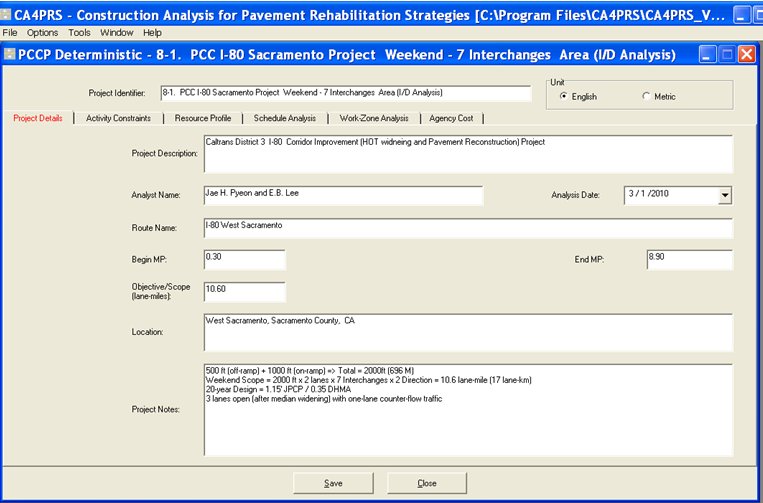
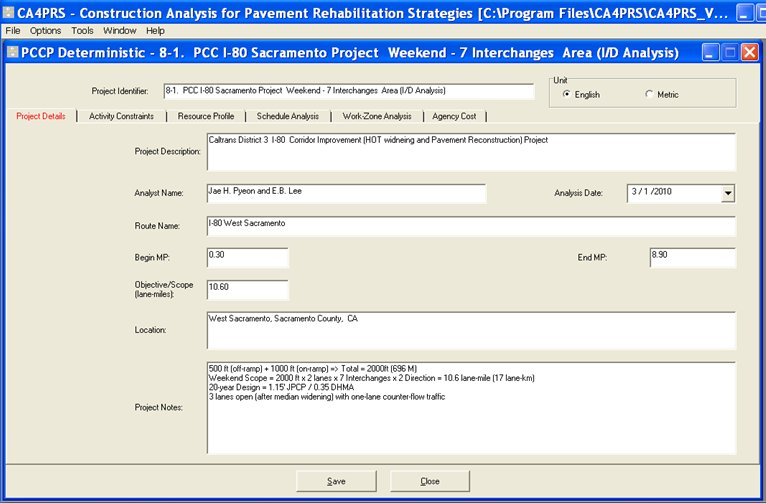
slide 13
I-80 Sacramento Project: CA4PRS Schedule Analysis Input Screen (2)
slide 14
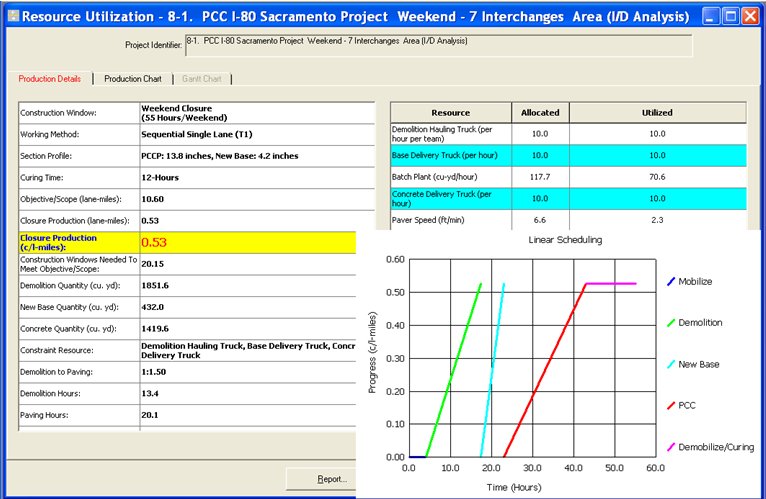
I-80 Sacramento Project: CA4PRS Schedule Analysis Output Screen
slide 15
Schedule Analysis Results
- About Twenty 55-hour weekend closures in total
- The CA4PRS schedule analysis
- Pavement rehabilitation of I-80 for the seven interchanges area
- Mathematically derived from:
- The total rehabilitation scope of about 10.6 lane-mile
- The typical rehabilitation progress of about half-mile (0.53 lane-mile) per weekend closure
- It is recommended to add about four weekend closures for schedule contingency
- Based on Caltrans experiences on the similar previous pavement rehabilitation projects
- It might be practical to utilize these four extra weekend closures as the source of the maximum incentive closures
slide 16
I/D Dollar Amount Decision
- STEP 2: Estimate the impact of work-zone on traveling public
- Road user cost per weekend closure using the Caltrans standard hourly time value
- $11.51 per car and $27.83 per truck
- Inputs for CA4PRS WZ User Delay Cost Analysis
- Roadway Capacity Information
- Before and During Construction
- Traffic Information
- Traffic Demand
- Vehicle Costs
- Roadway Capacity Information
- Road user cost per weekend closure using the Caltrans standard hourly time value
slide 17
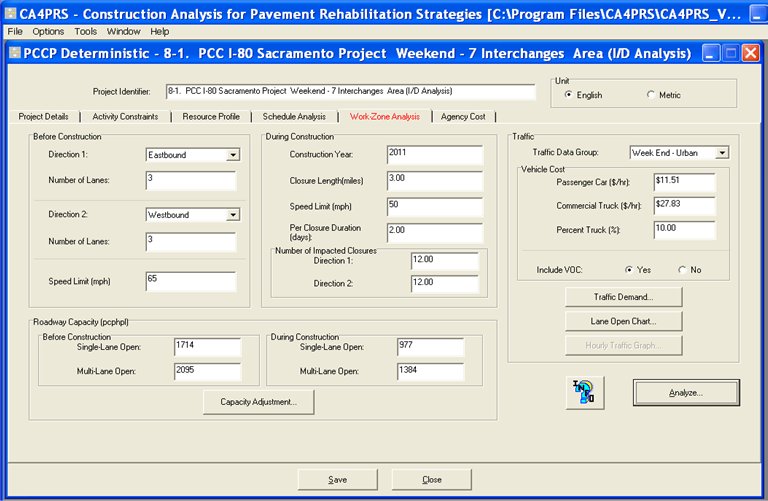
I-80 Sacramento Project: CA4PRS WZ User Delay Cost Analysis Input Screen
slide 18
I-80 Sacramento Project: CA4PRS WZ User Delay Cost Analysis Output Screen
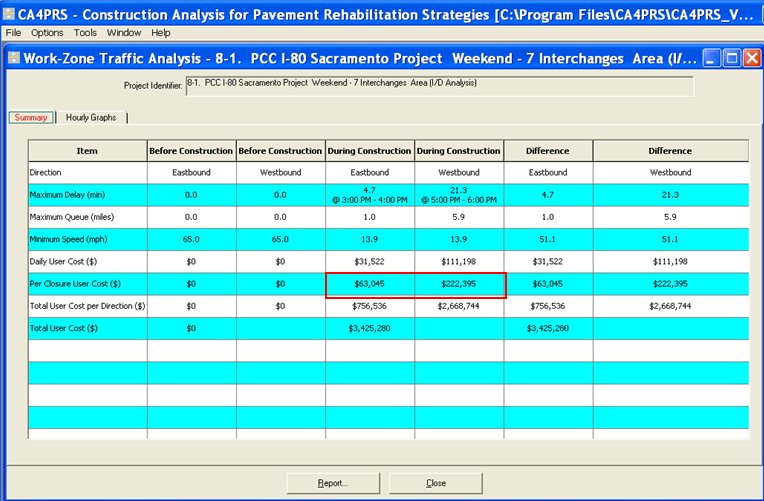
slide 19
WZ User Delay Cost
- The CA4PRS Traffic module shows that each 55-hour weekend closure causes app. $300,000
- App. $60,000 for the east bound traffic
- App. $220,000 for the west bound traffic
- This means that if the contractor reduce one weekend closure, it will save about 1/3 million dollar road user cost
slide 20
I/D Dollar Amount Decision
- STEP 3: Use a factor to discount the value of the road user cost to match with agency cost
- Usually state DOTs treat the value of $1 road user cost less than their real cost (I/D) $1
- A discount factor might be used to convert the closure road user cost to the closure I/D payment to the contractor
- The discount factor is usually in the range of 1 through 5
- Depends on the project situation
- Lane closure impact and political priority of the project completion
slide 21
Discount Factor
- I-15 Devore project
- A discount factor of 4 is used ? 75% discount
- I-80 Sacramento project
- If "3" is used as the discount factor
- Then the closure I/D amount should be one-third of the closure road user cost of app. $300,000
- $100,000 I/D amount for one weekend closure
- If the discount factor 4 is used
- Then the I/D amount is $75,000 per weekend closure
- i.e., $300,000/4=$75,000.
- Then the I/D amount is $75,000 per weekend closure
- If "3" is used as the discount factor
slide 22
I/D Dollar Amount Decision
- STEP 4: Set up the maximum incentive amount using the closure incentive bonus and the achievable maximum number of closures
- Total 4 weekend closures for a contingency
- Added on top of the baseline closure number 20 weekends
- The maximum incentive amount (as a cap) can be limited to:
- DF=3: $400,0000 ($100,000 per closure X 4 closures)
- DF=4: $300,000 ($75,000 per closure X 4 closures)
- No limitation for the maximum disincentive (penalty) amount is recommended
- To make sure that the project completion is not out of agency's control
- The cap of the incentive payment should be also considered with respect to the project budget limit
- Total 4 weekend closures for a contingency
slide 23
Conclusions and Recommendations
- Agency cost saving from the closure number reduction should be included in the incentive amount calculation
- Less closures require less traffic handling costs
- Moveable concrete barriers and detour and advisory signs
- Less closures will reduce the project and TMP costs
- Work-zone incident management, so-called COZEEP (construction zone enhanced enforcement program) to provide California highway patrol service
- About $95 per hour per officer and towing services (freeway patrol service)
- Less closures require less traffic handling costs
slide 24
Conclusions and Recommendations
- Less closures also saves agency's supporting cost
- Field engineer's time on site and administration cost can be reduced proportionally
- Usually about 5 engineers and inspectors per shift and 3 shift per day is needed to the non-stop construction on weekend
- Field engineer's time on site and administration cost can be reduced proportionally
- The contractors might bear additional cost
- Probably be enough triggered by the incentive bonus to shorten closures number
- The contractors need to utilize more resources
- Equipment, plants, and labors on site to achieve more construction production.
- In fact, the contractors can get some advantage in their cost saving with less closures as they can reduce their project overhead cost
slide 25
Future Study
- More advanced Incentive/Disincentive amount assessment procedure and calculation module should be developed
- To cover not only the baseline of the road user cost but also other factors
- Project cost saving or cost results from the traffic costs, agency supporting cost, contractors' cost, etc.
- To cover not only the baseline of the road user cost but also other factors
- More systematic procedures to determine a Discount Factor
- CA4PRS can be expanded to accommodate the analytical capability of more comprehensive I/D dollar amount calculation with the additional factors discussed above
slide 26