4. Detailed Results
This section presents the results of the 2012 WZ SA at a more detailed level. The results represent a compilation of ratings and comments submitted from 52 Divisions/States. For each section of the WZ SA, the information includes:
- An explanation of the intent of the section;
- National average ratings for each question in the section and comparative data from the 2011 WZ SA; and
- The questions asked in that section with a question-by-question discussion of the ratings, including the percentage of agencies implementing the practice asked about in the question (meaning they rated themselves at 7 or higher) and a summary of comments included by respondents in the results they submitted.
This section also provides a summary of responses to the 2012 supplemental question on work zone process reviews.
Many respondents provided comments for some questions. The respondents that provided comments offer helpful examples of some of the specific practices and efforts being undertaken to make work zones work better. Examples of agency comments are included in the write-up after each question.
Another rich source of examples is the FHWA Work Zone Program website at https://www.fhwa.dot.gov/workzones. The website contains work zone publications, studies, links, training information, technical resources, and best practices, as well as guides and State DOT examples to support implementation of the Work Zone Safety and Mobility Rule (23 CFR 630 Subpart J).
Since 2007, the WZ SA has included linkages, as applicable by question, to the appropriate sections of the Work Zone Rule. As agencies worked to implement the Work Zone Rule by the October 12, 2007 deadline, these efforts have affected the ratings in a positive way.
Leadership and Policy
Agency leadership support should drive overall policy making for the agency. This support fosters an environment conducive to developing an effective work zone program. Project planning, design, and construction and maintenance activities should all incorporate consideration of work zone safety and mobility impacts and mitigation strategies. Agency management should facilitate and encourage a multidisciplinary approach to traffic management throughout all phases in the life of a project. Senior managers should be personally, visibly, and proactively involved in efforts to enhance the safety of motorists and workers in work zones and minimize work zone delays.
Goals provide high-level direction and establish expectations for agency staff. Clear and specific goal statements such as "Reduce congestion and delay in work zones by 10 percent in 5 years" establish a basis on which to develop strategies and actions. Use of performance measures helps to assess progress toward fulfillment of a goal. For example, to track progress toward reduction of work zone delays, an agency may gather information regarding the total vehicle hours of delay for a sample of work zones and track these values over time.
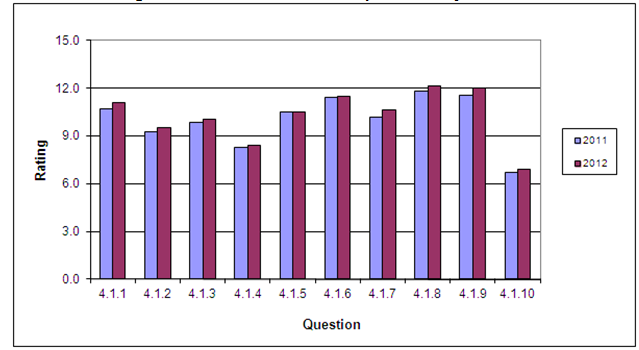
Figure 2 shows the average rating by question for 2011 and 2012 for the Leadership and Policy section. Table 3 shows the numeric ratings along with the percent change for each question.
Figure 2. Results for Leadership and Policy Section
| Section | 2011 | 2012 | Change | Percent Change |
|---|---|---|---|---|
| 4.1.1 | 10.7 | 11.1 | 0.4 | 3% |
| 4.1.2 | 9.3 | 9.5 | 0.3 | 3% |
| 4.1.3 | 9.8 | 10.0 | 0.2 | 2% |
| 4.1.4 | 8.3 | 8.4 | 0.1 | 2% |
| 4.1.5 | 10.5 | 10.5 | 0.0 | 0% |
| 4.1.6 | 11.5 | 11.5 | 0.0 | 0% |
| 4.1.7 | 10.2 | 10.6 | 0.5 | 5% |
| 4.1.8 | 11.8 | 12.2 | 0.3 | 3% |
| 4.1.9 | 11.6 | 12.0 | 0.4 | 4% |
| 4.1.10 | 6.7 | 6.9 | 0.2 | 3% |
The average ratings increased for most of the questions in this section. Question 7 on establishing standards for work zone performance saw the largest increase (5 percent). Questions 5 and 6 stayed the same (question 5 decreased the previous year). Each question except for question 10 had a national average rating of 7 or greater, indicating that, on average, agencies are implementing the practices covered in this section. The average rating for question 10 continues to approach the implementation level (7).
4.1.1 Has the agency developed a process to determine whether a project is impact type I, II, III, or IV? Forty-nine agencies (94 percent) have developed a process to determine the impact type of projects. While the average rating on this question increased, one fewer agency is implementing this practice as compared with 2011. This agency commented that they have developed a process but that it has not been disseminated. Several agencies cited use of a process to filter out significant projects without classifying all projects based on impact type I, II, III, or IV. A few agencies cited use of a project classification process, but do not specifically categorize projects as type I, II, III, and IV, or indicated they use a different rating system. Nearly all agencies noted attention to the significance of projects, with a focus on mitigating the impacts. One agency noted that their process is new and has not yet been fully implemented and another indicated they have made progress with routinely categorizing projects and will continue to reinforce the importance of the process.
4.1.2 Has the agency established strategic goals specifically to reduce congestion and delays in work zones? Forty agencies (77 percent) indicated that they have strategic goals to reduce work zone congestion and delays, with some agencies noting that they are currently in the process of developing strategic goals. Several agencies cited specific performance measures as they relate to mobility goals. Several agencies noted that they do not have specific numeric goals due to a lack of performance measures or that their goals are inherent through process, but not written. A few agencies cited goals or strategies to lessen work zone congestion and delay that were defined in their Strategic Highway Safety Plan (SHSP). Two agencies indicated that reducing the impacts caused by work zones is integrated in the agency's culture or has been communicated strongly by leadership.
4.1.3 Has the agency established strategic goals specifically to reduce crashes in work zones? Forty-one agencies (79 percent) have strategic goals specifically to reduce crashes in work zones. Five agencies mentioned having work zones as an emphasis area in their SHSP. Several agencies mentioned a strategic goal of reducing work zone fatalities, with a small number of agencies mentioning a specific goal such as zero work zone fatalities. Several other agencies noted that they are monitoring work zone crashes, but no specific goals have been set. Three agencies responded that the lack of a specific goal was due to issues related to data. One agency noted that they try to anticipate upcoming crash patterns using similar projects and proactively address the anticipated crashes. Another agency indicated they use all crash data, not just severe, to assess work zone safety and include the frequency of intrusions. Several agencies cited the use of strategies for reducing crashes, even though goals may not have been formally established.
4.1.4 Has the agency established measures (e.g., vehicle throughput or queue length) to track work zone congestion and delay? Thirty-seven (71 percent) of the agencies are implementing measures to track work zone congestion and delay, an increase from 33 agencies in 2011. Several agencies indicated they are monitoring congestion and delay although formal performance measures have not been established. One agency has established a capacity value for a single lane in a work zone as a first step toward establishing performance measures for congestion and delay. Another agency has established a specific delay measure that includes a maximum of 30 minutes of delay per project. Two agencies indicated the need to determine the state of the practice for establishing performance measures for work zone congestion and delay. Two agencies cited pending research that will help them determine performance measures, while one agency said they have defined performance measures but lack the funding to establish a tracking system.
4.1.5 Has the agency established measures (e.g., crash rates) to track work zone crashes? Forty-one agencies (79 percent) have established measures to track work zone crashes. The average rating for this question had no change from 2011. Most agencies cited work zone crashes as the primary performance measure established. One agency noted an emphasis on severe crashes, while another noted crash type as the primary performance measure. Several agencies mentioned regular reporting of work zone crashes, through quarterly or annual reports, through SHSP goals, or by project. Four agencies noted that they have recently implemented improvements to work zone crash reporting. Two of these agencies have created and populated or are in the process of creating a crash database, one agency has recently implemented a new crash reporting form, and another has started correlating crashes with lane closures. These improvements to data collection and reporting will support analysis and may help agencies further define and establish performance measures. A few agencies cited further need for timely dissemination of crash data and tracking of baseline data.
4.1.6 Has the agency established a policy for the development of Transportation Management Plans to reduce work zone congestion and crashes? Forty-nine agencies (94 percent) are implementing a policy for the development of Transportation Management Plans (TMPs) to reduce work zone congestion and crashes. Most agencies cited a policy or guidance document that outlines the considerations for development of a TMP. One agency mentioned their development of a TMP template. The average rating of this question had no change between 2011 and 2012. While all agencies may not have a TMP policy, all agencies are developing TMPs (per question 4.3.2).
4.1.7 Has the agency established work zone performance guidance that addresses maximum queue lengths, the number of open lanes, maximum traveler delay, etc.? Standards for work zone performance guidance have been established in 46 agencies (88 percent). The average rating of this question increased 5 percent (from 10.2 to 10.6) between 2011 and 2012. Several agencies noted use of proactive policies for when to allow lane closures and other capacity restrictions based on time of day, season, and anticipated demand, which are based on estimates of metrics such as queue length and delay. One agency cited their use of a requirement for a construction contingency plan to guarantee on-time opening of lanes. Several agencies noted the use of mobility guidance and tools to address maximum queue length and traveler delay, and to identify situations when lane closures may be appropriate at the project level. Some agencies cited specific values for maximum delay (e.g., 10 minutes additional travel time caused by the work zone) and Level of Service (e.g. LOS D). Two agencies cited revisions to their current policies to include performance guidance to lessen impacts on interstates and ramps from cross street projects.
4.1.8 Has the agency established criteria to support the use of project execution strategies (e.g., night work and full closure) to reduce public exposure to work zones and reduce the duration of work zones? Fifty agencies (96 percent) have established criteria to support the use of project execution strategies. Two agencies crossed the implementation threshold in 2012. Several agencies noted use of lane closure strategies or nighttime construction to reduce public exposure. One agency noted that traffic volumes are generally used to establish work hours and lane closure schedules. Multiple agencies responded that strategies used to reduce public exposure to work zones are used on a case-by-case basis, generally for more significant work zones or those in urban areas. One agency noted that their use of full closure is based on detour lengths, and two agencies cited their development of a positive protection policy to reduce driver exposure to work zones.
4.1.9 Has the agency developed policies to support the use of innovative contracting strategies to reduce contract performance periods? All fifty-two agencies (100 percent) have developed policies to support the use of innovative contracting strategies to reduce contract performance periods. The average rating on this question increased 4 percent from 11.6 to 12.0 (the second largest increase of any question in this section). Strategies used include A+B bidding, alternate technical concepts, flexible start times, design-build, lane rental, value engineering (in design and also value engineering change proposals), and incentives/disincentives on major projects. Four agencies noted specifically using innovative contracting techniques to accelerate the delivery of bridge projects. An agency noted that it does not use some innovative contracting strategies such as A+B bidding and lane rental because of legislative limitations. Other agencies noted the development of new policies on A+B bidding, design-build, and public-private partnerships. Several agencies indicated they are currently evaluating the effectiveness of innovative contracting strategies.
4.1.10 Has the agency established formal agreements, such as Memoranda of Understanding (MOU), with utility suppliers to promote the proactive coordination of long-range transportation plans with long-range utility plans, with the goal of reducing project delays and minimizing the number of work zones on the highway? Only 27 agencies (52 percent) have established an MOU with utility suppliers to promote the proactive coordination of long-range transportation plans with long-range utility plans. This continues to be one of the lowest rated questions and is tied with two other questions for the lowest rating of all WZ SA questions. Despite the 2011 wording change for this question to include a broader interpretation of agreements that qualify, only one agency crossed the implementation threshold in 2012 (although the average rating did increase from 6.7 to 6.9). Two agencies responded that they hold monthly meetings with utility suppliers to discuss utility issues and project schedules. Another agency includes utility construction coordination as a section within their TMP guidebook and provides training to regional office utility coordinators on use of their lane closure decision support tool. Several agencies reported having project-specific MOUs. While many agencies do not have a formal MOU, several agencies have informal agreements and cooperative understandings in place with utility suppliers.
Project Planning and Programming
While transportation planning and implementation processes differ significantly from State to State, they all focus on developing increased capacity and efficiency in the transportation system. They do this by developing long-range transportation plans (LRTPs), transportation improvement program plans (TIPs), unified planning work programs (UPWPs), and in some cases congestion management system (CMS) plans.
Transportation management and operations (M&O) – including work zone management – is increasingly important to the planning professional. Metropolitan areas account for 83.5 percent of the Nation's population3 and 90 percent of its economic output.4 They are centers for social as well as economic activity and are the hubs of the national transportation system. To meet the challenge of continued mobility, the planning community needs to take an active role in the development and implementation of transportation system M&O strategies.
The complexity of our transportation systems and the impact of congestion on our Nation necessitate input from planners during project development in order to better assess and manage work zone impacts. The following are some example roles for planners:
- Using analytical traffic models to assess the system-wide impacts of specific project requirements;
- Evaluating programming estimates to ensure that the proper level of funding is included to mitigate traffic congestion and improve safety through work zones; and
- Providing the critical "bridge" of knowledge between the planning world and the design world to reduce the impacts of work zones on the traveling public.
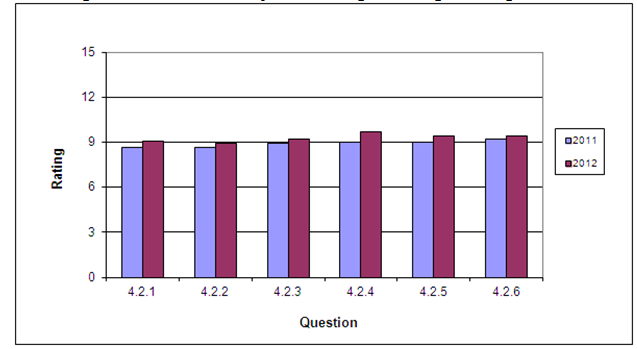
Figure 3 shows the average rating by question for 2011 and 2012 for the Project Planning and Programming section. Table 4 shows the numeric ratings along with the percent change in average rating for each question. The average ratings increased for all of the questions in this section.
Figure 3. Results for Project Planning and Programming Section
| Section | 2011 | 2012 | Change | Percent Change |
|---|---|---|---|---|
| 4.2.1 | 8.6 | 9.1 | 0.5 | 5% |
| 4.2.2 | 8.6 | 8.9 | 0.3 | 4% |
| 4.2.3 | 8.9 | 9.2 | 0.3 | 3% |
| 4.2.4 | 9.0 | 9.7 | 0.7 | 8% |
| 4.2.5 | 9.0 | 9.4 | 0.4 | 4% |
| 4.2.6 | 9.2 | 9.4 | 0.2 | 3% |
4.2.1 Does the agency's planning process actively use analytical traffic modeling programs to determine the impact of future type I and II road construction and maintenance activities on network performance? Thirty-six agencies (69 percent) actively use analytical traffic modeling programs to determine the impact of future type I and II project activities. The average rating for this question increased by 5 percent. This topic has been promoted by FHWA recently in some additional work zone products and training as part of the Traffic Analysis Toolbox, potentially helping to explain the large increase in average rating. Some agencies perform analysis at the corridor level to identify cumulative road user impacts from multiple projects and surrounding road networks, while others reported using modeling at the project level on a case-by-case basis. Agencies cited use of a fairly broad range of software applications, including QuickZone, VISSIM, TransCad, FreeVal, HCS, CO3, TSIS/CORSIM, Synchro, HCS, Paramics, and Quadro for modeling construction impacts and network performance, and Dynamic Traffic Assignment is being considered by one agency. Two agencies noted the use of in-house developed impacts analysis tools. The tools cited range from macroscopic to microscopic and have varying levels of input and output detail. Several agencies noted their use of a single in-house expert to perform work zone impacts modeling.
4.2.2 Does the agency's regular planning process analyze the network to develop adequate alternate options for routing traffic in anticipation of various needs for future road construction and maintenance? Forty agencies (77 percent) reported developing alternate network options for traffic volumes that could be delayed due to future road construction. One agency noted that in collaboration with a university, they developed a tool to visually represent traffic volumes and will begin using this tool to determine alternate network options that can be used during future lane closures. Another agency responded that these options are reviewed in conjunction with large planning studies. The same agency produces a congestion management plan that shows areas of potential impact by planned construction activities. One agency noted that alternative network options for traffic during construction are planned by consultants, and another noted that alternative network options for traffic during construction are planned informally. Two agencies noted specific projects where construction impacts were analyzed during the planning process and, as a result, capacity was added to adjacent road networks to mitigate impacts.
4.2.3 Does the agency's planning process manage the transportation improvement program to eliminate network congestion caused by poorly prioritized and uncoordinated execution of projects? Forty agencies (77 percent) indicated they make efforts during the planning process to manage the transportation improvement program to eliminate network congestion caused by poorly prioritized and uncoordinated execution of projects. One agency responded that their TMP Guidelines promote coordination between projects. Other practices mentioned for facilitating coordination include: using internal applications, implementing a public traveler information map, and participating on committees to discuss upcoming construction activities. One agency indicated that progress was being made by coordinating letting schedules to minimize network congestion, while another instituted a TIP management process that collaborates with stakeholders to find synergy among projects. An agency that is not implementing this practice noted that programming occurs too far out for coordination to be considered.
4.2.4 Does the agency's transportation planning process include a planning cost estimate review for project types I, II, and III that accounts for traffic management costs (e.g., incident management, public information campaigns, positive separation elements, uniformed law enforcement, and intelligent transportation systems [ITS])? Forty-three agencies (83 percent) have a process for estimating and reviewing traffic management costs during the transportation planning process. The average rating for this question increased by 8 percent from 2011 (the highest increase for any question in the WZ SA), with three agencies crossing the implementation threshold. One agency noted that a planning cost estimate review is detailed in their Design Guidelines. Two agencies indicated that alternatives and their corresponding traffic management costs are estimated during conceptual or planning stages and are refined as more details are known. Several agencies stated that traffic management costs for these types of strategies are not included until the design phase, as more specific information is known about each project during design. A few agencies stated that use of law enforcement personnel for work zone details is funded separately from the projects.
4.2.5 Does the agency's transportation planning process include the active involvement of planners during the project design stage to assist in the development of congestion mitigation strategies for type I and II projects? Planners assist in developing congestion mitigation strategies in 43 agencies (83 percent). Comments on this question reveal a range of involvement by planners during the project design stage. Levels of involvement include fully and actively involved, participation during quarterly meetings, participation on a case by case basis, or not at all. Several of the responding agencies noted that planners were not involved during the design stage yet acknowledged it would be beneficial. They also noted that progress is being made in formalizing the involvement of planners. One agency noted that TMP milestone information has been added to the planning process, and several agencies indicated that planners have started interacting more with work zone and traffic staff, or that traffic staff are accomplishing the same objectives as planners in this scenario. One agency cited that regional planning offices and MPOs are providing input on congestion management strategies.
4.2.6 Does the agency's transportation planning process engage planners as part of a multidisciplinary/multiagency team in the development of Transportation Management Plans involving major corridor improvements? For 42 agencies (81 percent), the transportation planning process engages planners as a part of a multidisciplinary team in the development of TMPs. Many agencies indicated that planners are included as part of the team for overall project development, including TMP development and review. One agency said that city planners are now involved in TMP development while others responded that they use internal stakeholders as well as MPO and TMA planners in the process. Two agencies responded that their TMPs are reviewed by multi-disciplinary teams consisting of planners, designers, traffic engineers, and other professionals. One agency noted that the use of multidisciplinary teams to develop TMPs is left to the discretion of the designer.
Project Design
Project designers, working in concert with other functional experts, should consider work zone maintenance of traffic issues early in the design process. Designers should examine the use of different project execution strategies that can accelerate construction, thereby reducing construction time and minimizing the exposure of travelers to work zones. In addition, designers should actively lead the preparation of Transportation Management Plans (TMPs) that will mitigate the impact of work zone activities.
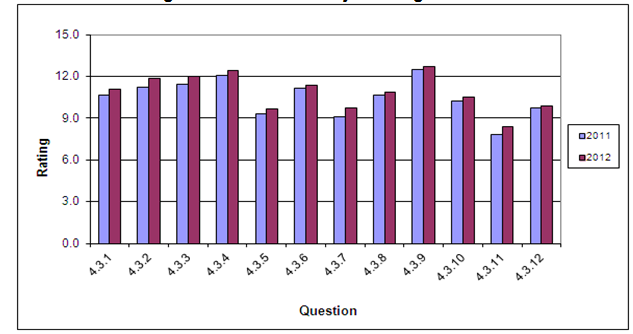
Figure 4 shows the average rating by question for 2011 and 2012 for the Project Design section. Table 5 shows the numeric ratings along with the percent change in average rating for each question. The average ratings increased for all of the questions in this section. Questions 7 and 11 had the largest increases (7 percent) in this section, and had the second highest percentage increases of all questions in the WZ SA. Question 11 had the lowest average rating for the section in both 2011 and 2012, allowing more room for a large percentage increase. All the questions are at or above the implementation stage (rating of 7 or higher), meaning that agencies are typically implementing the practices addressed in this section. Many agencies are now in the assessment phase (rating of 10-12).
Figure 4. Results for Project Design Section
| Section | 2011 | 2012 | Change | Percent Change |
|---|---|---|---|---|
| 4.3.1 | 10.7 | 11.1 | 0.4 | 4% |
| 4.3.2 | 11.2 | 11.8 | 0.6 | 6% |
| 4.3.3 | 11.4 | 12.0 | 0.5 | 5% |
| 4.3.4 | 12.1 | 12.4 | 0.3 | 3% |
| 4.3.5 | 9.3 | 9.7 | 0.3 | 4% |
| 4.3.6 | 11.2 | 11.3 | 0.2 | 2% |
| 4.3.7 | 9.1 | 9.7 | 0.6 | 7% |
| 4.3.8 | 10.7 | 10.9 | 0.2 | 2% |
| 4.3.9 | 12.5 | 12.7 | 0.2 | 2% |
| 4.3.10 | 10.2 | 10.5 | 0.3 | 3% |
| 4.3.11 | 7.8 | 8.4 | 0.5 | 7% |
| 4.3.12 | 7.9 | 9.9 | 0.1 | 1% |
4.3.1 Does the agency have a process to estimate road user costs and use them to evaluate and select project strategies (full closure, night work, traffic management alternatives, detours, etc.) for type I and II projects? Forty-seven agencies (90 percent) have a process to estimate road user costs. Multiple agencies noted the use of tools to estimate road user costs and one agency is currently updating their tool. Other agencies noted that while they do not specifically use road user costs to evaluate and select strategies, they use a lane closure chart or strategy to minimize work zone exposure and delay, ultimately resulting in reduced road user costs. One agency indicated that they are developing a benefit-cost guideline for work zone mitigation strategies. A few of the agencies noted that this type of evaluation is conducted on an as-needed basis, generally on select significant or mega projects. Two agencies stated that road user costs are not used to determine construction strategies. User costs for another stakeholder group - the boating community – were estimated by one agency for a significant bridge project that had anticipated impacts to the waterway.
4.3.2 Does the agency develop a Transportation Management Plan that addresses all operational impacts focused on project congestion for type I and II projects? All fifty-two agencies (100 percent) develop a TMP that addresses all operational impacts with a focus on project congestion for type I and II projects. This question also had a notably high percentage increase (6 percent) given that it also had a large rating increase from an already high average rating in 2011 (11.2). Two agencies commented that while TMP development occurs, evaluation and monitoring efforts could be improved. One agency indicated that TMP development occurs for all projects, regardless of size or significance. Another agency noted that they have added an event date in their project scheduling system to ensure that the TMP is reviewed in advance of the project. One agency stated that TMP development has been useful with estimating costs and developing a sequence of operations.
4.3.3 Does the agency use multidisciplinary teams consisting of agency staff to develop Transportation Management Plans for type I & II projects? All 52 agencies reported that they use multidisciplinary teams (the same as 2011). Agencies responded that these multidisciplinary teams consist of agency staff from many areas such as design, planning, right of way, environmental, structures, maintenance, traffic operations, and construction. Additionally, some agencies reported that they include other stakeholders such as local agencies (MPOs or TMAs), emergency response teams, law enforcement, citizens, and elected officials. Some agencies cited a specific policy requiring these teams, and some noted that the scope of the team is dependent on the type and size of the construction project.
4.3.4 Does the agency perform constructability reviews that include project strategies to reduce congestion and traveler delays during construction and maintenance for type I and II projects? All 52 agencies responded that they use constructability reviews on projects. Several agencies noted that reviews take place between the design and construction phases for projects, and sometimes involve the selected contractor. One agency noted that they host biannual TMP Constructability workshops where they share case studies and best practices with multi-disciplinary stakeholders. Another agency said that constructability reviews are required on all projects and are performed in conjunction with the development of the project's TMP. While most agencies indicated that constructability reviews are performed in-house, one agency noted that consultants are used for constructability reviews on large projects. One agency indicated a need for consistency throughout the State on how and when constructability reviews are performed.
4.3.5 Does the agency use independent contractors or contractor associations to provide construction process input to expedite project contract times for type I and II projects? Forty-five agencies (87 percent) use contractor associations to provide construction process input. Many agencies noted that independent contractors or contractor associations are used to provide input on a case by case basis and the process is more often used on larger projects. A few agencies responded that this process is carefully used due to a potential conflict of interest in a low bid environment. Two agencies indicated that contractors are used in this capacity through either design-build efforts or using existing data from AASHTO's Site Manager Software, while another responded that contractors are used for the development and review of specifications. One agency noted that they believe contractors may not participate fully in the process because they would want to benefit fully from their ideas should they be awarded the contract at a later time.
4.3.6 Does the agency use scheduling techniques that are based on time and performance, such as the critical path method or parametric models, to determine contract performance times for type I and II projects? Forty-seven agencies (90 percent) are using a technique to determine contract performance times for type I and II projects. Several agencies noted use of either Gantt charts or the Critical Path Method (CPM), especially for type I and II projects. Several agencies noted that production rates are used to calculate contract periods. Some agencies noted the use of software such as Primavera or agency-developed spreadsheet tools to assist with scheduling. One agency stated that the sophistication and complexity of their model is dependent on the size and monetary value of the contract. No agencies referenced the use of parametric models specifically.
4.3.7 Does the agency have a process to evaluate the appropriate use of ITS technologies to minimize congestion in and around work zones for type I, II, and III projects? Forty-five agencies (87 percent) have a process to consider ITS technologies to minimize work zone congestion. The average rating for this question increased 7 percent from 2011 to 2012, giving it one of the highest percentage increases of all questions in the WZ SA. Several agencies noted use of ITS, especially on significant projects, in metropolitan areas and on interstates. The range of agency use varies greatly – from regular use to an evolving process to being under consideration. Agencies noted the use of speed trailers, variable message signs, and portable sensors. Several agencies noted that ITS technologies are included in TMP guidelines, checklists, and policies.
4.3.8 Does the agency use life-cycle costing when selecting materials to reduce the frequency and duration of work zones for type I, II, and III projects? Life-cycle costing (LCC) is used by 48 agencies (92 percent) to reduce the frequency and duration of work zones. Several agencies responded that they use life cycle costing on pavement and bridge materials, pavement markings, sign sheeting, concrete barrier, and guardrail selection, often citing that longer lasting material results in fewer future disruptions to traffic for maintenance. One agency cited their use of RealCost software to perform life cycle cost analyses for pavement designs. Another agency noted that they have a formal process for selecting pavement materials on projects exceeding $1 million. Two agencies cited the development of alternate pavement specifications. A few agencies noted that life cycle costing is performed on a case-by-case basis while one agency noted that it is integrated into the project design process.
4.3.9 Does the agency have a process to assess projects for the use of positive separation devices for type I and II projects? Fifty-one agencies (98 percent) have a process to assess projects for the use of positive separation (now referred to as positive protection) devices for type I and II projects. One agency increased their rating above the implementation threshold from 2011. Practices range from having multiple policies and guidelines encouraging the use of positive separation devices to an informal process to assess the need for positive separation devices. For example, one agency noted that although no written policy exists, the agency's position is to always consider the use of positive barrier systems on Interstates and during major construction projects on high-speed facilities. One agency responded that a study is underway to define criteria for use of positive protection and results will be used to assess current practice. Some agencies have tools developed to aid in selection of devices, and FHWA is currently developing a training course on decision-making for positive protection.
4.3.10 Does the agency anticipate and design projects to mitigate future congestion impacts of repair and maintenance for type I, II, and III projects? Fifty agencies (96 percent) incorporate features into their project designs that anticipate the need for future repair and/or maintenance activities. Ratings for one agency crossed the implementation threshold from 2011 to 2012. Several agencies reported that wider shoulders or additional lanes are considered in the design process for use in enhancing capacity and reducing delay during future rehabilitation projects. They also noted that full depth shoulders are routinely considered for future traffic management during maintenance and repair. Another agency noted that it installs longer lasting pavement markings, while two agencies cited their modifications to bridge approach end designs to reduce future maintenance needs.
4.3.11 When developing the Traffic Control Plan for a project, does the agency involve contractors on type I and II projects? Contractors are involved with the development of traffic control plans (TCPs) in 34 agencies (65 percent). This represents one additional agency implementing this practice in 2012 compared with 2011. This question received the lowest rating in the Project Design section, but has the largest percentage increase (7 percent) from 2011 for this section. The average rating for this question increased from 7.8 to 8.4. Many agencies noted that contractors are allowed to submit proposed revisions to the TCP following the award of the contract to prevent any conflicts of interest that might arise if this were to be done prior to bidding. Some agencies noted that contractors did provide input on a project-by-project basis, specifically if the project was complex or unique, and cited use of contractor input through design-build contracts. One agency noted that contractors provide input on value engineering team reviews for projects exceeding $25 million, and another responded that contractors are permitted to submit a value engineering change proposal during construction to reduce the cost of a project. Several agencies cited regular meetings held with State or national contracting organizations where traffic controls strategies are discussed.
4.3.12 When developing the Traffic Control Plan for a project, does the agency use computer modeling to assess Traffic Control Plan impacts on traffic flow characteristics such as speed, delay, and capacity for type I and II projects? Forty-six agencies (88 percent) implement computer modeling in the development of traffic control plans. Agencies reported using software such as QuickZone, TSIS/CORSIM, Synchro/SimTraffic, VISSIM, TREX, COSMIX, Quadro, Paramics, CA4PRS, HCM, and CO3 for analyzing impacts. Additionally, two agencies noted that they have developed a spreadsheet to assist in analyzing impacts. One agency noted that they still use a demand versus capacity analysis to determine allowable hours for lane closures and restrictions, but they have used modeling and will continue to develop modeling expertise. Two agencies noted that modeling is used after an initial review indicates that a more detailed analysis would be beneficial. One agency noted they have provided training sessions for the use of modeling software and have recently employed a work zone modeling expert.
Project Construction and Operation
A roadway construction or maintenance site can be a very complex orchestration of activities that affect the public in many ways. There are many pieces to the project delivery process and everyone has a critical role, but what the public mostly sees and experiences is the construction phase of the process. The use of letting strategies, quality-based contractor selection, time-sensitive bidding, efficient operations, traffic management, aggressive contract management, and good public information can help agencies improve the execution and public perception of transportation improvements.
Complaints from the traveling public often focus on the proper use and maintenance of traffic control devices, work zone lane closures when no work is occurring, and inadequate traveler information. Some common problems include signs that inform travelers of conditions that do not exist, striping that is misleading, changeable signs that show inaccurate messages, cones/drums that are improperly spaced, and lack of advance notice about lane closures, detours, or expected delays. These issues have an impact on agency credibility with the traveling public. Drivers develop work zone habits that are based on past observations. Agencies can require and provide incentives for work zone contractor personnel to be trained in the proper application and maintenance of traffic control devices in work zones and the implementation of other TMP strategies.
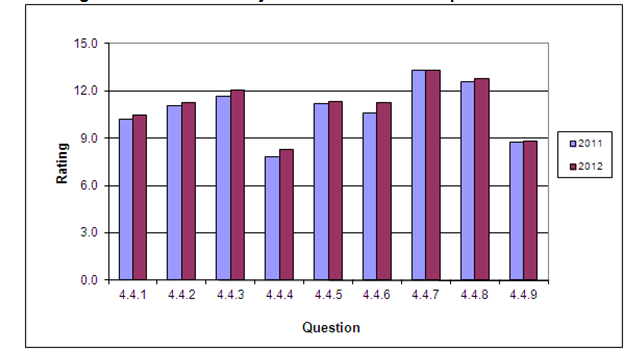
Figure 5 shows the average rating by question for 2011 and 2012 for the Project Construction and Operation section. Table 6 shows the numeric ratings along with the percent change in average rating for each question. Overall, this section had the second highest average rating (11.1) of the six sections. The average rating increased slightly for most of the questions in this section, with two questions showing larger increases of 6 percent. All the questions are at or beyond the implementation stage (rating of 7 or higher), meaning agencies are generally implementing the practices addressed in this section.
Figure 5. Results for Project Construction and Operation Section
| Section | 2011 | 2012 | Change | Percent Change |
|---|---|---|---|---|
| 4.4.1 | 10.2 | 10.5 | 0.3 | 3% |
| 4.4.2 | 11.0 | 11.3 | 0.2 | 2% |
| 4.4.3 | 11.6 | 12.1 | 0.4 | 4% |
| 4.4.4 | 7.9 | 8.3 | 0.4 | 6% |
| 4.4.5 | 11.2 | 11.3 | 0.1 | 1% |
| 4.4.6 | 10.6 | 11.3 | 0.7 | 6% |
| 4.4.7 | 13.3 | 13.3 | 0.0 | 0% |
| 4.4.8 | 12.6 | 12.8 | 0.2 | 1% |
| 4.4.9 | 8.8 | 8.8 | 0.1 | 1% |
4.4.1 Is the letting schedule altered or optimized to reflect the available resources and capabilities of the construction industry? Forty-four agencies (85 percent) alter or optimize their letting schedule based on contractor resources and capabilities. Several agencies noted that they spread out project advertisements so that a larger number of contractors have a chance to bid on jobs. One agency lets projects early in the year and provides a flexible notice to proceed to contractors. One agency noted that it uses a quarterly distribution of funds (20-30-30-20) to spread out its budget to match construction industry contractor resources. One agency said it is developing a master schedule which would allow schedule optimization. One agency noted that its letting schedule is often driven by fiscal process constraints. Another agency said that it does review the letting schedule based on available construction industry resources, but that a more significant factor in its letting schedule is the time needed to complete the job, as the agency tries to minimize the number of projects carried over winter. Several agencies cited the need to consider contractor resources due to American Recovery and Reinvestment Act funding and large scale bridge replacement projects.
4.4.2 Is the letting schedule altered or optimized to minimize disruptions to major traffic corridors? Fifty-one agencies (98 percent) are minimizing disruptions on major traffic corridors by optimizing the letting schedule. Projects are often reviewed to make sure that multiple projects do not adversely impact traffic along certain corridors. One agency noted that schedules are frequently optimized for major corridors. One agency noted flexibility in the start time if the same contractor is awarded two projects in close proximity to one another. The same agency said it may not issue a notice to proceed until the next season if a similar situation exists but involves two different contractors. One agency noted that its letting process has been adjusted in anticipation of traffic issues, and in some instances where the letting schedule cannot be adjusted, the construction schedule is modified. Another agency cited its intent is to optimize the letting schedule, but funding can be an obstacle preventing such optimization.
4.4.3 When bidding type I and II projects, does the agency include road user costs in establishing incentives or disincentives (e.g., I/D, A+B, or lane rental) to minimize road user delay caused by work zones? Fifty agencies (96 percent) include road user costs in establishing incentives/disincentives (I/D) to minimize road user delay in work zones. The overall rating for this question increased 4 percent (from 11.6 to 12.1). The rating for two agencies increased above the implementation threshold. Some examples of strategies used by agencies include A+B bidding, lane rental, accelerated work, construction manager at risk, and liquidated damages clauses. Agencies generally did not specify how road user costs are determined. Several agencies noted that they have been using A+B bidding and lane rental for some time. One agency responded that disincentives are more commonly used than incentives. Another agency cited guidance development for innovative contracting strategies.
4.4.4 When bidding type I, II, and III projects, does the agency use performance-based criteria to eliminate contractors who consistently demonstrate their inability to complete a quality job within the contract time? Thirty-four agencies (65 percent) use performance-based selection to eliminate contractors that regularly have difficulty completing quality jobs on-time. The average rating on this question increased 6 percent from 7.8 to 8.3, and experienced one of the highest percentage increases in this section and overall in the WZ SA. This increase may have been due in part to a continuing trend from a change in the wording of the question in 2011 to indicate it pertains to performance-based criteria, such as that used in prequalification, rather than performance-based selection. Many agencies noted the use of a prequalification process to analyze the eligibility of contractors that have demonstrated poor performance to bid on projects. Two agencies noted that they have established contractor evaluation criteria and are beginning to collect data, while another noted that they evaluate the contractor at the end of each contract, but these evaluations do not disqualify the contractor from the bidding process regardless of performance. Two agencies cited their inability to disqualify contractors due to State law.
4.4.5 When bidding type I and II project contracts, does the agency use incident management services (e.g., wreckers, push vehicles, and service patrols)? Incident management (IM) services are used by 46 agencies (88 percent). Several IM services are employed, including enforcement located within the work zone, courtesy patrols, highway advisory radio, push-bumpers and wreckers, and coordination with fire and rescue organizations. Two agencies indicated that either data is collected or post incident reviews take place to ensure effectiveness of the services. One agency noted that they found it was not cost effective to keep IM services on site, but they do keep such services on stand-by if needed. One agency responded that specific guidance for IM services is being developed, while another agency responded that they do not have a need for these types of services.
4.4.6 When bidding contracts, does the agency use flexible starting provisions after the Notice to Proceed is issued? Forty-eight agencies (92 percent) routinely use flexible starting provisions after the Notice to Proceed (NTP) is issued. This question was one of two that had the largest increase (6 percent) for this section (from 10.6 to 11.3). This large increase is especially notable given the high numerical value for the average rating which makes large percentage changes more difficult. Agency use of flexible starting provisions ranges from being a standardized practice to being used occasionally to not being used at all. One agency said this activity is generally done indirectly and due to weather. Another agency noted that all projects have some flexibility between award and NTP. The same agency said that the NTP is normally within 45 days of award; however, the NTP may be extended to after winter if a winter shutdown date occurs during or immediately after the 45 day window. This agency also noted that it may include a two-part NTP in a contract to allow procurement of materials prior to actual construction. One agency routinely uses flexible starting provisions and uses past results to determine future projects that are good candidates for this practice. Another agency noted that they do not use flexible starting provisions because their project schedule is based on the end date and not project duration/start date.
4.4.7 During type I, II, and III projects, does the agency use uniformed law enforcement? Fifty-one agencies (98 percent) use uniformed law enforcement on projects. While this question experienced no change in average rating, it had the second highest average rating of any question in the WZ SA, indicating that the use of law enforcement in work zones is a well-established and assessed practice in many agencies. Some agencies use law enforcement personnel on a project-by-project basis, but most agencies noted that the use of law enforcement is well-integrated into the agency project development process. A few agencies noted that they are evaluating the use of law enforcement in work zones to ensure effective use. One agency uses law enforcement strictly for traffic control on most projects, but is currently pursuing an initiative to perform speed enforcement and is gathering data on speeds and the common types of driver infractions. Two agencies indicated that specific funds are dedicated for law enforcement operations in work zones. Two agencies cited use of enforcement on night projects, with one citing use in locations were the posted speed is over 45 mph and the other noting use on high speed, multilane facilities or locations with high traffic volumes.
4.4.8 Does the agency provide/require training of contractor staff on the proper layout and use of traffic control devices? Forty-nine agencies (94 percent) indicated that they provide and/or require training of contractor staff on proper use of traffic control devices. Some agencies hold training courses on traffic control that they make open to contractor staff, while many of the respondents cited that contractor personnel are required to complete training specific to their role from an approved set of courses such as those offered by the American Traffic Safety Services Association (ATSSA), the International Municipal Signal Association (IMSA), or the National Safety Council (NSC). One agency also reported that designers of traffic control are required to have Professional Traffic Operations Engineer certification. Another agency noted that classroom training is offered, but not required, and that flaggers are required to read a handbook and watch a video. One agency reported having trained over 28,000 designers, project construction and inspection personnel, District and Regional Traffic Engineering and District Residency maintenance personnel, and municipality staff in varying advancements of course work over 5 years. Another agency reported to have Temporary Traffic Control for Work Zones (MUTCD Part 6) training available online.
4.4.9 Does the agency provide training to uniformed law enforcement personnel on work zone devices and layouts or ensure law enforcement personnel receive proper training elsewhere? Thirty-six (69 percent) of the responding agencies provide training to uniformed law enforcement or otherwise require it. Two agencies responded that they are currently using FHWA's "Safe and Effective Use of Law Enforcement Personnel in Work Zones," while others mentioned the use of FHWA training material and train-the-trainer options. A few agencies have used the FHWA material to develop their own online course for law enforcement. Two agencies noted that they are currently developing law enforcement training materials that will be available online. FHWA's online course became available in October 2012. Another agency conducts incident responder workshops in 6 of its 7 regions and is hoping to expand the geographic presentation of these workshops in the future. Two agencies noted that limited funding and availability of law enforcement officers make it difficult to ensure all staff members receive work zone training. One agency requires project staff to meet with the State Police to review specific work zone practices at the end of a shift.
Communications and Education
To reduce public anxiety and frustration regarding work zones, it is important to sustain effective communication and outreach with the public about road construction and maintenance activity, and the potential impacts of the activities. This also increases the public's awareness of such activity. Lack of information is often cited as a key cause of frustration for the traveling public; therefore, the agency should identify and consider key issues from a public outreach and information perspective.
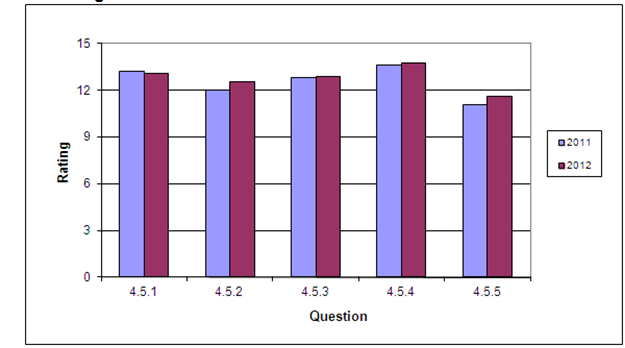
Figure 6 shows the average rating by question for 2011 and 2012 for the Communications and Education section. Table 7 shows the numeric ratings along with the percent change in average rating for each question. The average ratings increased for three out of the five questions in this section, while the question on maintaining and updating a Web site (4.5.1) experienced a slight decrease. The ratings in this section have consistently been among the highest in the WZ SA and remain so this year. Many agencies are now in the assessment phase (ratings of 10-12).
Figure 6. Results for Communications and Education Section
| Section | 2011 | 2012 | Change | Percent Change |
|---|---|---|---|---|
| 4.5.1 | 13.2 | 13.1 | -0.1 | -1% |
| 4.5.2 | 12.0 | 12.6 | 0.5 | 4% |
| 4.5.3 | 12.8 | 12.9 | 0.0 | 0% |
| 4.5.4 | 13.6 | 13.8 | 0.1 | 1% |
| 4.5.5 | 11.1 | 11.6 | 0.5 | 5% |
4.5.1 Does the agency maintain and update a work zone Web site providing timely and relevant traveler impact information for type I, II, and III projects to allow travelers to make effective travel plans? Fifty agencies (96 percent) implement a Web site to provide traveler impact information on projects to allow travelers to make effective travel plans. The average rating for this question decreased by 1 percent (from 13.2 to 13.1). One agency's rating decreased below the implementation threshold. Online information is becoming more sophisticated to include real-time delay updates, maps, and interactive features such as location-specific lane closure information. Many agencies have a Web site that provides information on various types of congestion, and supplement that with project specific Web sites for large projects. Agencies noted that one of the challenges with providing project specific information is the frequency in which they are able to update the information. One agency noted that they are exploring the potential for using social media sites (e.g., Facebook, Twitter) to provide updates to the traveling public.
4.5.2 Does the agency sponsor National Work Zone Awareness week? Forty-nine agencies (94 percent) sponsor National Work Zone Awareness week. After a decrease in average rating from 2010 to 2011, this question experienced a 4 percent increase in average rating from 2011 to 2012. Some agencies have no formal campaign but have activities that draw attention to work zone safety such as worker memorials, specific reviews of practices and procedures for construction and maintenance activities, and measures that will help drivers navigate the work zone (e.g. additional signing and technology for warning drivers). Three agencies noted a dedicated committee that organizes activities and sponsors events designed to raise awareness.
4.5.3 Does the agency assume a proactive role in work zone educational efforts? Fifty agencies (96 percent) are developing educational materials to inform the public on work zone safety. Most agencies that provided comments cited the use of educational efforts such as public service announcements, press releases, and brochures. One agency noted conducting work zone educational efforts targeted to drivers such as through a newly created section in the Department of Motor Vehicles Driver Education Manual. Two agencies noted partnerships with ATSSA for work zone educational efforts, while one agency noted teaming with their Department of Education to prepare a presentation for use in high school driver education courses in public high schools.
4.5.4 During type I, II, and III project construction, does the agency use a public information plan that provides specific and timely project information to the traveling public through a variety of outreach techniques (e.g., agency Web site, newsletters, public meetings, radio, and other media outlets)? This practice is implemented by all 52 agencies. As in 2011, this question has the highest rating of all questions in the WZ SA, with many agencies noting that it is a normal part of project delivery. The most frequently mentioned public information techniques used by agencies include publishing information on the agency's Web site and providing information to media outlets. Other techniques mentioned by agencies include highway advisory radio messages, press releases, public service announcements, radio, TV, newspaper ads, telephone hotlines, ITS (e.g., camera images on websites), 511, RSS feeds, newsletters, and outreach to businesses. One agency noted that a project public information campaign reduced traffic during a closure by more than 50%.
4.5.5 During type I, II, and III projects, does the agency use ITS technologies to collect and disseminate information to motorists and agency personnel on work zone conditions? Forty-nine agencies (94 percent) use ITS technologies to collect and disseminate work zone information. The average rating for this question increased by 5 percent (from 11.1 to 11.6) due to increases in ratings by 19 agencies. Several agencies provide real-time speed and delay information to motorists using ITS technology. Specific system applications cited by agencies include dynamic lane merge, 511, permanent message signs, and portable changeable message signs. One agency noted that ITS has not traditionally been included as a bid item in project documents, but is proposed as part of value engineering change proposals by contractors. The same agency is developing a specification for use of Automated Work Zone Information Systems on projects.
Program Evaluation
Evaluation is necessary to identify successes and analyze failures. Performance monitoring and reporting at a nationwide level can increase the knowledge base on work zones and lead to the development of tools to help agencies better plan, design, and implement road construction/maintenance projects. At the local level, performance monitoring and reporting provide an agency with valuable information on contractor performance, the effectiveness of congestion mitigation strategies, and safety.
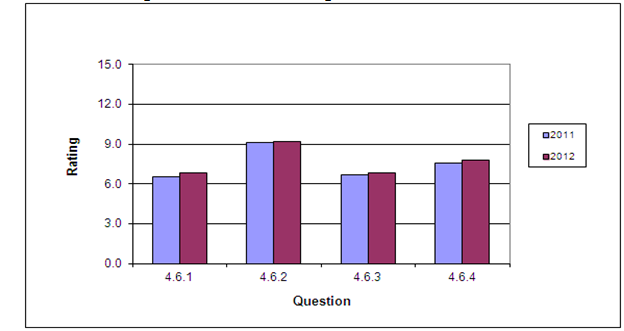
Figure 7 shows the average rating by question for 2011 and 2012 for the Program Evaluation section. Table 8 shows the numeric ratings along with the percent change in average rating for each question. The average ratings increased for all of the questions in this section. This section remains the lowest rated in the WZ SA.
Figure 7. Results for Program Evaluation Section
| Section | 2011 | 2012 | Change | Percent Change |
|---|---|---|---|---|
| 4.6.1 | 6.6 | 6.9 | 0.3 | 4% |
| 4.6.2 | 9.2 | 9.2 | 0.1 | 1% |
| 4.6.3 | 6.7 | 6.9 | 0.2 | 3% |
| 4.6.4 | 7.6 | 7.8 | 0.2 | 3% |
4.6.1 Does the agency collect data to track work zone congestion and delay performance in accordance with agency-established measures? (See section 4.1.4.) Slightly more than half (28) of the responding agencies collect data to track work zone congestion and delay performance against agency measures. The average rating for this question increased by 4 percent to just below the implementation threshold where agencies, on average, would be using data to track work zone congestion and delay. This increase was due to increases in average ratings by 14 agencies. One agency noted that while they collect data, there are no established measures. Another agency noted the use of a Performance Measurement System to monitor the status of all lane closures on a daily basis, but did not identify the particular dissemination techniques used. Another agency has an ongoing research project to better understand work zone driving patterns and driver behavior, which may lead to future activity in performance measurement. One agency noted that they measure field conditions and compare conditions with an established 30 minute delay threshold. Another agency noted that they have purchased software to manage data from work zones with ITS devices and track total delay in hours. The same agency noted the potential for future travel time and speed data to develop a statewide congestion map.
4.6.2 Does the agency collect data to track work zone safety performance in accordance with agency-established measures? (See section 4.1.5.) Thirty-seven agencies (71 percent) are collecting data to track work zone safety performance. One agency reduced its rating on this question to below the implementation threshold. One agency noted nearing completion of a database that will assist with tracking and studying work zone crashes. Based on responses from several agencies, an issue continues to be identifying whether the crash or fatality was directly related to the work zone (i.e., would it have happened without the work zone in place). One agency noted that a challenge exists with providing resources for data collection and monitoring. Another agency noted that they use annual data on crashes, injuries, and fatalities to update work zone safety policies and SHSP strategies.
4.6.3 Does the agency conduct customer surveys to evaluate work zone traffic management practices and policies on a statewide/area-wide basis? Twenty-seven agencies (50 percent) are using customer surveys to evaluate work zone performance, representing an increase of one agency. Customer surveys provide qualitative information for agencies to use in evaluating their work zone operations. Agencies that mentioned doing surveys indicated they were often specific to a project or an outreach campaign, or were part of a larger State or agency survey effort. Several agencies noted use of electronic resources such as Web sites to gather public input on programs and projects. One agency noted that it uses an email address to receive feedback from the public and users can submit feedback as part of an online form, while another agency noted they had a dedicated phone line. Other examples of feedback techniques include public forums - both formal public meetings and informal "coffee shop" meetings. Agencies did not specifically comment on the process for evaluating the feedback received and how it impacts policy and decisions.
4.6.4 Does the agency develop strategies to improve work zone performance on the basis of work zone performance data and customer surveys? Thirty agencies (58 percent) develop strategies to improve work zone performance based on work zone data and customer surveys. This represents a decrease of one agency implementing this practice compared with 2011. One agency noted updates to lane closure policies based on data and survey information to provide a proactive process. Another agency cited use of project specific efforts such as portable technology for speed monitoring to capture queue and delay information and develop criteria to define the limits of work zones and queues. One agency is considering development of a survey tool to gather data at rest areas. Another agency cited use of a congestion/safety team that mobilizes and visits a site, as needed, to evaluate issues and make recommendations to staff on how to alleviate them. One agency noted that project delays are monitored to ensure they do not exceed the thresholds established in the TMP.
3 U.S. Census Bureau, Current Population Reports, "Population Change in Metropolitan and Micropolitan Statistical Areas: 1990-2003," P25-1134, by Paul J. Mackun, (Washington, DC: September 2005) [ Return to note 3. ]
4 U.S. Bureau of Economic Analysis, "Metropolitan Economic Growth Widespread in 2006 - 2006 and Revised 2004-2005 GDP-by-Metropolitan-Area Statistics," News Release BEA 08-44, Regional Economic Accounts web page, December 13, 2012. (http://www.bea.gov/newsreleases/regional/gdp_metro/2008/gdp_metro0908.htm) [ Return to note 4. ]