2. Overview of Results
This section presents an overview of the combined results for the 52 Divisions/States that provided responses to the 2011 WZ SA. Results from the 2010 WZ SA are also included for comparison. Table 1 shows the 2011 overall average rating and average ratings for each of the six sections in the WZ SA in comparison to the 2010 results.
| Section | # of Questions | 2010 | 2011 | Change1 | Percent Change |
|---|---|---|---|---|---|
| 1. Leadership and Policy | 10 | 9.9 | 10.0 | 0.2 | 2% |
| 2. Project Planning and Programming | 6 | 8.7 | 8.9 | 0.2 | 2% |
| 3. Project Design | 12 | 10.2 | 10.5 | 0.3 | 3% |
| 4. Project Construction and Operation | 9 | 10.5 | 10.8 | 0.3 | 3% |
| 5. Communications and Education | 5 | 12.3 | 12.6 | 0.2 | 2% |
| 6. Program Evaluation | 4 | 7.2 | 7.5 | 0.3 | 4% |
| Overall | 46 | 10.0 | 10.3 | 0.3 | 3% |
Noteworthy Findings by Section
The highest average ratings were for Section 5 (Communications and Education), followed by Section 4 (Project Construction and Operation) and Section 3 (Project Design). The lowest average rating was assigned to Section 6 (Program Evaluation). This is consistent with the results from previous years.
Each section experienced a slight increase in average rating from 2010 to 2011. Section 6 (Program Evaluation) had the highest average rating increase (4 percent). While the overall three percent rating increase is consistent with increases of the past few years, this year the increase is more evenly spread across all the sections.2
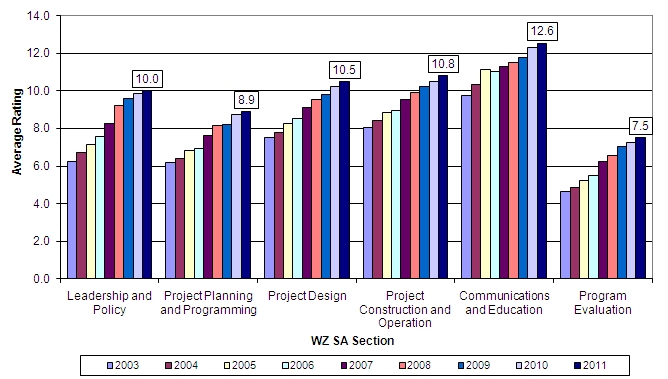
The National average ratings for all six sections have consistently increased since the inception of the WZ SA, with the level of increase varying from section to section as shown in Figure 1. Since 2009, the average rating for every section has been at or above the implementation threshold of seven – meaning that on average across the country, agencies are implementing the practices in all six sections of the assessment. In 2011, the Leadership and Policy ratings show that, on average, agencies have advanced from the implementation stage (rating of 7 to 9) to assessing their performance (rating of 10-12).3 As a result, four of the six sections now have average ratings that show agencies are assessing their performance. As agencies have continued to enhance their work zone policies and practices, the average ratings have reached a level to where increases are more gradual.
Figure 1. National Average Section Ratings by Year: 2003 to 2011
Noteworthy Findings by Question
The following question was the highest rated question on the WZ SA in 2011, with an average rating of 13.6:
- 4.5.4 During type I, II, and III project construction,
does the agency use a public information plan that provides
specific and timely project information to the traveling public
through a variety of outreach techniques (e.g., agency Web
site, newsletters, public meetings, radio, and other media
outlets)?
- This question has consistently had one of the highest overall ratings of any question in the WZ SA.
- The average rating indicates that the use of public information plans with specific and timely project information is a well-established and assessed practice in many agencies.
- All 52 agencies use public information plans that provide specific and time project information to the traveling public.
The questions showing the largest increases in rating between 2010 and 2011 are:
- 4.3.5 Does the agency use independent contractors
or contractor associations to provide construction process input
to expedite project contract time for type I and II projects?
(8 percent rating increase)
- The 8 percent rating increase (from 8.6 to 9.3) was due to increases in ratings by 15 agencies.
- The ratings for 2 agencies increased above 7, meaning they are now implementing this practice.
- Overall, 44 agencies (85 percent) are using independent contractors or contractor associations to provide construction process input to expedite project contract times for type I and II projects.
- 4.4.9 Does the agency provide training to uniformed
law enforcement personnel on work zone devices and layouts or
ensure law enforcement personnel receive proper training elsewhere?
(6 percent increase)
- The 6 percent increase in average rating (from 8.3 to 8.8) was due to increases in ratings by 18 agencies.
- The ratings for 2 agencies increased above 7, meaning they are now implementing this practice.
- Overall, 38 agencies (73 percent) provide training to uniformed law enforcement personnel on work zone devices and layouts or ensure law enforcement personnel receive proper training elsewhere.
The lowest rated question on the 2011 WZ SA, with an average rating of 6.6, is:
- 4.6.1 Does the agency collect data to track work
zone congestion and delay performance in accordance with agency-established
measures?
- The question has consistently been at or near the lowest rated of all questions.
- Half (26) of all agencies indicate they are implementing this practice, which is the lowest implementation rate for practices in the WZ SA. This 50% implementation rate is shared by two other practices (4.1.10 - use of formal agreements with utility suppliers to proactively coordinate projects, and 4.6.3 - use of customer surveys to evaluate traffic management).
- Both knowledge and resources have constrained implementation of work zone congestion and delay data collection. During 2011, FHWA published a primer and a research report and held a webinar on work zone performance monitoring to help advance knowledge on establishing measures and collecting data to assess the measures. An additional follow-on effort is underway.
Two questions in the 2011 WZ SA showed minor decreases from the 2010 results:
- 4.5.2 Does the agency sponsor National Work Zone
Awareness week?
- This question showed a 2 percent decrease from 12.3 in 2010 to 12.0 in 2011 as a result of decreased ratings in 11 agencies.
- The number of agencies implementing this practice remained constant at 46 agencies (88 percent).
- 4.1.5 Has the agency established measures (e.g.,
crash rates) to track work zone crashes?
- This question showed a 1 percent decrease from 10.6 in 2010 to 10.5 in 2011 as a result of decreased ratings in 5 agencies.
- The number of agencies implementing this practice remained the same from 2010 at 43 agencies (83 percent).
The changes in ratings for any WZ SA question may be due to a combination of reasons. Factors that may contribute to changes in rating include enhancements to State practices (perhaps as a result of findings from a previous WZ SA, enhanced processes for stakeholder input while filling out the WZ SA, greater attention to agency process change relative to the topic areas in the WZ SA, and changes in personnel filling out the WZ SA, as well as FHWA's support to agencies in technical areas, further implementation of the Work Zone Rule or other recommended practices, or re-baselining of practices. Question-specific factors for rating changes are provided later in the question-by-question write-ups in Section 4.
Noteworthy Findings by Agency
Most agencies increased their overall WZ SA rating between 2010 and 2011. The average rating increased for 38agencies (73 percent), decreased for 10 agencies (19 percent), and remained the same for 4 agencies (8 percent). Table 2 shows the changes in average agency ratings from 2010 to 2011. These percentages are similar to those for the 2009 to 2010 period.
| Score Change | Agencies | Percent of Agencies |
|---|---|---|
| Increased by more than 10% | 5 | 10% |
| Increased 6% to 10% | 8 | 15% |
| Increased 1% to 5% | 25 | 48% |
| No Change | 4 | 8% |
| Decreased by less than 5% | 8 | 15% |
| Decreased by 5% or more | 2 | 4% |
| Total | 52 | 100% |
Nearly half of agencies had a small percentage increase in weighted score in 2011, meaning their overall score was fairly constant. Many agencies also had fairly stable scores on individual questions, with 32 agencies having no question increase by more than 3 points and 42 agencies having at most one question increase by more than 3 points. While score changes on individual questions were typically small, on average an agency had these small increases on 11 questions. For scoring decreases, 39 agencies had no question decrease by more than 3 points and 42 agencies had at most one question decrease by more than 3 points.
The largest percentage increase in average weighted score for an agency was 16 percent, while the largest percentage decrease in average weighted score was 11 percent. These agencies had respective increases/decreases across a large number of questions, with large changes in ratings on some questions. One agency increased its score by more than 3 points on 10 questions, and a different agency decreased its score by more than 3 points on 10 questions.
Observations of the practices associated with the scores are included in the question-by-question write-ups in Section 4.
Responses to the supplemental question show that the majority of agencies have conducted a comprehensive work zone process review in the last two years in accordance with 23 CFR 630 Subpart J, with many completed in 2010.
1 Numbers in this table and other tables in this report may not calculate exactly due to rounding. Non-rounded values were used in these and other calculations throughout this report. [ Return to note 1. ]
2 This year section increases range from 2% to 4%. Section increases ranged from 3% to 6% in 2010, from1% to 7% in 2009, and from 2% to 11% in 2008. [ Return to note 2. ]
3 See Appendix A for a description of the scoring for the WZ SA. [ Return to note 3. ]
previous | next