Detailed Results
This section presents the results of the 2010 WZ SA at a more detailed level. The results represent a compilation of scores and comments submitted from 52 Divisions/States. For each section of the WZ SA, the information includes:
- An explanation of the intent of the section;
- National average ratings for each question in the section and comparative data from the 2009 WZ SA; and
- The questions asked in that section with a question-by-question discussion of the scores, including the percentage of agencies implementing the practice asked about in the question (meaning they rated themselves at 7 or higher) and a summary of comments included by respondents in the results they submitted.
The section on results of the 2010 WZ SA supplemental questions includes a question-by-question discussion of the scores, including how many agencies have experienced a change as a result of the Rule.
Many respondents provided comments for some questions. The respondents that provided comments offer helpful examples of some of the specific practices and efforts being undertaken to make work zones work better.
Another rich source of examples is the FHWA Work Zone Program website at https://www.fhwa.dot.gov/workzones.htm. The website contains work zone publications, studies, links, training information, technical resources, and best practices, as well as examples of what agencies are doing to support implementation of the Rule. A series of guides published by FHWA to assist transportation agencies in implementing the Rule (23 CFR 630 Subpart J) contains many good examples of State DOT practices in use and provides references to helpful informational resources.
Since 2007, the WZ SA has included linkages, as applicable by question, to the appropriate sections of the Work Zone Rule. As agencies worked to implement the Work Zone Rule by the October 12, 2007 deadline and since, these efforts have affected the ratings in a positive way.
Leadership and Policy
Agency leadership support should drive overall policy making for the agency. This support fosters an environment conducive to developing an effective work zone program. Project planning, design, and construction and maintenance activities should all incorporate consideration of work zone safety and mobility impacts and mitigation strategies. Agency management should facilitate and encourage a multidisciplinary approach to traffic management throughout all phases in the life of a project. Senior managers should be personally, visibly, and proactively involved in efforts to enhance the safety of motorists and workers in work zones and minimize work zone delays.
Goals provide high-level direction and establish expectations for agency staff. Clear and specific goal statements such as "Reduce congestion and delay in work zones by 10 percent in 5 years" establish a basis on which to develop strategies and actions. Use of performance measures helps to assess progress toward fulfillment of a goal. For example, to track progress toward reduction of work zone delays, an agency may gather information regarding the total vehicle hours of delay for a sample of work zones and track these values over time.
Figure 2 shows the average rating by question for 2009 and 2010 for the Leadership and Policy section. Table 3 shows the numeric ratings along with the percent change from 2009 to 2010 for each question.
Figure 2. Results for Leadership and Policy Section
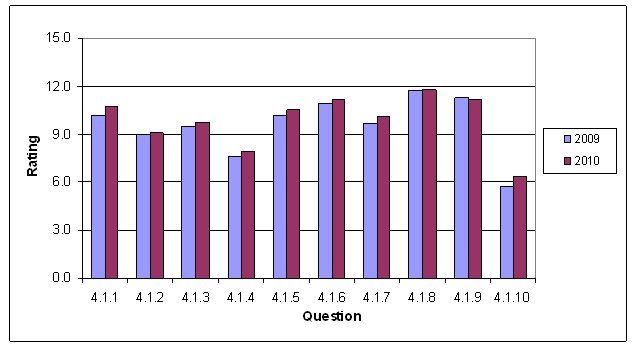
| Section | 2009 | 2010 | Change | Percent Change |
|---|---|---|---|---|
| 4.1.1 | 10.2 | 10.7 | 0.6 | 6% |
| 4.1.2 | 9 | 9.1 | 0.1 | 2% |
| 4.1.3 | 9.5 | 9.8 | 0.3 | 3% |
| 4.1.4 | 7.6 | 7.9 | 0.3 | 4% |
| 4.1.5 | 10.1 | 10.6 | 0.4 | 4% |
| 4.1.6 | 10.9 | 11.2 | 0.3 | 3% |
| 4.1.7 | 9.7 | 10.1 | 0.3 | 3% |
| 4.1.8 | 11.7 | 11.8 | 0.1 | 1% |
| 4.1.9 | 11.3 | 11.2 | -0.1 | -1% |
| 4.1.10 | 5.8 | 6.3 | 0.6 | 10% |
The average ratings increased for most of the questions in this section. Questions 10 and 1 saw the largest increases (10 percent and 6 percent respectively) from 2009 to 2010 in this section. Question 10 saw the second largest increase of all questions in the WZ SA. Question 9 decreased slightly, and one agency noted that their 2009 score was too high and lowered it for 2010. All but question 10 had a national average score of 7.0 or greater, indicating that, on average, agencies are implementing the practices covered in this section.
4.1.1 Has the agency developed a process to determine whether a project is impact type I, II, III, or IV? Forty-eight agencies (92 percent) have developed a process to determine the impact type of projects. The average score for this question had a 6 percent increase from 2009 to 2010 (similar to the 8 percent increase from 2008 to 2009). Several agencies cited use of a process to filter out significant projects without classifying all projects based on impact type I, II, III, or IV. One agency noted use of a "Level of Significance Process" to classify projects as part of their overall work zone safety and mobility policy. Another agency cited use of a project classification process, but does not specifically categorize projects as type I, II, III, and IV. Nearly all agencies noted attention to the significance of projects, with focus on mitigating the impacts. A few agencies also plan to evaluate the process to measure the effectiveness of project impact type determination.
4.1.2 Has the agency established strategic goals specifically to reduce congestion and delays in work zones? Almost three-fourths of agencies (71 percent) indicated that they have strategic goals to reduce work zone congestion and delays. Some agencies noted that they are in the process of developing strategic goals. Several agencies cited specific performance measures as they relate to mobility goals, and some appear to be using the terms interchangeably. Such performance measures include threshold values such as a maximum of 10 minutes additional travel time above normal, Level of Service D, and a volume-to-capacity ratio of 0.80 or less. One agency cited a delay goal of no more than two levels of service below the baseline (pre-construction) conditions. Another agency noted that it has a process to analyze the impacts from lane closures using measures that relate directly to the goals of its work zone safety and mobility policy.
4.1.3 Has the agency established strategic goals specifically to reduce crashes in work zones? Thirty-nine agencies (75 percent) have strategic goals specifically to reduce crashes in work zones. Three agencies mentioned having work zones as an emphasis area in their Strategic Highway Safety Plan, one with a goal of reducing work zone fatalities by 10%. Several agencies mentioned a strategic goal of reducing work zone fatalities, with a small number of States mentioning specific numeric goals. One agency mentioned a strategic goal of zero worker fatalities in a year. The agency also cited some particular practices it adopted to support a strategic goal of work zone safety, including use of high visibility safety apparel, enhancing its policy on reduced speed limits in work zones, conducting public awareness campaigns in coordination with partners to improve driver behavior, and using the latest technologies to enhance work zone safety. Another agency mentioned a strategic goal of improving traffic crash data collection, processing and reporting. Agencies also noted improving safety via public information for motorists, move over laws, and the use of advanced technology for safety applications in work zones. Some agencies noted doing post-construction analysis, such as use of crash statistics and other analysis techniques. For many agencies, goals for safety impacts appear more structured, with a clearer separation between goals and performance measures, than those listed in response to Question 4.1.2 for mobility goals.
4.1.4 Has the agency established measures (e.g., vehicle throughput or queue length) to track work zone congestion and delay? Over half (58 percent) of the agencies are implementing measures to track work zone congestion and delay. The average score for this item increased 3 percent (from 7.6 to 7.9) between 2009 and 2010, a much smaller increase than in previous years. One agency has established a capacity value for a single lane in a work zone as a first step toward establishing performance measures for congestion and delay. Another agency cited queue length, travel time, and level of service as the primary measures used, as outlined in their lane closure analysis guidelines. Another agency established delay thresholds for corridors and manages these measures on a project-by-project basis. Some agencies are looking to technology to better obtain the types of data that may be available for evaluation of congestion and delay, while others obtain qualitative information through public input (which they perceive may be more efficient).
4.1.5 Has the agency established measures (e.g., crash rates) to track work zone crashes? Forty-three agencies (83 percent) have established measures to track work zone crashes. Some agencies indicated that they have focused on improving reporting for work zone crashes. One agency noted enhanced reporting parameters such as the type of crash, whether or not traffic control devices were present, the location of the crash (in or outside the work zone), and whether or not positive protection devices such as portable concrete barriers were present. One agency noted that it tracks the number of fatalities and injuries in work zone crashes on a quarterly and annual basis. The same agency noted that an annual report is developed that examines crash trends in work zones. Agencies may also calculate crash rates if enough data are available and if a reasonable analysis period exists. However, work zones are commonly too short in duration to adequately examine crash rates as a meaningful measure. There is also often a time lag in data being available for analysis.
4.1.6 Has the agency established a policy for the development of Transportation Management Plans to reduce work zone congestion and crashes? Forty-eight agencies (92 percent) are implementing a policy for the development of Transportation Management Plans (TMPs) to reduce work zone congestion and crashes. Since TMPs are required for all Federal-aid highway projects, 100 percent of agencies should be implementing TMPs. Some agencies noted use of guidelines that structure the development of the TMP, and some provide training on TMP development. One agency noted a need to evaluate how well the components of the TMP are incorporated into contract documents. Most agencies cited a policy or guidance document that outlines the considerations for development of a TMP. The average rating for this question increased slightly from 2009 to 2010.
4.1.7 Has the agency established work zone performance guidance that addresses maximum queue lengths, the number of open lanes, maximum traveler delay, etc.? Standards for work zone performance guidance have been established in 44 agencies (85 percent). One agency noted use of performance measures and guidance on a project by project basis without a formal policy. Several agencies noted use of proactive policies for when to allow lane closures and other capacity restrictions based on time of day and anticipated demand, which are based on estimates of metrics such as queue lengths and delay. Another agency cited use of maximum queue lengths, maximum delay, and Level of Service as referenced in their lane closure analysis guidelines. Some agencies cited specific values for maximum delay (e.g. 10 minutes additional travel time caused by the work zone) and Level of Service (e.g. LOS D). Many agencies have allowable lane closure tools that are used at the project level.
4.1.8 Has the agency established criteria to support the use of project execution strategies (e.g., night work, full closures) to reduce public exposure to work zones and reduce the duration of work zones? Forty-nine agencies (94 percent) have established criteria to support the use of project execution strategies. Several agencies noted use of strategies such as nighttime construction and full road closure, but did not mention specific criteria to support these decisions. One agency noted use of criteria such as type of roadway (high volume roadways) and other areas considered high impact locations for work zones. Another agency noted use of a full closure work plan with criteria and guidelines to make consideration of this practice routine. Another agency uses criteria such as traffic volumes by time of day, accessibility to alternate routes, worker safety considerations, and considerations for impacts to motorists and local businesses. There is a trend across multiple agencies to reduce the need for more complex strategies, and criteria for when to use them, by avoiding lane closures and capacity restrictions during peak periods.
4.1.9 Has the agency developed policies to support the use of innovative contracting strategies to reduce contract performance periods? Fifty agencies (96 percent) have developed policies to support the use of innovative contracting strategies to reduce contract performance periods. Responses to this question reflected a slight decrease in the overall average score this year due to slight decreases in scores for six agencies, but overall, the number of agencies that have reached implementation increased from 47 in 2009 to 50 in 2010. Strategies used include A+B bidding, delayed start specifications, design-build, lane rental, and incentives/disincentives on major projects. One agency noted specifically using innovative contracting techniques to accelerate the delivery of bridge projects. Another agency reported having a policy in place for use of innovative contracting strategies, and noted that development of a design-build manual is underway. One agency noted that it does not use some innovative contracting strategies such as A+B bidding and lane rental because of legislative limitations.
4.1.10 Has the agency established Memoranda of Understanding (MOU) between utility suppliers to promote the proactive coordination of long-range transportation plans with long-range utility plans, with the goal of reducing project delays and minimizing the number of work zones on the highway? Only 24 agencies (46 percent) have established an MOU with utility suppliers to promote the proactive coordination of long-range transportation plans with long-range utility plans. This continues to be one of the lowest rated questions of the WZ SA and is tied with two other questions for the lowest number of agencies who are implementing the activity. However, this question had the second largest increase in the average score, increasing 10 percent from 5.8 in 2009 to 6.3 in 2010 due to increases in average ratings by 12 agencies. While many agencies do not have a formal MOU, several agencies have agreements and cooperative understandings in place with utility suppliers. One agency noted that they have updated their Construction Manual to provide direction in resolving utility issues on construction projects. Another agency incorporates utility needs into construction projects and restricts any future utility work in that area for 5 years after completion of each project. One agency has a three phase approach that includes early detection of utility impacts, incentives to utilities to include their work in the State's project contracts, and a pilot program where projects include a line item to allow the early start of utility work.
Project Planning and Programming
While transportation planning and implementation processes differ significantly from State to State, they all focus on developing increased capacity and efficiency in the transportation system. They do this by developing long-range transportation plans (LRTPs), transportation improvement program plans (TIPs), unified planning work programs (UPWPs), and in some cases congestion management system (CMS) plans.
Transportation management and operations (M&O) – including work zone management – is increasingly important to the planning professional. Metropolitan areas account for 83.5 percent of the Nation's population4 and 90 percent of its economic output.5 They are centers for social as well as economic activity and are the hubs of the national transportation system. To meet the challenge of continued mobility, the planning community needs to take an active role in the development and implementation of transportation system M&O strategies.
The complexity of our transportation systems and the impact of congestion on our Nation necessitate input from planners during project development in order to better assess and manage work zone impacts. The following are some example roles for planners:
- Using analytical traffic models to assess the system-wide impacts of specific project requirements;
- Evaluating programming estimates to ensure that the proper level of funding is included to mitigate traffic congestion and improve safety through work zones; and
- Providing the critical "bridge" of knowledge between the planning world and the design world to reduce the impacts of work zones on the traveling public.
Figure 3 shows the average rating by question for 2009 and 2010 for the Project Planning and Programming section. Table 4 shows the numeric ratings along with the percent change in average rating from 2009 to 2010 for each question. The average ratings increased for all of the questions in this section.
Figure 3. Results for Project Planning and Programming Section
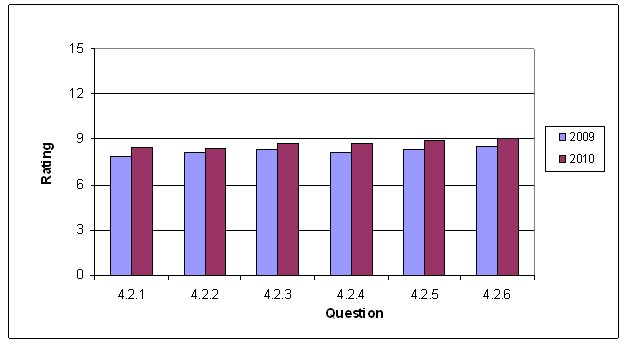
| Section | 2009 | 2010 | Change | Percent Change |
|---|---|---|---|---|
| 4.2.1 | 7.9 | 8.5 | 0.6 | 8% |
| 4.2.2 | 8.1 | 8.4 | 0.3 | 4% |
| 4.2.3 | 8.3 | 8.7 | 0.4 | 5% |
| 4.2.4 | 8.1 | 8.8 | 0.6 | 8% |
| 4.2.5 | 8.3 | 8.9 | 0.6 | 8% |
| 4.2.6 | 8.6 | 9.1 | 0.5 | 6% |
4.2.1 Does the agency's planning process actively use analytical traffic modeling programs to determine the impact of future type I and II road construction and maintenance activities on network performance? Over two-thirds (67 percent) of agencies actively use analytical traffic modeling programs to determine the impact of future type I and II project activities. The average rating for this question increased by 8 percent from 2009, and two agencies crossed the implementation threshold with large increases in their rating for this question. Some agencies perform analysis at the corridor level to identify cumulative road user impacts from multiple projects. Agencies cited use of a fairly broad range of proprietary software applications, including PeMS, HCS, QuickZone, Paramics, VISSIM, NETSIM, WZCAT, TransModeler, and Synchro for modeling construction impacts. The tools cited range from macroscopic to microscopic and require varying levels of input detail; they can provide more or less detailed output data depending on the type of model used. One agency is implementing a web-based training program that highlights some of the most common tools.
4.2.2 Does the agency's planning process include developing alternative network options (e.g., frontage roads, increased capacity on parallel arterials, beltways, or strategically placed connectors) to maintain traffic volumes during future road construction and maintenance? Sixty-five percent (34) of the agencies reported developing alternate network options for traffic volumes that could be delayed due to future road construction. Some agencies noted that planning processes include projections of future demand for facilities as part of systems planning, however such improvements may not be made due to funding constraints. One agency noted that during the planning process various disciplines are asked to provide input relative to future network performance when developing a project. More often, agency comments indicated that consideration of adequate capacity during construction is done on a project by project basis, when details from the scoping and design of the project is available for evaluation of demand and capacity during construction. Upgrading alternate routes and eliminating choke points and bottlenecks on a network are common techniques used prior to mainline construction to improve traffic flow.
4.2.3 Does the agency's planning process manage the transportation improvement program to eliminate network congestion caused by poorly prioritized and uncoordinated execution of projects? Forty agencies (77 percent) indicated they make efforts during the planning process to manage the transportation improvement program to eliminate network congestion caused by poorly prioritized and uncoordinated execution of projects. One agency cited use of a process at the corridor planning level for coordination of improvements. Another agency said that it's work zone policy has improved corridor coordination among adjacent Districts. Two agencies mentioned that their TMP Guidelines require the identification of projects on nearby routes that may cause cumulative traffic impacts, with project planners and designers reviewing the coordination of projects. Other practices mentioned for facilitating coordination include using internal applications and a public traveler information map; participating on committees in large urban areas to discuss upcoming construction activities, and conducting an online shared resources review of projects.
4.2.4 Does the agency's transportation planning process include a planning cost estimate review for work types I, II, and III that accounts for traffic management costs (e.g., incident management, public information campaigns, positive separation elements, uniformed law enforcement, and Intelligent Transportation Systems [ITS])? Thirty-seven agencies (71 percent) have a process for estimating traffic management costs during the transportation planning process. The average rating for this question increased by 8 percent from 2009. Most commenting agencies stated that traffic management costs for these types of strategies are included in the design phase, as more specific information is known about each project during design. One agency noted that a local assistance procedures manual provides guidance to local agencies on including appropriate pay provisions within their plans, specifications, and estimates. Another agency noted that its planning branch does estimates on project costs on a biennial basis as it develops and prioritizes projects for the 6-year plan.
4.2.5 Does the agency's transportation planning process include the active involvement of planners during the project design stage to assist in the development of congestion mitigation strategies for type I and II projects? Planners assist in developing congestion mitigation strategies in 38 agencies (73 percent). Agencies involve local planners (MPO representatives) in the process for State projects. Several agencies noted that planners are actively involved during the project design stage. One agency cited planner involvement during the design phase for type I and II projects. Some agencies noted the distinction between statewide or high level planning and project planning. Most strategy development appears to exist at the project planning and design stages.
4.2.6 Does the agency's transportation planning process engage planners as part of a multidisciplinary/multiagency team in the development of Transportation Management Plans involving major corridor improvements? For 40 agencies (77 percent), the transportation planning process engages planners as a part of a team in the development of TMPs. Many agencies indicated that planners are included as part of the team for overall project development, including TMP development and review. Some agencies noted that planners are invited but may not participate in TMP development depending on the scope and needs of the project. One agency said that city planners are now involved in TMP development and that this has been a valuable addition to its process. Another agency mentioned engaging planners along with local partners, such as transportation agencies and councils of government, to assist in defining and implementing TMP strategies such as use of freeway service patrols and public transit subsidies. Another agency referenced use of a context-sensitive solutions process that involves personnel from various disciplines, including planning.
Project Design
Project designers, working in concert with other functional experts, should consider work zone maintenance of traffic issues early in the design process. Designers should examine the use of different project execution strategies that can accelerate construction, thereby reducing construction time and minimizing the exposure of travelers to work zones. In addition, designers should actively lead the preparation of Transportation Management Plans (TMPs) that will mitigate the impact of work zone activities.
Figure 4 shows the average rating by question for 2009 and 2010 for the Project Design section. Table 5 shows the numeric ratings along with the percent change in average rating from 2009 to 2010 for each question. The average ratings increased for all but one of the questions in this section. Question 12 had the biggest increase (11 percent) of all questions in the WZ SA. All the questions are at or beyond the implementation stage (score of 7 or higher), meaning on average agencies are implementing the practices addressed in this section. Many agencies are now in the assessment phase (score of 10-12).
Figure 4. Results for Project Design Section

| Section | 2009 | 2010 | Change | Percent Change |
|---|---|---|---|---|
| 4.3.1 | 10 | 10.7 | 0.6 | 6% |
| 4.3.2 | 10.3 | 10.9 | 0.6 | 6% |
| 4.3.3 | 10.7 | 11.1 | 0.5 | 4% |
| 4.3.4 | 11.2 | 11.6 | 0.5 | 4% |
| 4.3.5 | 8.3 | 8.6 | 0.3 | 3% |
| 4.3.6 | 10.7 | 10.9 | 0.2 | 2% |
| 4.3.7 | 8.6 | 9 | 0.4 | 4% |
| 4.3.8 | 9.9 | 10.6 | 0.7 | 7% |
| 4.3.9 | 12.4 | 12.2 | -0.2 | -1% |
| 4.3.10 | 9.6 | 10 | 0.4 | 5% |
| 4.3.11 | 7.4 | 7.6 | 0.2 | 2% |
| 4.3.12 | 8.6 | 9.6 | 0.9 | 11% |
4.3.1 Does the agency have a process to estimate road user costs and use them to evaluate and select project strategies (full closure, night work, traffic management alternatives, detours, etc.) for type I and II projects? Forty-four agencies (85 percent) have a process to estimate road user costs. Some agencies mentioned specific tools for estimating road user costs, while others noted general consideration of road user costs without citing a specific process for how they estimate such costs. One agency developed a tool assessing the loss of public benefit and provides guidance on how to estimate road user costs. Another agency noted use of A+B bidding on projects where the engineers' cost estimates are greater than $5 million and road user cost estimates are $5,000 per day or more. While several agencies noted use of a tool to estimate road user costs, the processes used across agencies and the results likely vary depending on assumptions and inputs.
4.3.2 Does the agency develop a Transportation Management Plan that addresses all operational impacts focused on project congestion for type I and II projects? Forty-nine agencies (94 percent) develop a TMP that addresses all operational impacts with a focus on project congestion for type I and II projects. While all 52 responding agencies have not achieved the implementation level for this question, the average ratings for 19 agencies increased from 2009 to 2010 and the overall average rating for this question increased by 6 percent over the same time period. Ratings for two agencies reached the implementation threshold in 2010, while one agency's rating decreased below the implementation threshold. This agency did not provide comments as to why the rating decreased below the threshold. Several agencies are utilizing training programs to supplement TMP guidelines and practices.
4.3.3 Does the agency use multidisciplinary teams consisting of agency staff to develop Transportation Management Plans for type I and II projects? Forty-nine agencies (94 percent) use multidisciplinary teams. These teams may consist of staff from planning, design, construction, operations, and other external stakeholders such as the public. In some cases, multidisciplinary teams are used primarily on high priority projects. Most agencies cited use of multidisciplinary teams in TMP development and also during the different stages of design review (30%, 60%, and 90%). One agency noted that if a consultant is used on a project, the process involves coordination with agency traffic, construction, and maintenance staff. Another agency noted that the first step in the TMP development process is to develop a multidisciplinary team consisting of agency staff, consultants, and other stakeholders.
4.3.4 Does the agency perform constructability reviews that include project strategies to reduce congestion and traveler delays during construction and maintenance for type I and II projects? Fifty agencies (96 percent) use constructability reviews on projects. This practice continues to have one of the highest implementation rates in the WZ SA. Agencies may only require constructability reviews for complex projects, or may decide to use them on a project-by-project basis. One agency noted that an internal constructability review unit performs reviews in-house on small- and medium-sized projects and uses consultants for reviews on larger projects. This agency also noted that a critical component of the reviews is to ensure the availability of the roadway to travelers. Another agency noted that reviews take place between the design and construction phases for projects. Another agency said that constructability reviews are required on all projects and are performed in conjunction with the development of the project's TMP.
4.3.5 Does the agency use independent contractors or contractor associations to provide construction process input to expedite project contract times for type I and II projects? Forty-one agencies (79 percent) use contractor associations to provide construction process input. One agency cited occasional use of contractor associations on experimental/demonstration projects for construction process input to assess work zone congestion and delay as well as constructability. The same agency uses joint contractor/agency teams for constructability reviews, value engineering analysis, and determination of innovative contracting strategies. A few agencies noted that an obstacle to this practice is the timing of the input solicitation and the potential or perceived conflict of interest in sharing information with prospective bidders.
4.3.6 Does the agency use scheduling techniques that are based on time and performance, such as the critical path method or parametric models, to determine contract performance times for type I and II projects? Forty-six agencies (88 percent) are using a technique to determine contract performance times for type I and II projects. Several agencies noted use of the critical path method (CPM) during the construction phase and other tools such as CA4PRS to determine performance times, especially for type I and II projects. Tools such as CA4PRS evaluate a balance between construction techniques and overall impacts to road users. One agency cited the use of scheduling techniques after letting and during the pre-construction phase for A+B and design-build projects. Another agency noted that CPM specifications are developed for very large projects (greater than $100 million in cost). No agencies referenced use of parametric models.
4.3.7 Does the agency have a process to evaluate the appropriate use of ITS technologies to minimize congestion in and around work zones for type I, II, and III projects? Forty-three agencies (83 percent) have a process to consider ITS technologies to minimize work zone congestion. Several agencies noted use of ITS, especially on significant projects. Agencies use stand-alone work zone ITS systems and also use existing, permanent ITS for monitoring and management. Some agencies noted use of pilot projects to test these systems, along with evaluation projects to determine benefits. Another agency noted consideration of ITS as part of its overall TMP development process. Specific types of ITS referenced include dynamic early/late merge systems and information systems linked to communications medium including websites.
4.3.8 Does the agency have a process to consider life-cycle costing when selecting materials that reduce the frequency and duration of work zones for type I, II, and III projects? Life-cycle costing (LCC) is used by 45 agencies (87 percent) to reduce the frequency and duration of work zones. One agency cited use of LCC to select a pavement type during the project development process for Type I, II, and III projects. Another agency noted use of value engineering studies to help evaluate life-cycle costs for projects. A few agencies noted that LCC analysis is used more for bridge projects. One agency noted that material selections are generally made to reduce the amount of maintenance needed, but this is not done in an LCC framework.
4.3.9 Does the agency have a process to assess projects for the use of positive separation devices for type I and II projects? Forty-eight agencies (92 percent) have a process to assess projects for the use of positive separation devices for type I and II projects. The average rating for this question decreased slightly from 2009 to 2010; however, ratings for nine agencies increased during the same time period. One agency rating increased above the implementation threshold, while ratings for three agencies decreased below the implementation threshold. Some agencies set standards and specify that certain project types require positive separation devices. Agencies noted factors for consideration of positive separation (also referred to as positive protection) such as type of roadway, speed, types of hazards, and duration and size of project. For example, an agency's positive separation process could include requiring the use of temporary concrete median barriers for major projects and on high-speed facilities, and/or using shadow vehicles, moveable concrete barriers, and arrestor nets to provide positive protection.
4.3.10 Does the agency anticipate and design projects to mitigate future congestion impacts of repair and maintenance for type I, II, and III projects? Forty-seven agencies (90 percent) incorporate features into their project designs that accommodate the need for future repair and/or maintenance activities. One agency provides maintenance vehicle pullouts on high volume highways and other areas where access cannot be made from local streets to mitigate future congestion associated with repairs. Another agency noted that they install longer lasting pavement markings to mitigate future congestion impacts from maintenance and repair. Some agencies mentioned building additional lanes or full depth shoulders for use in enhancing capacity and reducing delay during future rehabilitation projects.
4.3.11 When developing the Traffic Control Plan for a project, does the agency involve contractors in developing the Traffic Control Plan for type I and II projects? Contractors are involved with the development of traffic control plans (TCPs) in 30 agencies (58 percent). This represents one less agency compared with 2009; however, the overall average score for this question increased from 7.4 in 2009 to 7.6 in 2010. Many agencies noted that they allow the contractor to submit proposed revisions to the TCP after award, but that input during project development is less frequent. When input occurs during project development it tends to primarily involve constructability reviews. Contractor input may also come through value engineering or design-build jobs. One agency noted that it routinely conducts constructability reviews prior to letting large impact projects, and requires value engineering team reviews during the design phase of all projects exceeding $25 million estimated cost. In each of these reviews, independent contractors and/or contract association representatives are involved. In many instances, subcontractors are hired to handle traffic control for the project, but plans are often developed during the design stages prior to involvement of the subcontractor (design-build projects are one exception).
4.3.12 When developing the Traffic Control Plan for a project, does the agency use computer modeling to assess Traffic Control Plan impacts on traffic flow characteristics such as speed, delay, and capacity for type I and II projects? Forty-three agencies (83 percent) implement computer modeling in the development of traffic control plans. This question had the highest increase (11 percent) of all the questions on the WZ SA. This overall increase was due to increases in ratings for 24 agencies from 2009 to 2010, with three agencies having rating increases to above the implementation threshold. Agencies reported using software such as Sketch Planning, QuickZone, LCAP, Corsim, Synchro/SimTraffic, VISSIM, TREX, COSMIX, CA4PRS, and WZCAT for analyzing impacts. The comments indicated that the increased use of modeling is likely due in part to increased attention by agencies in assessing work zone impacts and agencies familiarizing their personnel with simple to use sketch-planning models that can be used for assessing impacts. FHWA's webinars and new guides and training courses on the topic may also be contributing to greater use of modeling tools.
Project Construction and Operation
A roadway construction or maintenance site can be a very complex orchestration of activities that affect the public in many ways. There are many pieces to the project delivery process and everyone has a critical role, but what the public mostly sees and experiences is the construction phase of the process. The use of letting strategies, quality-based contractor selection, time-sensitive bidding, efficient operations, traffic management, aggressive contract management, and good public information can help agencies improve the execution and public perception of transportation improvements.
Complaints from the traveling public often focus on the proper use and maintenance of traffic control devices, work zone lane closures when no work is occurring, and inadequate traveler information. Some common problems include signs that inform travelers of conditions that do not exist, striping that is misleading, changeable signs that show the wrong message, cones/drums that are improperly spaced, and lack of advance notice about lane closures, detours, or expected delays. These issues have an impact on agency credibility with the traveling public. Drivers develop work zone habits that are based on past observations. Agencies can require and provide incentives for work zone contractor personnel to be trained in the proper application and maintenance of traffic control devices in work zones and the implementation of other TMP strategies.
Figure 5 shows the average rating by question for 2009 and 2010 for the Project Construction and Operation section. Table 6 shows the numeric ratings along with the percent change in average rating from 2009 to 2010 for each question. Overall, this section had the second highest average rating (10.5) of the six sections. The average ratings increased slightly for most of the questions in this section. All the questions are at or beyond the implementation stage (score of 7 or higher), meaning on average agencies are implementing the practices addressed in this section.
Figure 5. Results for Project Construction and Operation Section
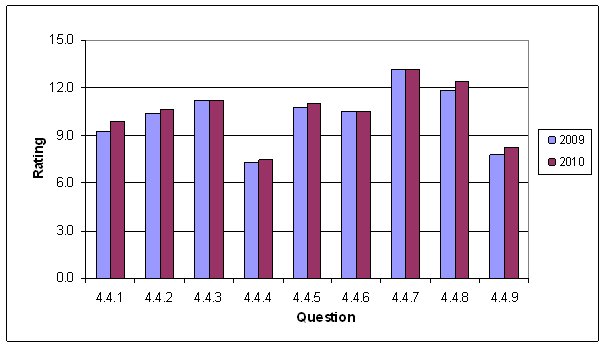
| Section | 2009 | 2010 | Change | Percent Change |
|---|---|---|---|---|
| 4.4.1 | 9.3 | 9.9 | 0.6 | 7% |
| 4.4.2 | 10.4 | 10.7 | 0.3 | 3% |
| 4.4.3 | 11.3 | 11.2 | 0 | 0% |
| 4.4.4 | 7.3 | 7.4 | 0.2 | 2% |
| 4.4.5 | 10.8 | 11 | 0.3 | 2% |
| 4.4.6 | 10.5 | 10.5 | 0 | 0% |
| 4.4.7 | 13.2 | 13.2 | 0 | 0% |
| 4.4.8 | 11.8 | 12.4 | 0.6 | 5% |
| 4.4.9 | 7.8 | 8.3 | 0.5 | 6% |
4.4.1 Is the letting schedule altered or optimized to reflect the available resources and capabilities of the construction industry? Forty-two agencies (81 percent) alter or optimize their letting schedule based on contractor resources and capabilities. Several agencies noted that they spread out project advertisements so that a larger number of contractors have a chance to bid on jobs. One agency noted that its design branch seeks to optimize contractor availability and resources for construction projects by evaluating letting schedules. Another agency lets projects early in the year and provides a flexible notice to proceed to contractors. One agency noted that it uses a quarterly distribution of funds (20-30-30-20) to spread out its budget and construction industry contractor resources. A few agencies said that other factors tend to drive the letting schedule. One agency noted that its letting schedule is often driven by fiscal process constraints. Another agency said that it does review the letting schedule based on available construction industry resources, but that a more significant factor in its letting schedule is the time needed to complete the job since the agency tries to minimize the number of projects carried over winter.
4.4.2 Is the letting schedule altered or optimized to minimize disruptions to major traffic corridors? Forty-seven agencies (90 percent) are minimizing disruptions on major traffic corridors by optimizing the letting schedule. Projects are reviewed to make sure that multiple projects do not adversely impact traffic along certain corridors. One agency noted that schedules are frequently optimized for major corridors. Two examples include altering the letting schedule to avoid vacation season and the school year, and separating or combining projects in close proximity to one another to minimize impacts. Another agency noted flexibility in the start time if the same contractor is awarded two projects in close proximity to one another. The same agency said it may not issue a notice to proceed until the next season if a similar situation exists but involves two different contractors.
4.4.3 When bidding type I and II projects, does the agency include road user costs in establishing incentives or disincentives (e.g., I/D, A+B, or lane rental) to minimize road user delay caused by work zones? Forty-nine agencies (94 percent) include road user costs in establishing incentives/disincentives (I/D) to minimize road user delay in work zones. One agency that had very limited experience with I/D increased its use of I/D to more than 10 contracts in 2010, with the I/D based on road user cost (RUC). Some examples of the strategies used by agencies include A+B bidding, lane rental, and I/D such as liquidated damages. Agencies generally did not specify how RUC is determined. One agency provided specific thresholds for its use of cost + time (A+B) bidding as projects with engineer estimates greater than $5 million and RUC of $5,000 per day or more. The agency is developing guidelines to encourage cost + time bidding on other projects and plans to review its methods for calculating RUC to ensure statewide consistency.
4.4.4 When bidding type I, II, and III projects, does the agency use performance-based selection to eliminate contractors who consistently demonstrate their inability to complete a quality job within the contract time? Thirty agencies (58 percent) use performance-based selection to eliminate contractors that regularly have difficulty completing quality jobs on-time. In general, agencies noted that they cannot used performance-based selection due to Federal and/or State laws that prohibit this practice, but that they can address poor performance through the determination of who is eligible to bid on contracts. Many agencies noted the use of a prequalification process to reduce or eliminate the eligibility of contractors to bid on projects when contractors have demonstrated poor performance. It appears that some agencies took a strict interpretation of this question, resulting in a low score due to the legal restrictions and requirements to use the low-bid process. Other agencies interpreted this question broadly as performance-based criteria (to include pre-qualification and approved alternate bid options such as design-build), resulting in a higher score. The wording of this question for 2011 will be changed from "performance based selection" to "performance based criteria" to clarify the intent of the question.
4.4.5 When bidding type I and II project contracts, does the agency use incident management services (e.g., wreckers, push vehicles, and service patrols)? Incident management (IM) services such as wreckers, courtesy patrols, and off-duty highway patrol officers are used by 47 agencies (90 percent). Most agencies indicated that project-specific IM services are used on a case-by-case basis. Several agencies noted that IM services may already be available in the area of a project and that the need for additional services is assessed as part of the project development and TMP process. Projects in major corridors or with a high level of impacts are more likely to include bid items for services such as motorist assist or tow truck service patrols, wrecker services, or an on-call towing service. Several agencies referenced a linkage between service patrols and traffic management center technologies such as cameras that assist with incident verification and response. One agency noted more routine use of IM services on appropriate projects throughout the State and that detailed incident event template guidelines have been developed and are being used.
4.4.6 In bidding contracts, does the agency use flexible starting provisions after the Notice to Proceed is issued? Forty-four agencies (85 percent) routinely use flexible starting provisions after the Notice to Proceed (NTP) is issued. One agency recently approved a start of work specification for maintenance projects that allows the contractor the flexibility to schedule its start of work. Another agency noted that contractors are allowed to specify the start date for a project, as long as it is completed within a specific time period (e.g., prior to the end of a season for a paving project). Another agency noted that all projects have some flexibility between award and notice to proceed. The same agency said that the NTP is normally within 45 days of award; however, the NTP may be extended to after winter if a winter shutdown date occurs during or immediately after the 45 day window. This agency also noted that it may include a two-part NTP in a contract to allow for procurement of materials prior to actual construction.
4.4.7 During type I, II, and III projects, does the agency use uniformed law enforcement? Fifty agencies (96 percent) use uniformed law enforcement on projects. This question is tied with question 4.5.4 for the highest overall rating of any question in the WZ SA, indicating that the use of law enforcement in work zones is a well-established and assessed practice in many agencies. Typical law enforcement roles include providing enhanced visibility during installation/removal of work zone traffic control; presence as a deterrent to speeding; and active enforcement. In some cases officers may also assist with traffic control. Some agencies use law enforcement personnel on a project-by-project basis, but most agencies noted that the use of law enforcement is well-integrated into the agency project development process. A few agencies noted that they are evaluating the use of law enforcement in work zones to ensure effective use. Automated speed enforcement is used in several States and may require an officer to be present.
4.4.8 Does the agency provide/require training of contractor staff on the proper layout and use of traffic control devices? Nearly all agencies (94 percent) indicated that they provide and/or require training of contractor staff on proper use of traffic control devices. A number of agencies provide training that is open to contractor staff and local agencies, as well as their own staff. Several agencies require training, specific to a job function such as flagging, from the National Safety Council (NSC) or other approved sources. One agency requires contractors to have a person on each project that holds a Traffic Control Supervisor Certificate from ATSSA. Another agency requires contractors to provide a trained Traffic Manager to oversee all maintenance of traffic operations. FHWA is sponsoring training courses through the Work Zone Safety Grants Program that provide many agencies with training at a substantially reduced cost.
4.4.9 Does the agency provide training to uniformed law enforcement personnel on work zone devices and layouts or ensure law enforcement personnel receive proper training elsewhere? Thirty-five (67 percent) of the responding agencies provide training to uniformed law enforcement. Some agencies currently use FHWA's "Safe and Effective Use of Law Enforcement Personnel in Work Zones" and one agency provides the training online. Another agency used the FHWA course as a starting point and developed a state-specific version. One agency noted that the primary benefits of this type of training are for field personnel and law enforcement officers to better understand the responsibilities of each and to coordinate activities in the work zone. A couple of agencies noted that law enforcement personnel participate in TMP meetings and other meetings where project staff review operations and the officer's role for that shift.
Communications and Education
To reduce public anxiety and frustration regarding work zones, it is important to sustain effective communications and outreach with the public about road construction and maintenance activity, and the potential impacts of the activities. This also increases the public's awareness of such activity. Lack of information is often cited as a key cause of frustration for the traveling public; therefore, the agency should identify and consider key issues from a public outreach and information perspective.
Figure 6 shows the average rating by question for 2009 and 2010 for the Communications and Education section. Table 7 shows the numeric ratings along with the percent change in average rating from 2009 to 2010 for each question. The average ratings increased for all of the questions in this section, with Question 5 experiencing the second largest increase (10 percent) of all questions in the WZ SA. The scores in this section have consistently been among the highest in the WZ SA and remain so this year. Many agencies are now in the assessment phase (scores of 10-12).
Figure 6. Results for Communications and Education Section
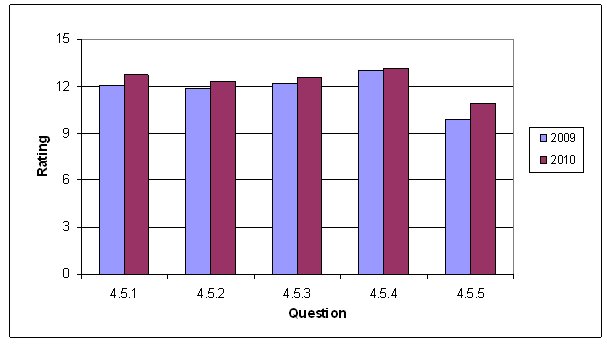
| Section | 2009 | 2010 | Change | Percent Change |
|---|---|---|---|---|
| 4.5.1 | 12.1 | 12.7 | 0.7 | 5% |
| 4.5.2 | 11.8 | 12.3 | 0.5 | 4% |
| 4.5.3 | 12.2 | 12.6 | 0.4 | 4% |
| 4.5.4 | 13 | 13.2 | 0.2 | 1% |
| 4.5.5 | 9.9 | 10.9 | 1 | 10% |
4.5.1 Does the agency maintain and update a work zone website providing timely and relevant traveler impact information for project types I, II, and III that allows travelers to effectively make travel plans? Fifty agencies (96 percent) implement a website to provide traveler impact information on projects to allow travelers to make more effective travel plans. Several agencies have a website that provides information on both recurring and non-recurring congestion (e.g., a 511 traveler information site), and have project specific websites for large projects. Some agencies update information on their websites on a daily basis, while others are designed to provide up to the minute traveler information for projects. Agencies also provide interactive maps that specify the location of lane closures and restrictions.
4.5.2 Does the agency sponsor National Work Zone Awareness week? Most agencies (88 percent) sponsor National Work Zone Awareness week. Some agencies have no formal campaign but still support the program while others have planned activities throughout the week. One agency hosts an annual memorial during National Work Zone Awareness Week in honor of workers who have died in the line of duty. Examples of other activities include holding press conferences, displaying the national work zone memorial, developing radio announcements, and holding work zone safety awareness conferences.
4.5.3 Does the agency assume a proactive role in work zone educational efforts? Fifty agencies (96 percent) are developing educational materials to inform and educate the public on work zone safety. Most agencies that provided comments cited the use of educational efforts such as public service announcements, press releases, brochures, and other marketing strategies. One agency noted use of a marketing firm to provide work zone safety and reduce aggressive driving through work zones by providing advertising, assistance with development of public/private partnerships, and a high school outreach tour to target young drivers. Several agencies noted conducting work zone educational efforts targeted at younger drivers, including through driver education programs.
4.5.4 During type I, II, and III project construction, does the agency use a public information plan that provides specific and timely project information to the traveling public through a variety of outreach techniques (e.g., agency website, newsletters, public meetings, radio, and other media outlets)? This practice is being implemented by all 52 reporting agencies. This question is tied with question 4.4.7 for the highest rating of all questions in the WZ SA, with many agencies commenting that it is a normal part of project delivery. The most frequently mentioned public information techniques used by agencies include publishing information on the agency's web site, providing information to media outlets, and the use of public information officers. Other techniques mentioned by agencies include highway advisory radio messages, press releases, radio, TV, newspaper ads, telephone hotlines, ITS technology, 511, RSS feeds, newsletters, and outreach to businesses.
4.5.5 During type I, II, and III projects, does the agency use ITS technologies to collect and disseminate information to motorists and agency personnel on work zone conditions? Forty-eight agencies (92 percent) use ITS technologies to collect and disseminate work zone information. The average rating for this question had the second largest percentage increase (10 percent) in the WZ SA from 2009 to 2010. The overall increase was due to increases in average ratings for 22 agencies from 2009 to 2010. The rating for seven agencies increased to above the implementation threshold. Some agencies noted use of sophisticated systems such as dynamic lane merge, variable speed limit systems, and automated speed enforcement systems. Some agencies noted use of more basic, isolated technologies such as portable changeable message signs to give the traveling public specific and timely project information, portable cameras, and speed display trailers.
Program Evaluation
Evaluation is necessary to identify successes and analyze failures. Work zone performance monitoring and reporting at a nationwide level can increase the knowledge base on work zones and help lead to the development of better tools to help agencies better plan, design, and implement road construction and maintenance projects. At the local level, performance monitoring and reporting provides an agency with valuable information on the effectiveness of congestion mitigation strategies, contractor performance, and work zone safety.
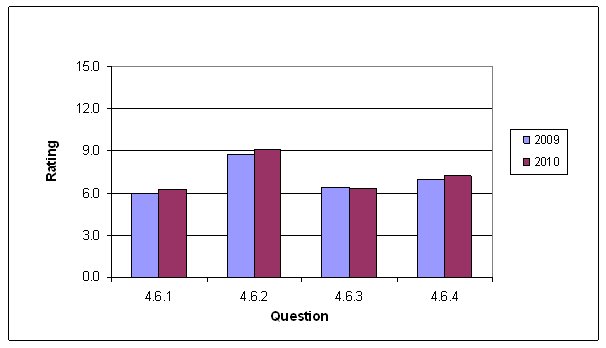
Figure 7 shows the average rating by question for 2009 and 2010 for the Program Evaluation section. Table 8 shows the numeric ratings along with the percent change in average rating from 2009 to 2010 for each question. The average ratings increased for most of the questions in this section, with question 3 showing a slight decrease. This section remains the lowest rated in the WZ SA.
Figure 7. Results for Program Evaluation Section
| Section | 2009 | 2010 | Change | Percent Change |
|---|---|---|---|---|
| 4.6.1 | 6 | 6.3 | 0.3 | 5% |
| 4.6.2 | 8.7 | 9.1 | 0.4 | 4% |
| 4.6.3 | 6.4 | 6.3 | -0.1 | -2% |
| 4.6.4 | 7 | 7.3 | 0.3 | 4% |
4.6.1 Does the agency collect data to track work zone congestion and delay performance in accordance with agency-established measures? (See Section 1, item 4.1.4) Less than half of responding agencies (46 percent) collect data to track work zone congestion and delay performance against agency measures. Although this question had an average score below the implementation threshold, it had a 5 percent increase in average rating from 2009 to 2010, indicating that more agencies are moving toward using data to track work zone congestion and delay. There was extensive variation in agency practices, ranging from agencies that have not yet defined measures for which to collect data, to agencies collecting data mainly through visual observation, to field engineers reporting performance on agency data collection forms or TMP summary forms, to the use of technology to collect data. One agency said that tracking work zone congestion and delay has been fully integrated into agency practices since 2008, in accordance with its work zone mobility policy. Some agencies noted that they focus their data collection on a sample of projects. One agency noted use of more qualitative measures such as public input and feedback as opposed to quantitative measures.
4.6.2 Does the agency collect data to track work zone safety performance in accordance with agency-established measures? (See Section 1, item 4.1.5) Thirty-nine agencies (75 percent) are collecting data to track work zone safety performance. One agency noted that work zone crash profile sheets and crash/incident report forms are used to track work zone safety performance. Several agencies reported tracking work zone crash statistics but did not indicate how the data are used. One agency mentioned the use of inspections to gather safety performance information. A few agencies cited a concern about the difficulty in determining if a crash was truly work zone-related. One agency noted the need for more detailed information in crash reports so that it could determine a statistical baseline to help designers develop more comprehensive and safe designs with regard to the management and handling of traffic during construction.
4.6.3 Does the agency conduct customer surveys to evaluate work zone traffic management practices and polices on a statewide/area-wide basis? Twenty-four agencies (46 percent) are using customer surveys to evaluate work zone performance. The average rating for this question decreased slightly from 2009 as a result of decreases in the average rating for nine agencies. Ratings for two agencies decreased below the implementation threshold from 2009 to 2010. Customer surveys provide qualitative information for agencies to use in evaluating their work zone operations. Agencies that mentioned doing surveys indicated they were often specific to a project or an outreach campaign, or were part of a larger State or agency survey efforts. Several agencies noted use of electronic resources such as websites to gather public input on programs and projects. Some agencies cited scaled back efforts due to budget constraints.
4.6.4 Does the agency develop strategies to improve work zone performance based on work zone performance data and customer surveys? Over half of agencies (54 percent) develop strategies to improve work zone performance based on work zone data and customer surveys. Having a process in place for how to make use of data collection efforts is an important part of the process. Agencies cited using information from work zone inspections, process reviews, and public and worker feedback mechanisms to make policy and practice improvements. One agency noted that its work zone policy establishes the practice that for any unusual delay or safety situation that develops on certain types of projects, the agency will mobilize an ad-hoc team that will visit the project site, discuss the issue, and make recommendations to project staff on how to lessen the identified problem. The agency said the team concept was used successfully in 2009 to address the issue of unexpected crashes that occurred on an Interstate project. One agency cited investigation of queues to determine the most appropriate techniques for managing them.
4 U.S. Census Bureau, Current Population Reports, "Population Change in Metropolitan and Micropolitan Statistical Areas: 1990-2003," P25-1134, by Paul J. Mackun, (Washington, DC: September 2005). [ Return to note 4. ]
5 U.S. Bureau of Economic Analysis, "Metropolitan Economic Growth Widespread in 2006 - 2006 and Revised 2004-2005 GDP-by-Metropolitan-Area Statistics," News Release BEA 08-44, Regional Economic Accounts web page, September 25, 2008. http://www.bea.gov/newsreleases/regional/gdp_metro/2008/gdp_metro0908.htm [ Return to note 5. ]
previous | next