Overview of Results
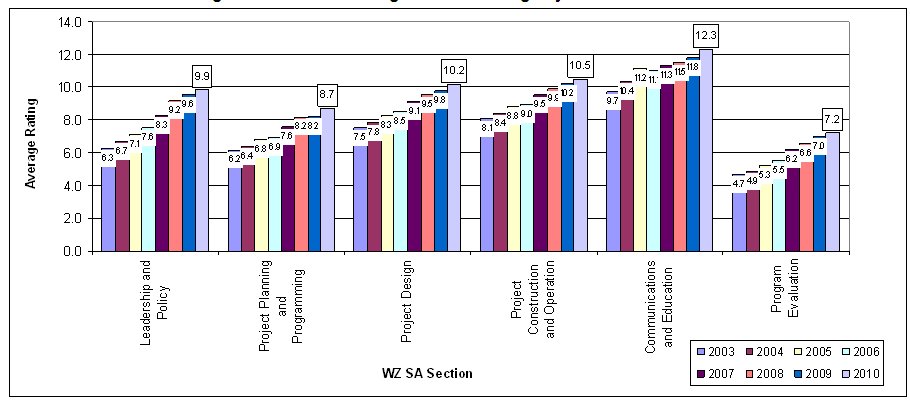
This section presents an overview of the combined results for the 52 Divisions/States that provided responses to the 2010 WZ SA. Results from the 2009 WZ SA are also included for comparative purposes. Table 1 shows the average ratings for each of the six sections in the WZ SA and compares the 2010 results with the 2009 average ratings.
| Section | # of Questions | 2009 | 2010 | Change1 | Percent Change |
|---|---|---|---|---|---|
| 1. Leadership and Policy | 10 | 9.6 | 9.9 | 0.3 | 3% |
| 2. Project Planning and Programming | 6 | 8.2 | 8.7 | 0.5 | 6% |
| 3. Project Design | 12 | 9.8 | 10.2 | 0.4 | 4% |
| 4. Project Construction and Operation | 9 | 10.2 | 10.5 | 0.3 | 3% |
| 5. Communications and Education | 5 | 11.8 | 12.3 | 0.5 | 5% |
| 6. Program Evaluation | 4 | 7 | 7.2 | 0.2 | 3% |
| Overall | 46 | 9.7 | 10 | 0.3 | 3% |
The data from Table 1 show that the highest average ratings were assigned to Section 5 (Communications and Education), followed by Section 4 (Project Construction and Operation) and Section 3 (Project Design). The lowest average rating was assigned to Section 6 (Program Evaluation). This is consistent with the results of the 2009 WZ SA and from previous years.
Between 2009 and 2010, Section 2 (Project Planning and Programming) had the highest average rating increase (6 percent), followed by Section 5 (Communications and Education) with a 5 percent increase.
The national average ratings for all six sections have consistently increased since the inception of the WZ SA, with the level of increase varying from section to section as shown in Figure 1. Starting in 2009, the average score for every section has been at or above the implementation threshold of seven – meaning that on average across the country, agencies are implementing the practices in all six sections of the assessment. In 2010, the scores for the Project Design section show that, on average, agencies have advanced from the implementation stage (score of 7 to 9) to assessing their performance (score of 10-12).2 As agencies have continued to strengthen and enhance their work zone practices, the average score has reached high levels on more questions and continued increases become more difficult. FHWA expects that increases in overall scores will occur more gradually going forward.
Figure 1. National Average Section Ratings by Year: 2003 to 2010
The questions showing the largest increases in score between 2009 and 2010 are:
- 4.3.12 When developing the Traffic Control Plan for a project, does the agency use computer modeling to assess Traffic Control Plan impacts on traffic flow characteristics such as speed, delay, and capacity for type I and II projects? (11 percent score increase)
- The 11 percent score increase (from 8.6 to 9.6) was due to increases in ratings by 24 agencies.
- The score for 4 agencies increased above 7, meaning they are now implementing this practice.
- Overall, 43 agencies (83 percent) are using modeling to assess the traffic control plan impacts on traffic flow for type I and II projects, up from 75 percent in 2009.
- 4.1.10 Has the agency established Memoranda of Understanding (MOU) between utility suppliers to promote the proactive coordination of long-range transportation plans with long-range utility plans, with the goal of reducing project delays and minimizing the number of work zones on the highway? (10 percent score increase)
- The 10 percent score increase (from 5.8 to 6.3) was due to increases in ratings by 12 agencies.
- This continues to be one of the lowest rated questions of the WZ SA, and is tied with two other questions for the lowest number of agencies who are implementing the activity.
- Overall, 24 agencies (46 percent) have established an MOU with utility suppliers to promote coordination, with the goal of reducing project delays and minimizing the number of work zones, up from 39 percent in 2009.
- 4.5.5 During type I, II, and III projects, does the agency use ITS technologies to collect and disseminate information to motorists and agency personnel on work zone conditions? (10 percent score increase)
- The 10 percent score increase (from 9.9 to 10.9) was due to increases for 22 agencies.
- The score for 7 agencies increased above the implementation threshold of 7.
- Overall, 48 agencies (92 percent) use ITS technologies to collect and disseminate information to motorists and agency personnel on work zone conditions, up from 80 percent in 2009.
The change in score for any WZ SA question may be due to a combination of reasons. These potential reasons include enhancements to State practices (perhaps as a result of findings from a previous WZ SA), FHWA's support to agencies in technical areas, enhanced processes for stakeholder input while filling out the WZ SA, added scrutiny of agency processes while filling out the WZ SA, and changes in personnel filling out the survey. Question-specific factors for score changes to each question are provided later in the section-by-section write-ups.
The following question was the highest rated question on the WZ SA in 2010, with an average rating of 13.2:
- 4.4.7 During type I, II, and III projects, does the agency use uniformed law enforcement?
- This question has consistently had the highest overall rating of any question in the WZ SA.
- The score indicates that the use of law enforcement in work zones is a well-established and assessed practice in many agencies.
- Ninety-six percent of agencies (50 agencies) are above the implementation threshold of 7 and use uniformed law enforcement on projects.
Three questions in the 2010 WZ SA showed minor decreases from the 2009 results:
- 4.6.3 Does the agency conduct customer surveys to evaluate work zone traffic management practices and policies on a statewide/area-wide basis?
- This question showed a 1.6 percent decrease from 6.4 in 2009 to 6.3 in 2010. This is the result of decreased scores in nine agencies. The number of agencies reaching the implementation threshold remained constant at 24 agencies.
- One agency noted that capturing specific work zone feedback through a customer survey would be difficult and a drain on resources. Two agencies noted that previous survey efforts are no longer underway and/or no longer contain work zone-related questions.
- 4.3.9 Does the agency have a process to assess projects for the use of positive separation devices for type I and II projects?
- This question showed a 1.3 percent decrease from 12.4 in 2009 to 12.2 in 2010. This is the result of decreased scores in three agencies, with one significant decrease. The number of agencies reaching the implementation threshold decreased from 49 in 2009 to 48 in 2010.
- One agency noted that while it uses positive protection, the agency does not have a set policy or process. Another agency noted that it will be starting training on this soon but does not currently follow a process.
- 4.1.9 Has the agency developed policies to support the use of innovative contracting strategies to reduce contract performance periods?
- This question showed a 0.6 percent decrease from 11.3 in 2009 to 11.2 in 2010. This is the result of slightly decreased scores in six agencies. While a small number of agencies' scores decreased slightly, the number of agencies reaching the implementation threshold actually increased from 47 to 50.
- Agencies who showed a slight decrease noted that they have some informal processes in place, but no formal criteria.
Most agencies reported an increase in their overall weighted WZ SA score between 2009 and 2010. The average score increased for 42 of 513 agencies (82 percent), decreased for 8 of 51 agencies (16 percent), and remained the same for 1 of 51 agencies (2 percent). Table 2 shows the changes in average agency scores from 2009 to 2010. These percentages are similar to those for the 2008 to 2009 period.
| Score Change | Agencies | Percent of Agencies |
|---|---|---|
| Increased by more than 10% | 6 | 12% |
| Increased 6% to 10% | 7 | 13% |
| Increased 1% to 5% | 29 | 57% |
| No Change | 1 | 2% |
| Decreased by less than 5% | 5 | 10% |
| Decreased by 5% or more | 3 | 6% |
| Total | 51 | 100% |
More than half of agencies had a small percentage increase in weighted score in 2010. The largest increase in average weighted score was 60 percent, while the largest decrease in average weighted score was 33 percent. These agencies had respective increases/decreases across a large number of questions, with large changes in score on some questions. The next highest overall percentage increase from 2009 to 2010 was 40 percent, with increases in score across nearly all of the questions. Factors that may contribute to large changes in score include further implementation of the Work Zone Rule, turnover in personnel completing the WZ SA, re-baselining of practices, FHWA promotion of good practices, and enhanced attention to agency process change relative to the topic areas in the WZ SA.
Agencies are seeing a growing positive impact on their practices as a result of the Rule, based on their responses to the five supplemental questions. The number of agencies citing a significant change increased for all five questions. The number of agencies that thought it was too early to tell if the Rule has had an impact has dropped on all five questions, with most of those agencies now indicating that a positive change has occurred.
1 Numbers in this table and other tables in this report may not calculate exactly due to rounding. Non-rounded values were used in these and other calculations throughout this report. [ Return to note 1. ]
2 See Appendix A for a description of the scoring for the WZ SA. [ Return to note 2. ]
3 In 2009, 51 agencies completed the WZ SA. All 52 agencies completed the WZ SA in 2010. [ Return to note 3. ]
previous | next