Detailed Results
This section presents the results of the 2009 WZ SA at a more detailed level. The results represent a compilation of scores and comments submitted from 51 Divisions/States. For each section of the WZ SA, the information includes:
- An explanation of the intent of the section,
- National average ratings for each question in the section and comparative data from the 2008 WZ SA, and
- The questions asked in that section with a question-by-question discussion of the scores, including the percentage of agencies implementing the practice asked about in the question (meaning they rated themselves at 7 or higher) and a summary of comments included by respondents in the results they submitted.
The section on results of the 2009 WZ SA supplemental questions includes a question-by-question discussion of the scores, including how many agencies have experienced a change as a result of the Rule.
Many respondents provided comments for some questions. The respondents that provided comments offer helpful examples of some of the specific practices and efforts being done to make work zones work better.
Another rich source of examples is the FHWA Work Zone Program website at https://www.fhwa.dot.gov/workzones. The website contains work zone publications, studies, links, training information, technical resources, and best practices, as well as examples of what agencies are doing to support implementation of the Rule. A series of guides published by FHWA to assist transportation agencies in implementing the Rule (23 CFR 630 Subpart J) contains many good examples of State DOT practices in use and provides references to helpful informational resources.
Since 2007, the WZ SA has included linkages, as applicable by question, to the appropriate sections of the Work Zone Rule. As agencies worked to implement the Work Zone Rule by the October 12, 2007 deadline and since, these efforts have affected the ratings in a positive way.
Leadership and Policy
Agency leadership support should drive overall policy making for the agency. This support fosters an environment conducive to developing an effective work zone program. Project planning, design, and construction and maintenance activities should all incorporate consideration of work zone safety and mobility impacts and mitigation strategies. Agency management should facilitate and encourage a multidisciplinary approach to traffic management throughout all phases in the life of a project. Senior managers should be personally, visibly, and proactively involved in efforts to enhance the safety of motorists and workers in work zones and minimize work zone delays.
Goals provide high-level direction and establish expectations for agency staff. Clear and specific goal statements such as "Reduce congestion and delay in work zones by 10% in 5 years" establish a basis on which to develop strategies and actions. Use of performance measures helps to assess progress toward fulfillment of a goal. For example, to track progress toward reduction of work zone delays, an agency may gather information regarding the total vehicle hours of delay for a sample of work zones and track these values over time.
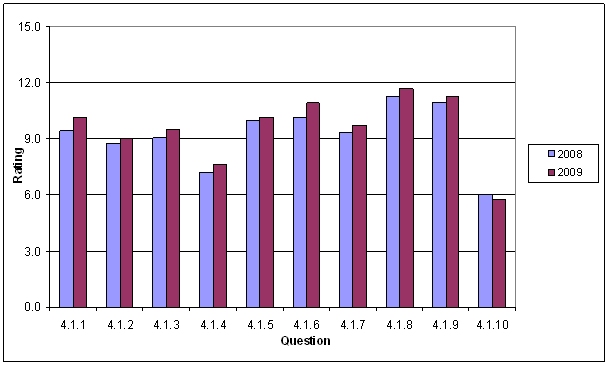
Figure 2 shows the average rating by question for 2008 and 2009 for the Leadership and Policy section. Table 3 shows the numeric ratings along with the percent change from 2008 to 2009 for each question.
Figure 2. Results for Leadership and Policy Section
| Section | 2008 | 2009 | Change | Percent Change |
|---|---|---|---|---|
| 4.1.1 | 9.4 | 10.2 | 0.8 | 8% |
| 4.1.2 | 8.8 | 9 | 0.2 | 3% |
| 4.1.3 | 9 | 9.5 | 0.5 | 5% |
| 4.1.4 | 7.2 | 7.6 | 0.4 | 6% |
| 4.1.5 | 10 | 10.1 | 0.2 | 2% |
| 4.1.6 | 10.2 | 10.9 | 0.8 | 8% |
| 4.1.7 | 9.3 | 9.7 | 0.4 | 4% |
| 4.1.8 | 11.2 | 11.7 | 0.5 | 4% |
| 4.1.9 | 10.9 | 11.3 | 0.3 | 3% |
| 4.1.10 | 6 | 5.8 | -0.2 | -4% |
The average ratings increased for most of the questions in this section. Questions 1 and 6 in this section saw the largest increases (8% each) from 2008 to 2009. Question 10 decreased slightly, and one agency noted that their 2008 score was too high and lowered it for 2009. All but question 10 had a national average score of 7.0 or greater, indicating that, on average, agencies are implementing the practices covered in this section.
4.1.1 Has the agency developed a process to determine whether a project is impact type I, II, III, or IV? Forty-six agencies (90%) have developed a process to determine the impact type of projects. The average score for this question had an 8% increase from 2008 to 2009. Several agencies cited use of a process to filter out significant projects without classifying all projects based on impact type I, II, III, or IV. One agency noted use of a checklist to classify projects using metrics such as project size, complexity, construction time, and anticipated traffic volume. The checklist results are then used to help practitioners understand the potential impacts at each stage of the project. Some agencies noted having fewer than four classification ratings but cited a similar process for separating projects based on their level of potential impact. One agency cited project cost as a key metric in determining whether it is significant ($5 million and higher cost). Seven more agencies scored themselves as implementing a process (score ≥ 7) to determine project type in 2009 compared with 2008.
4.1.2 Has the agency established strategic goals specifically to reduce congestion and delays in work zones? Almost three-fourths (73%) of the responding agencies indicated that they have strategic goals to reduce work zone congestion and delays. Some agencies have goals, while some are in the process of developing strategic goals. Several agencies commented on performance measures in response to this question. One agency noted that they expect to develop performance measures prior to goal development, which may not be as effective since metrics should be tied to strategic goals. Another agency noted use of a permitted lane closure chart for freeway applications, focusing on minimizing delay and congestion without citing a specific goal. In a reference to performance measures, one agency noted using a threshold of 30 minutes of delay to determine when additional mitigation strategies are needed including modified windows within which to perform work.
4.1.3 Has the agency established strategic goals specifically to reduce crashes in work zones? Out of 51 reporting agencies, over three-fourths of them (76%) have strategic goals specifically to reduce crashes in work zones. Similar to question 4.1.2, several agencies cited specific performance measures considered in relation to a strategic goal. One agency noted a goal of reducing worker injury rates but had not established goals for motorist safety. Another agency noted use of contract specifications to improve safety, such as for portable changeable message signs, lettering on signs, and impact attenuator use. The same agency cited a goal to reduce work zone fatalities by 10% from 2004 to 2010. One agency cited a more general goal of reducing roadway crashes in work zones. Several agencies referred to their policy on work zone safety and mobility that addresses reducing crashes in work zones. Guidance on goal setting and performance measure development may be helpful to some agencies in the future.
4.1.4 Has the agency established measures (e.g., vehicle throughput or queue length) to track work zone congestion and delay? Over half (57%) of the agencies are implementing measures to track work zone congestion and delay. The average score for this item increased from 7.2 to 7.6 (6%) between 2008 and 2009. While a smaller percentage compared with previous years, the increase continues a trend from previous years. One agency develops measures for congestion and delay for individual projects. Another agency noted that they are reviewing available data sources to determine if performance measures can be established. The same agency cited public interest in displaying delay messages for work zones in the field. Another agency did not cite specific performance measures in use, but referenced a specific mitigation policy of moving warning signs upstream of queues. This policy may more directly relate to mitigating safety impacts of work zones. One agency noted use of performance measures such as delay, while the thresholds of what is considered reasonable are still under development.
4.1.5 Has the agency established measures (e.g., crash rates) to track work zone crashes? Forty-two agencies (82%) have established measures to track work zone crashes. The responses to this question indicate that the main focus is on improving reporting for work zone crashes compared with analysis or measurement of crash rates. For example, a few agencies noted the addition of a "location" parameter to crash reporting forms that assist with capturing the location of the crash (advance warning area, transition area, etc.). One agency noted that while work zone crashes are tracked, better analysis procedures are needed to generate results that can help with measuring performance. One agency cited the use of a tool to evaluate work zone crash data that was developed as part of Strategic Highway Safety Plan activities. Another agency focuses on analyzing fatal crashes to determine improvements, while another agency cited analysis of crash data based on issues that are discovered on a project by project basis.
4.1.6 Has the agency established a policy for the development of Transportation Management Plans to reduce work zone congestion and crashes? Forty-eight agencies (94%) are implementing a policy for the development of Transportation Management Plans (TMPs) to reduce work zone congestion and crashes. Since TMPs are required for all Federal-aid highway projects, 100% of agencies should be implementing TMPs. Of the agencies that provided comments, a majority of them have a policy that includes development of TMPs for projects. Some agencies noted use of guidelines that structure the development of the TMP. One agency referred to their project cost threshold for significant projects, as TMPs are required for those projects. A few agencies are assessing their guidelines for TMPs and are providing training on the implementation of the guidelines and TMP development. One agency cited the use of demand management and other traffic operations strategies for an Interstate widening project. The 8% increase for this item is due to increased ratings from 21 agencies, and one agency crossed the implementation threshold (7 or higher) from 2008 to 2009.
4.1.7 Has the agency established work zone performance guidance that addresses maximum queue lengths, the number of open lanes, maximum traveler delay, etc.? Standards for work zone performance guidance have been established in 42 agencies (82%). Several agencies referred to use of a time period based permitted lane closure tool to display time periods to avoid due to the potential for unacceptable queues and delays. One agency noted that queuing and lane closure analysis is performed on a project level when incentive/disincentive contracts are used. Another agency sets a maximum queue length based on anticipated traffic volumes for project types I and II. The same agency cited temporary suspension of work activity as the primary result of unacceptable queues (4 miles or greater). Several agencies cited maximum delay as a primary metric used; 10 minutes, 12 minutes, and 30 minutes of delay are examples of maximum delay thresholds noted.
4.1.8 Has the agency established criteria to support the use of project execution strategies (e.g., night work, full closures) to reduce public exposure to work zones and reduce the duration of work zones? Forty-eight agencies (94%) have established criteria to support the use of project execution strategies. Several agencies noted use of strategies such as nighttime construction and full road closure, but did not mention specific criteria to support these decisions. One agency noted use of nighttime work routinely to avoid traffic impacts during daytime hours. Agencies may base their decision on use of such strategies on historical recurring and non-recurring congestion during peak daytime periods. One agency is collecting and analyzing data in order to establish project execution criteria and support decision-making. Some agencies cited the need for more formal guidelines on when to use such strategies.
4.1.9 Has the agency developed policies to support the use of innovative contracting strategies to reduce contract performance periods? Of 51 reporting agencies, 47 of them (92%) have developed policies to support the use of innovative contracting strategies to reduce contract performance periods. Adjusted for the number of reporting agencies in 2009, there was no change in the percentage of agencies that have reached the implementation threshold for use of innovative contracting strategies. Strategies used include A+B bidding, delayed start specifications, design-build and incentives/disincentives on major projects. One agency cited use of a new, emerging strategy titled Construction Manager at Risk. This strategy provides an additional option to the low bid strategy and defines a maximum guaranteed price for delivering the project. CM at Risk is different from low bid contracting in that it provides for a cost plus fixed fee contract with a maximum cost for the customer. Another agency noted use of value engineering to reduce construction time.
4.1.10 Has the agency established Memoranda of Understanding (MOU) between utility suppliers to promote the proactive coordination of long-range transportation plans with long-range utility plans, with the goal of reducing project delays and minimizing the number of work zones on the highway? Only 20 agencies (39%) have established an MOU between utility suppliers to promote the proactive coordination of long range transportation plans with long-range utility plans. This continues to be the lowest rated question within this section of the WZ SA. While most agencies do not have a formal MOU, several agencies have agreements and cooperative understandings in place with utility suppliers. One agency noted that utility providers have begun partnering with the state DOT to share information on upcoming projects and work to schedule and coordinate maintenance work. One agency provides incentives for utility suppliers to include specifics on their work in the transportation agency's construction contracts.
Project Planning and Programming
While transportation planning and implementation processes differ significantly from State to State, they all focus on developing increased capacity and efficiency in the transportation system. They do this by developing long-range transportation plans (LRTPs), transportation improvement program plans (TIPs), unified planning work programs (UPWPs), and in some cases congestion management system (CMS) plans.Transportation management and operations (M&O) processes are increasingly important to the planning professional. Metropolitan areas account for 83.5% of the nation's population2 and 90% of its economic output.3 They are centers for social as well as economic activity and are the hubs of the national transportation system. In addition, they are portals for people and freight moving between the United States and other countries. To meet the challenge of continued mobility, the planning community needs to take an active role in the development and implementation of transportation system M&O strategies.
The complexity of our transportation systems and the impact of congestion on our nation necessitate input from planners during the project development process in order to better assess and manage work zone impacts. The following are some example roles for planners:
- Using analytical traffic models to assess the system-wide impacts of specific project requirements.
- Evaluating programming estimates to ensure that the proper level of funding is included to mitigate traffic congestion and improve safety through work zones.
- Providing the critical "bridge" of knowledge between the planning world and the design world to reduce the impacts of work zones on the traveling public.
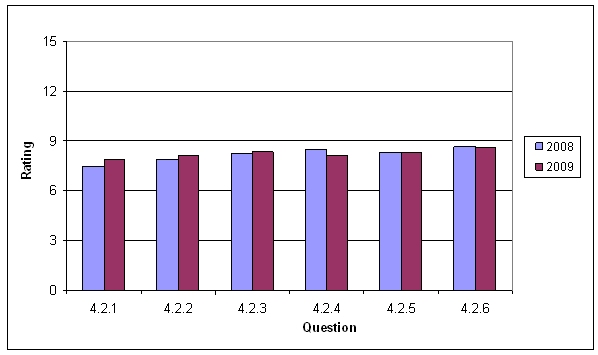
Figure 3 shows the average rating by question for 2008 and 2009 for the Project Planning and Programming section. Table 4 shows the numeric ratings along with the percent change in average rating from 2008 to 2009 for each question. The average ratings increased for half of the questions in this section. Question 5 remained the same and two questions showed a decline – question 4 decreased by 4% and question 6 decreased by 1%. The comments did not indicate why these decreases may have occurred. All the questions have scores at or above the implementation stage (score of 7 or higher), meaning on average agencies are implementing the practices addressed in this section.
Figure 3. Results for Project Planning and Programming Section
| Section | 2008 | 2009 | Change | Percent Change |
|---|---|---|---|---|
| 4.2.1 | 7.5 | 7.9 | 0.4 | 5% |
| 4.2.2 | 7.9 | 8.1 | 0.2 | 3% |
| 4.2.3 | 8.2 | 8.3 | 0.1 | 1% |
| 4.2.4 | 8.4 | 8.1 | -0.3 | -4% |
| 4.2.5 | 8.3 | 8.3 | 0 | 0% |
| 4.2.6 | 8.7 | 8.6 | -0.1 | -1% |
4.2.1 Does the agency's planning process actively use analytical traffic modeling programs to determine the impact of future type I and II road construction and maintenance activities on network performance? Over two-thirds (69%) of the agencies actively use analytical traffic modeling programs to determine the impact of future type I and II project activities. The average rating for this question increased by 5% from 2008. One agency uses a performance measurement system to assess freeway performance and identify operational weaknesses. The system utilizes data from detectors and helps decision makers estimate the effects of operational improvements. Agencies cited use of a fairly broad range of proprietary software applications, including PeMS, HCS, QuickZone, Paramics, VISSIM, NETSIM, WZCAT, and Synchro, for modeling construction impacts. Several agencies noted that use of analytical tools was fairly common on more complex projects.
4.2.2 Does the agency's planning process include developing alternative network options (e.g., frontage roads, increased capacity on parallel arterials, beltways, or strategically placed connectors) to maintain traffic volumes during future road construction and maintenance? Sixty-five percent (33) of the agencies reported using tools to determine alternate network options for traffic volumes that could be delayed due to road construction. One agency uses a process to upgrade alternate routes when higher volumes are expected to use these routes during major construction on adjacent facilities. Another agency makes an effort to maintain appropriate capacity through the construction area.
4.2.3 Does the agency's planning process manage the transportation improvement program to eliminate network congestion caused by poorly prioritized and uncoordinated execution of projects? Thirty-eight agencies (75%) indicated they make efforts during the planning process to manage the transportation improvement program to eliminate network congestion caused by poorly prioritized and uncoordinated execution of projects. One agency cited the use of a communications plan that allows districts to communicate information on upcoming projects on an annual basis. Several agencies referenced efforts to analyze local transportation improvement programs and statewide transportation improvement programs to determine potential conflicts with projects on major corridors.
4.2.4 Does the agency's transportation planning process include a planning cost estimate review for work types I, II, and III that accounts for traffic management costs (e.g., incident management, public information campaigns, positive separation elements, uniformed law enforcement, and Intelligent Transportation Systems [ITS])? Thirty-two agencies (63%) have a process for estimating traffic management costs during the transportation planning process. The average rating for this question decreased by 4% from 2008. Some agencies use this practice on type I and II projects, but not on type III projects. One agency noted that their cost estimate reviews are performed during the project scoping phase and are generally one-half to one percent of the overall project cost. The same agency said that traffic control costs are also included in this estimate. Another agency noted that ITS costs are incorporated into the construction contract if higher delays are expected during construction.
4.2.5 Does the agency's transportation planning process include the active involvement of planners during the project design stage to assist in the development of congestion mitigation strategies for type I and II projects? Planners assist in developing congestion mitigation strategies in 65% of reporting agencies. Agencies involve local planners (MPO representatives) in the process for State projects. Several agencies noted that planners are actively involved during the project design stage. One agency cited the need to involve statewide planning office representatives in project initiation (scoping).
4.2.6 Does the agency's transportation planning process engage planners as part of a multidisciplinary/multiagency team in the development of Transportation Management Plans involving major corridor improvements? For 37 of the responding agencies (73%), the transportation planning process engages planners as a part of a team in the development of TMPs. Planners and designers often meet during the development of the TMP. Some agencies cited the use of multidisciplinary and multiagency teams to review TMPs. One agency noted that major corridor studies include a qualitative assessment of alternatives at the planning stage that supports the future development of TMPs at the design stage.
Project Design
Project designers, working in concert with other functional experts, should consider work zone maintenance of traffic issues early in the design process. Designers should examine the use of different project execution strategies that can accelerate construction, thereby reducing construction time and minimizing the exposure of travelers to work zones. In addition, designers should actively lead the preparation of Transportation Management Plans (TMPs) that will mitigate the impact of work zone activities.
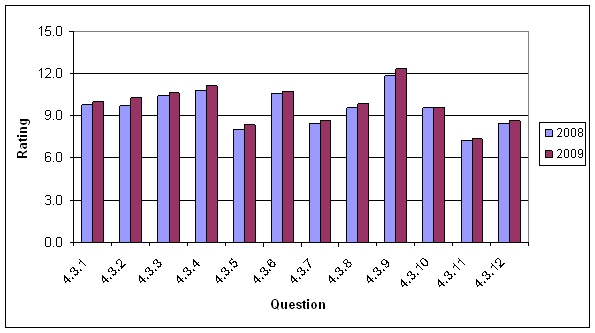
Figure 4 shows the average rating by question for 2008 and 2009 for the Project Design section. Table 5 shows the numeric ratings along with the percent change in average rating from 2008 to 2009 for each question. The average ratings increased for all but one of the questions in this section. Question 9 increased in 2009, after a decrease from 2007 to 2008. Only question 10 remained the same from 2008. All the questions are at or beyond the implementation stage (score of 7 or higher), meaning on average agencies are implementing the practices addressed in this section. Many agencies are now in the assessment phase (score of 10-12).
Figure 4. Results for Project Design Section
| Section | 2008 | 2009 | Change | Percent Change |
|---|---|---|---|---|
| 4.3.1 | 9.8 | 10 | 0.2 | 2% |
| 4.3.2 | 9.8 | 10.3 | 0.5 | 5% |
| 4.3.3 | 10.4 | 10.7 | 0.3 | 3% |
| 4.3.4 | 10.8 | 11.2 | 0.4 | 3% |
| 4.3.5 | 8 | 8.3 | 0.4 | 4% |
| 4.3.6 | 10.6 | 10.7 | 0.1 | 1% |
| 4.3.7 | 8.4 | 8.6 | 0.2 | 2% |
| 4.3.8 | 9.5 | 9.9 | 0.3 | 4% |
| 4.3.9 | 11.9 | 12.4 | 0.5 | 4% |
| 4.3.10 | 9.6 | 9.6 | 0 | 0% |
| 4.3.11 | 7.2 | 7.4 | 0.2 | 3% |
| 4.3.12 | 8.4 | 8.6 | 0.2 | 2% |
4.3.1 Does the agency have a process to estimate road user costs and use them to evaluate and select project strategies (full closure, night work, traffic management alternatives, detours, etc.) for type I and II projects? Forty-two agencies (82%) have a process to estimate road user costs. One agency cited use of the QUEWZ software to assist with the determination. The same agency noted that the results are combined with experience and historical knowledge to make decisions about the most appropriate strategies such as detours and nighttime construction. Some agencies noted that they have a process in place for estimating road user costs but either it is not used to determine types of project strategies or that some Districts choose not to use it (some use A+B bidding without a justification based on road user costs). One agency cited difficulties in comparing road user costs with other actual costs to justify decisions and investments based on benefits.
4.3.2 Does the agency develop a Transportation Management Plan that addresses all operational impacts focused on project congestion for type I and II projects? Forty-eight agencies (94%) develop a TMP that addresses all operational impacts focused on project congestion for type I and II projects. The Rule requires TMPs and it was anticipated that all 51 responding agencies would have achieved the implementation level. In 2008, 46 agencies (88 percent) had reached the implementation level, with 48 of 51 agencies reporting having reached this threshold in 2009. One of the agencies that assigned a rating less than 7 (the implementation threshold) cited that components of the TMP are addressed for projects.
4.3.3 Does the agency use multidisciplinary teams consisting of agency staff to develop Transportation Management Plans for type I and II projects? Forty-seven of the reporting agencies (92%) use multidisciplinary teams. These teams may consist of staff from planning, design, construction, operations, and other external stakeholders such as the public. In some cases, multidisciplinary teams are used primarily on high priority projects. One agency noted use of an approach that includes a variety of stakeholders including the public and elected officials. Another agency noted that construction and traffic engineering personnel have significant input into the process.
4.3.4 Does the agency perform constructability reviews that include project strategies to reduce congestion and traveler delays during construction and maintenance for type I and II projects? Out of the 51 responding agencies, 49 of them (96%) use constructability reviews on projects. This practice continues to have one of the highest implementation rates in the WZ SA. Agencies may only require constructability reviews for complex projects, or may decide to use them on a project-by-project basis. One agency performs constructability reviews after design, especially when incentive-based contracting is used. Another agency noted that constructability reviews are required on complex projects. One agency also noted that their Constructability Review Unit (CRU) performs reviews in-house on smaller projects and uses consultants for reviews on larger projects. An agency noted that reviews are focused on construction techniques to a larger extent than on traffic management issues.
4.3.5 Does the agency use independent contractors or contractor associations to provide construction process input to expedite project contract times for type I and II projects? Thirty-nine of the agencies (76%) use contractor associations to provide construction process input. One agency noted that this has been done on some projects, particularly design-build projects. Some agencies expressed concern over giving contractors advance knowledge of upcoming procurements and therefore do not use this process. One agency solicits input from the Associated General Contractors and a local university to improve the process.
4.3.6 Does the agency use scheduling techniques that are based on time and performance, such as the critical path method or parametric models, to determine contract performance times for type I and II projects? Forty-five agencies (88%) are using a technique to determine contract performance times for type I and II projects. Several agencies noted use of the critical path method during the construction phase to determine performance times. One agency cited use of several techniques, including a bar chart for lower cost projects (less than $10 million), and the critical path method for larger projects valued at more than $10 million. The scheduling requirements tend to increase as the cost of the project increases. One agency is planning to perform an assessment over two construction seasons to determine the effectiveness of project scheduling.
4.3.7 Does the agency have a process to evaluate the appropriate use of ITS technologies to minimize congestion in and around work zones for type I, II, and III projects? Thirty-nine of the agencies (76%) have a process to consider ITS technologies to minimize work zone congestion. Several agencies noted use of ITS, especially on significant projects. Agencies use stand-alone work zone ITS systems and also use existing, permanent ITS for monitoring and management. One agency noted efforts to increase use of dynamic merge systems to reduce rear-end collisions and aggressive driving. Another agency noted consideration of ITS during planning and design (when strategies are refined and readied for implementation).
4.3.8 Does the agency have a process to consider life-cycle costing when selecting materials that reduce the frequency and duration of work zones for type I, II, and III projects? Life-cycle costing is used by 41 agencies (80%) to reduce the frequency and duration of work zones. One agency cited the use of longer lasting pavements and striping on high volume roadways to reduce maintenance frequency. Another agency noted that life cycle cost analysis is used extensively in bridge and pavement design.
4.3.9 Does the agency have a process to assess projects for the use of positive separation devices for type I and II projects? Forty-nine agencies (96%) have a process to assess projects for the use of positive separation devices for type I and II projects. For example, an agency's positive separation process could include requiring the use of temporary concrete median barriers for major projects and on high speed facilities, and/or using shadow vehicles, moveable concrete barriers, and arrestor nets to provide positive protection. This question saw a 4% increase from 2008 after decreasing slightly on the previous WZ SA. Some agencies indicated that they set standards and specify that certain project types require positive separation devices. One agency has a checklist for use in determining when to use portable concrete barrier on projects. The score on this question is likely impacted by the Temporary Traffic Control Devices Rule (Subpart K) that was published by FHWA in December 2007 and had a compliance deadline of December 2008.
4.3.10 Does the agency anticipate and design projects to mitigate future congestion impacts of repair and maintenance for type I, II, and III projects? Forty-four agencies (86%) incorporate features into their project designs that accommodate the need for future repair and/or maintenance activities. One agency considers technology design and specifications, such as convenient access to permanent message boards and location of fiber optic lines to avoid the need for future lane closures. Another agency cited consideration such as wide shoulders for pull off areas and future maintenance work, and sign positioning that lessens future impacts during inspection and maintenance. Other examples include design of additional lanes and full depth shoulders.
4.3.11 When developing the Traffic Control Plan for a project, does the agency involve contractors in developing the Traffic Control Plan for type I and II projects? Contractors are involved with the development of traffic control plans in 31 agencies (61%). Often, contractors are used informally during constructability reviews or may be consulted during the design stage if needed. Additionally, agencies allow contractors to submit ideas for or revisions to the traffic control plan. One agency noted that, due to possible conflicts of interest in the bidding process, contractors are not consulted during the development of the plan for significant projects. However, their modifications/suggestions are considered during the construction phase. Often, subcontractors are hired to handle traffic control for the project, but plans are often developed during the design stages prior to involvement of the subcontractor (design-build projects are one exception).
4.3.12 When developing the Traffic Control Plan for a project, does the agency use computer modeling to assess Traffic Control Plan impacts on traffic flow characteristics such as speed, delay, and capacity for type I and II projects? Thirty-eight of the 51 responding agencies (75%) implement computer modeling in the development of traffic control plans. Some agencies use this computer modeling on a project-by-project basis (potentially for larger projects when higher impacts are anticipated) or on occasion to evaluate the potential impacts. Agencies reported using software such as QuickZone, Corsim, Synchro, VISSIM, TREX, COSMIX, CA4PRS, and WZCAT for analyzing impacts. Several agencies noted use of data on demand relative to capacity to help determine allowable hours for lane closures.
Project Construction and Operation
A roadway construction or maintenance site can be a very complex orchestration of activities affecting the public in many ways. There are many pieces to the project delivery process and everyone has a critical role, but what the public mostly sees and experiences is the construction end of the process. The use of letting strategies, quality-based contractor selection, time-sensitive bidding, efficient operations, traffic management, aggressive contract management, and good public information, can help agencies improve the execution and public perception of transportation improvements.
Complaints from the traveling public often focus on the proper use and maintenance of traffic control devices such as cones, drums, signs, barricades, barriers, striping, and changeable message signs. Some common problems include signs that inform travelers of conditions that do not exist, striping that is misleading, changeable signs that show the wrong message, and cones and drums that are improperly spaced. These inconsistencies have an impact on agency credibility with the traveling public. Drivers develop work zone habits that are based on past observations. Agencies can require and provide incentives for work zone contractor personnel to be trained in the proper application and maintenance of traffic control devices in work zones.
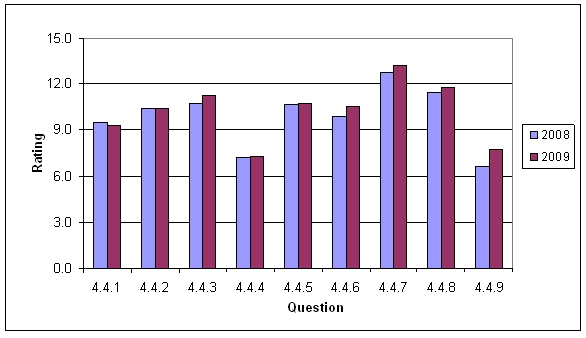
Figure 5 shows the average rating by question for 2008 and 2009 for the Project Construction and Operation section. Table 6 shows the numeric ratings along with the percent change in average rating from 2008 to 2009 for each question. Overall, this section had the second highest average rating of the six sections. The average ratings increased for most of the questions in this section with question 2 remaining the same and question 1 decreasing by 2%. All the questions are at or beyond the implementation stage (score of 7 or higher), meaning on average agencies are implementing the practices addressed in this section.
The average score for question 9 saw a significant increase this year (17%) and crossed the implementation threshold for the first time. For this year, question 9 included a wording change that revised the question to include situations where the agency does not directly train law enforcement personnel but does require that law enforcement personnel receive proper work zone training elsewhere – clarifying that the focus of this question is on the training itself. The reworded question may have allowed agencies to improve their understanding of the intent of the question. The increase on this question continues the increase from previous years. Two other reasons for the continued major increase may be the earlier publication by FHWA of a work zone law enforcement course that can be used by DOTs to train law enforcement, and the Rule provision that specifies that DOTs require that personnel in work zone enforcement be adequately trained. Additionally, in 2008 FHWA began offering the FHWA-developed work zone law enforcement course through its Work Zone Safety Grant with The American Traffic Safety Services Association (ATSSA).
Figure 5. Results for Project Construction and Operation Section
| Section | 2008 | 2009 | Change | Percent Change |
|---|---|---|---|---|
| 4.4.1 | 9.5 | 9.3 | -0.2 | -2% |
| 4.4.2 | 10.3 | 10.4 | 0 | 0% |
| 4.4.3 | 10.8 | 11.3 | 0.5 | 5% |
| 4.4.4 | 7.2 | 7.3 | 0.1 | 1% |
| 4.4.5 | 10.7 | 10.8 | 0.1 | 1% |
| 4.4.6 | 9.9 | 10.5 | 0.6 | 6% |
| 4.4.7 | 12.8 | 13.2 | 0.4 | 3% |
| 4.4.8 | 11.5 | 11.8 | 0.3 | 3% |
| 4.4.9 | 6.6 | 7.8 | 1.1 | 17% |
4.4.1 Is the letting schedule altered or optimized to reflect the available resources and capabilities of the construction industry? Thirty-nine agencies (76%) alter or optimize their letting schedule based on contractor resources and capabilities. Letting schedules are often driven by fiscal process constraints. One agency stated that they will only let projects if they believe there will be adequate competition and adequate industry resources for completing the work. One agency noted that they let projects during the winter before a construction season so that contractors can plan accordingly. One agency performs an evaluation of industry capabilities and resources to determine an appropriate letting schedule.
4.4.2 Is the letting schedule altered or optimized to minimize disruptions to major traffic corridors? Ninety-two percent of the agencies (47 of 51 agencies) are minimizing disruptions on major traffic corridors by optimizing the letting schedule. Projects are reviewed to make sure that multiple projects do not adversely impact traffic along certain corridors. One agency noted that development of TMPs has helped the agency focus on processes and techniques such as altering letting schedules to avoid major impacts. Another agency noted that time constraints tied to availability of funding did not allow for alteration of letting schedules.
4.4.3 When bidding type I and II projects, does the agency include road user costs in establishing incentives or disincentives (e.g., I/D, A+B, or lane rental) to minimize road user delay caused by work zones? Ninety percent of the agencies (46 agencies) include road user costs in establishing incentives/disincentives (I/D) to minimize road user delay in work zones. Some examples of the strategies used by agencies include A+B bidding, lane rental, I/D, and the use of modeling to determine the effects of construction on traffic. One agency noted that disincentives used in nighttime construction contracts are calculated based on road user costs. Another agency cited use of a technique similar to lane rental to limit the length of time for closures and keep peak hour traffic impacts to a minimum. A few agencies said they include road user costs but do not have a formalized process for determining or setting such costs.
4.4.4 When bidding type I, II, and III projects, does the agency use performance-based selection to eliminate contractors who consistently demonstrate their inability to complete a quality job within the contract time? Thirty of the responding agencies (59%) use performance-based selection to eliminate contractors that regularly have difficulty completing quality jobs on-time, an increase of two agencies using this practice compared with the results from 2008. One agency noted that past performance is a criterion for selecting a contractor when using design-build or construction manager at risk methods. One agency has a rating system but it is not used to disqualify contractors or to assist with award decisions.
4.4.5 When bidding type I and II project contracts, does the agency use incident management services (e.g., wreckers, push vehicles, and service patrols)? Incident management services such as wreckers, courtesy patrols, and off-duty highway patrol officers are used by 46 agencies (90%). Several agencies noted use of incident management services for Type I and II projects, especially in major metropolitan areas. Due to the common presence of incident management services in cities, urban freeway work zones benefit from services that are provided on a routine basis without the work zone in place. Several agencies cited use of incident management services directly as part of a construction contract.
4.4.6 In bidding contracts, does the agency use flexible starting provisions after the Notice to Proceed is issued? More than three-fourths of responding agencies (82%) routinely use flexible starting provisions after the Notice to Proceed (NTP) is issued. One agency noted that contractors are allowed to specify the start date for a project, as long as it is completed within a specific time period. An example would be completion prior to the end of a season for a paving project. Another agency noted that all projects have some flexibility between award and notice to proceed. The same agency said that the NTP is normally within 45 days of award, however the NTP may be extended in instances where a winter shutdown date occurs during or immediately after the 45 day window to have the contractor begin work after that winter shutdown period.
4.4.7 During type I, II, and III projects, does the agency use uniformed law enforcement? Ninety-six percent of the agencies (49 agencies) use uniformed law enforcement on projects. This question continues to have the highest overall rating of any question in the WZ SA, indicating that the use of law enforcement in work zones is a well-established and assessed practice in many agencies. Typical law enforcement roles include providing enhanced visibility during installation/removal of work zone traffic control; presence as a deterrent to speeding; and active enforcement. In some cases officers may also assist with traffic control. Some agencies use law enforcement personnel on a project-by-project basis. One agency determines when to use law enforcement personnel in work zones based on the facility type (mainly limited access highways). A few agencies noted that use of law enforcement personnel is a pay item in construction contracts. Additionally, automated speed enforcement is used in several states and may require an officer to be present.
4.4.8 Does the agency provide/require training of contractor staff on the proper layout and use of traffic control devices? Nearly all reporting agencies (90%) indicated that they provide and/or require training of contractor staff on proper use of traffic control devices. Several agencies cited focus on this area because of the provisions in the Rule. Additionally, some agencies cited use of training provided by ATSSA chapters and Local Technical Assistance Programs (LTAP). Another agency requires certification for flaggers, and is working on a requirement for traffic control supervisors. FHWA is sponsoring training courses through the Work Zone Safety Grants Program that provide many agencies with training at a substantially reduced cost. One agency requires personnel to be knowledgeable on proper setup of traffic control devices but does not require a specific type of training.
4.4.9 Does the agency provide training to uniformed law enforcement personnel on work zone devices and layouts or ensure law enforcement personnel receive proper training elsewhere? Thirty-three (65%) of the responding agencies provide training to uniformed law enforcement. Six more agencies have reached the implementation threshold for this question in 2009 compared with 2008. The average score for this question increase by 17% from 2008 to 2009. This increase represents the largest percentage increase for all questions in the WZ SA. Some agencies currently use the FHWA Work Zone law enforcement training course and have partnered with their FHWA Division Office to offer the course statewide. One agency used the FHWA course as a starting point and developed a state-specific version. Some agencies have dedicated law enforcement personnel for work zones and provide enhanced training for this group. Further implementation of the provisions within the Rule by agencies likely contributed to moving the average score above the implementation threshold (6.6 to 7.8) for the first time.
Communications and Education
To reduce public anxiety and frustration regarding work zones, it is important to sustain effective communications and outreach with the public about road construction and maintenance activity, and the potential impacts of the activities. This also increases the public's awareness of such activity. Lack of information is often cited as a key cause of frustration for the traveling public; therefore, the agency should identify and consider key issues from a public outreach and information perspective.
Figure 6 shows the average rating by question for 2008 and 2009 for the Communications and Education section. Table 7 shows the numeric ratings along with the percent change in average rating from 2008 to 2009 for each question. The average ratings increased for all of the questions in this section except question 5 which remained the same. The scores in this section have consistently been among the highest in the WZ SA and remain so this year. Many agencies are now in the assessment phase (scores of 10-12).
Figure 6. Results for Communications and Education Section
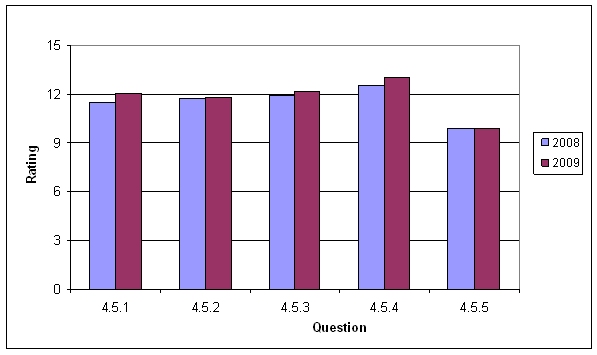
| Section | 2008 | 2009 | Change | Percent Change |
|---|---|---|---|---|
| 4.5.1 | 11.4 | 12.1 | 0.6 | 5% |
| 4.5.2 | 11.7 | 11.8 | 0.1 | 1% |
| 4.5.3 | 11.9 | 12.2 | 0.2 | 2% |
| 4.5.4 | 12.6 | 13 | 0.4 | 4% |
| 4.5.5 | 9.9 | 9.9 | 0 | 0% |
4.5.1 Does the agency maintain and update a work zone website providing timely and relevant traveler impact information for project types I, II, and III that allows travelers to effectively make travel plans? Forty-seven agencies (92%) implement a website to provide traveler impact information on projects to allow travelers to make more effective travel plans. One agency has a website that includes a traffic map and information on work zone activity statewide. The same agency also uses project websites to provide information for major projects. Some agencies update information on their websites on a daily basis, while others are designed to provide up to the minute traveler information for projects.
4.5.2 Does the agency sponsor National Work Zone Awareness week? Most agencies (86%) sponsor National Work Zone Awareness week. Some agencies have no formal campaign but still support the program while others have planned activities throughout the week. One agency hosts an annual memorial during National Work Zone Awareness Week in honor of workers who have died in work zones. Examples of other activities include holding press conferences, displaying the national memorial, and holding work zone safety awareness conferences.
4.5.3 Does the agency assume a proactive role in work zone educational efforts? Forty-eight agencies (94%) are developing educational materials to inform and educate the public on work zone safety. This question was the fourth highest scoring on the WZ SA. Most agencies that provided comments cited the use of educational efforts such as public service announcements and other marketing strategies including some use of social networking (e.g., Twitter). Some agencies have contracts with marketing firms and the radio industry to help promote work zone safety and reduce aggressive driving through work zones by providing safety tips, statistics, and general information on work zones.
4.5.4 During type I, II, and III project construction, does the agency use a public information plan that provides specific and timely project information to the traveling public through a variety of outreach techniques (e.g., agency website, newsletters, public meetings, radio, and other media outlets)? This practice is being implemented by all 51 reporting agencies, giving it the highest implementation rate in the WZ SA. All agencies use a public information plan to provide specific and timely project information to the traveling public through a variety of outreach techniques. Some of these techniques include publishing information on the agency's web site and providing information to media outlets. Other techniques include highway advisory radio messages, public relations managers, radio, TV, newspaper ads, telephone hotlines, and public information centers. This question remains the second highest scoring question on the WZ SA, indicating that the use of public information plans is widespread and is a well-established practice.
4.5.5 During type I, II, and III projects, does the agency use ITS technologies to collect and disseminate information to motorists and agency personnel on work zone conditions? Forty-one agencies (80%) use ITS technologies to collect and disseminate work zone information. This question had a decrease in the number of agencies implementing this practice (4 fewer agencies in 2009 compared with 2008), while the average rating did not change from 2008 to 2009. Many agencies use more basic systems, including portable changeable message signs to give the traveling public specific and timely project information and Highway Advisory Radio (HAR). Of the agencies who use ITS, several noted that use is on a project by project basis depending on need. One agency noted that use of ITS is currently being expanded to projects in rural areas as well.
Program Evaluation
Evaluation is necessary to identify successes and analyze failures. Work zone performance monitoring and reporting at a nationwide level can increase the knowledge base on work zones and help lead to the development of better tools to help agencies better plan, design, and implement road construction and maintenance projects. At the local level, performance monitoring and reporting provides an agency with valuable information on the effectiveness of congestion mitigation strategies, contractor performance, and work zone safety.
Figure 7 shows the average rating by question for 2008 and 2009 for the Program Evaluation section. Table 8 shows the numeric ratings along with the percent change in average rating from 2008 to 2009 for each question. The average ratings increased for all questions in this section. Question 1 (collecting data to track congestion and delay) with a 13% increase from 2008 and question 2 (collecting data to track work zone safety performance) with a 9% increase had the second and third largest increases of all questions in the WZ SA. However, the questions in this section remain among the lowest rated questions in the WZ SA.
Figure 7. Results for Program Evaluation Section
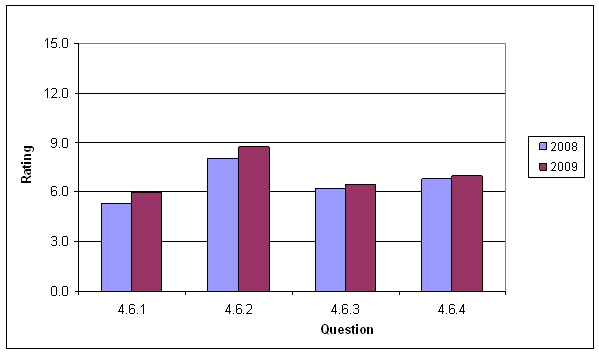
| Section | 2008 | 2009 | Change | Percent Change |
|---|---|---|---|---|
| 4.6.1 | 5.3 | 6 | 0.7 | 13% |
| 4.6.2 | 8.1 | 8.7 | 0.7 | 9% |
| 4.6.3 | 6.2 | 6.4 | 0.3 | 4% |
| 4.6.4 | 6.8 | 7 | 0.2 | 3% |
4.6.1 Does the agency collect data to track work zone congestion and delay performance in accordance with agency-established measures? (See Section 1, item 4.1.4) Less than half of responding agencies collect data to track work zone congestion and delay performance against agency measures. Although this question had the second lowest average score in the WZ SA, it had the second largest percent increase (13%) in the WZ SA and had the highest percent increase for this section. Thus it appears that more agencies are moving toward using data to track work zone congestion and delay. One agency stated that they have developed a policy and identified the need, but that performance measures still need to be established. Another agency noted that they will begin collecting congestion and delay information this year. One agency noted that they collect speed, volume, and occupancy data (the three common sources provided by wireless sensors), and they are determining how to use the data to calculate delay and queue length.
4.6.2 Does the agency collect data to track work zone safety performance in accordance with agency-established measures? (See Section 1, item 4.1.5) Thirty-three agencies (65%) are collecting data to track work zone safety performance. This question had a relatively large percentage increase (9%) over 2008. One agency noted that they plan to track work zone fatalities on a three year average statewide. Another agency cited a similar process, but noted that the data is not tied to performance measures due to some issues with accuracy and determining whether the fatality occurred within the work zone or downstream and outside the work zone. One agency collects work zone crash data and senior managers track the statistics. Several agencies noted that they need to establish measures for tracking purposes.
4.6.3 Does the agency conduct customer surveys to evaluate work zone traffic management practices and polices on a statewide/area-wide basis? Twenty-four agencies (47%) are using customer surveys to evaluate work zone performance. Agencies provide various opportunities for feedback on ways to improve work zones. Customer surveys are used in most cases. Customer surveys are often part of Context Sensitive Solutions practices in planning for and designing projects. One agency noted that the comments section of their website is available and used to solicit open public input on practices. Another agency is considering using customer satisfaction surveys as a tool to improve performance and to solicit input on programs and strategies. One agency asks the public to rate work zone practices on an "A to F" grading scale.
4.6.4 Does the agency develop strategies to improve work zone performance based on work zone performance data and customer surveys? Over half of agencies (59%) develop strategies to improve work zone performance based on work zone data and customer surveys. One agency is developing a process for collecting, tracking, and monitoring work zone site information along with responses to customer surveys in order to develop a set of performance measures. The same agency noted that additional research into performance measures for work zone strategies is needed. One agency noted an informal review process occurs, where a team visits project sites with known issues and, after discussion, provides recommendations to the project team.
2 U.S. Census (http://www.census.gov/Press-Release/www/releases/archives/population/011671.html)
3 Bureau of Economic Analysis (http://www.bea.gov/newsreleases/regional/gdp_metro/2008/gdp_metro0908.htm)
previous | next