Overview of Results
This section presents an overview of the combined results for the 51 Divisions/States that provided responses to the 2009 WZ SA. Results from the 2008 WZ SA are also included for comparative purposes. Table 1 shows the average ratings for each of the six sections in the WZ SA and compares the 2009 results with the 2008 average ratings.
| Section | # of Questions | 2008 | 2009 | Change1 | Percent Change |
|---|---|---|---|---|---|
| 1. Leadership and Policy | 10 | 9.2 | 9.6 | 0.4 | 4% |
| 2. Project Planning and Programming | 6 | 8.2 | 8.2 | 0.1 | 1% |
| 3. Project Design | 12 | 9.5 | 9.8 | 0.3 | 3% |
| 4. Project Construction and Operation | 9 | 9.9 | 10.2 | 0.3 | 3% |
| 5. Communications and Education | 5 | 11.5 | 11.8 | 0.3 | 2% |
| 6. Program Evaluation | 4 | 6.6 | 7 | 0.4 | 7% |
| Overall | 46 | 9.4 | 9.7 | 0.3 | 3% |
Between 2008 and 2009, Section 6 (Program Evaluation) had the highest average rating increase (7%), followed by Section 1 (Leadership and Policy) with a 4% increase. The percentage increases are lower than those experienced from 2007 to 2008, which were between 4% and 11% for all sections except Section 5.
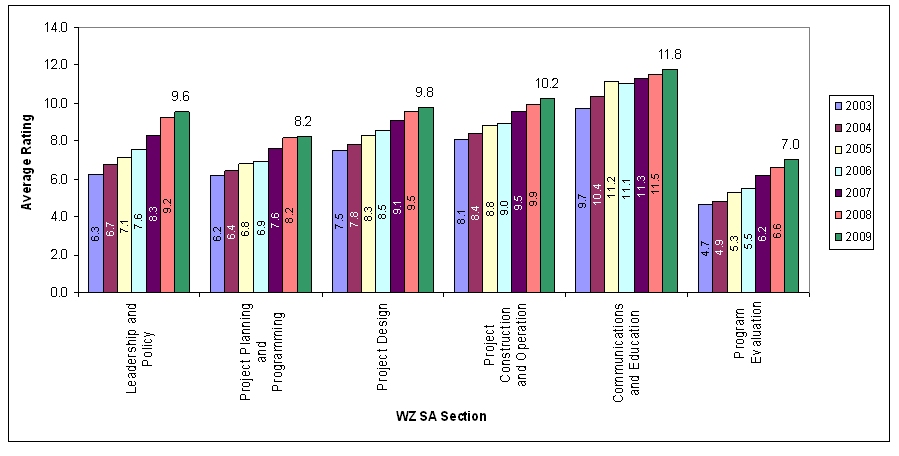
The National average ratings for all six sections have consistently increased since the inception of the WZ SA, with the level of increase varying from section to section as shown in Figure 1. This is the first year when the average score for every one of the six sections was at or above the implementation threshold of 7 – meaning that on average across the country, agencies are implementing the practices in all six sections of the assessment. As agencies have continued to strengthen and enhance their work zone practices, the average score has reached high levels on more questions and continued increases become more difficult. FHWA expects that going forward increases in overall scores will occur more gradually.
Figure 1. National Average Section Ratings by Year: 2003 to
2009
The questions showing the largest increases in score between 2008 and 2009 are:
- 4.4.9 Does the agency provide training to uniformed law
enforcement personnel on work zone devices and layouts or ensure law
enforcement personnel receive proper training elsewhere? (17% increase)
- Thirty-three (65%) of the responding agencies provide training to uniformed law enforcement or otherwise ensure they receive training, up from 52% in 2008. In 2009, the average rating crossed the implementation threshold of 7.
- The continued increase in the number of agencies providing this training is likely a result of the expanded training requirement in the updated Work Zone Safety and Mobility Rule (the Rule), and the 23 CFR 630 Subpart K requirement for agencies to have a policy on the use of law enforcement.
- This score may also have increased due to a wording change in the question that broadened the range of sources that might provide training to law enforcement personnel.
- 4.6.1 Does the agency collect data to track work zone congestion
and delay performance in accordance with agency-established measures?
(13% increase)
- Twenty-two (43%) of the responding agencies collect data to track work zone congestion and delay performance in accordance with agency-established measures.
- While this question has had one of the lowest scores in the past two years it is also had one of the largest increases, indicating that agencies are increasingly moving towards using data to track work zone congestion and delay. This is likely due in part to the increased emphasis on the use of data and the addition of operational data in the updates to the Rule.
- This question also may have increased as a result of the recent and current promotional activities underway at FHWA in the area of performance measurement.
- 4.6.2 Does the agency collect data to track work zone safety
performance in accordance with agency-established measures? (9% increase)
- Thirty-three agencies are collecting data to track work zone safety performance.
- The increase in score is a result of large increases in scores for three agencies.
- A number of agencies are still struggling with data accuracy and determining causality, however, more agencies are beginning to collect data each year.
- This question may have increased as a result of the recent and current promotional activities underway at FHWA in the area of performance measurement and the increased emphasis on the use of data in the updates to the Rule.
In addition to the question-specific reasons mentioned above, the change in score for any survey question may be due to a combination of reasons. These potential reasons include enhancements to State practices (perhaps based on the results of a previous survey), FHWA’s support to agencies in technical areas, enhanced processes for stakeholder input while filling out the surveys, added scrutiny of agency processes while filling out the survey, and changes in personnel filling out the survey. Question-specific factors for score changes to each question are listed in the section-by-section write-ups.
The following question was the highest rated question on the WZ SA in 2009, with an average rating of 13.2:
- During type I, II, and III projects, does the agency use
uniformed law enforcement?
- Ninety-six percent of the agencies (49 agencies) use uniformed law enforcement on projects.
- This question has consistently had the highest overall rating of any question in the WZ SA, indicating that the use of law enforcement in work zones is a well-established and assessed practice in many agencies.
Four questions in the 2009 WZ SA showed a decrease from the 2008 results:
- 4.2.4 Does the agency's transportation planning process
include a planning cost estimate review for work types I, II, and
III that accounts for traffic management costs (e.g., incident management,
public information campaigns, positive separation elements, uniformed
law enforcement, and Intelligent Transportation Systems [ITS])?
- This question showed a 4% decrease from 8.4 in 2008 to 8.1 in 2009. This is the result of decreased scores in seven agencies. The number of agencies reaching the implementation threshold dropped from 34 agencies to 32 agencies.
- The comments provided by each agency did not clearly identify trends as to why the score decreased.
- 4.1.10 Has the agency established Memoranda of Understanding
(MOU) between utility suppliers to promote the proactive coordination
of long-range transportation plans with long-range utility plans,
with the goal of reducing project delays and minimizing the number
of work zones on the highway?
- This question showed a 4% decrease from 6.0 in 2008 to 5.8 in 2009. It was the lowest rated question in the WZ SA in 2009. This is the result of decreased scores in seven agencies. The number of agencies reaching the implementation threshold remained constant at 20 agencies.
- One agency noted that they had planned to establish an MOU but due to staff changes this was not completed. The comments provided by the other agencies did not clearly identify trends as to why the score decreased.
- 4.4.1 Is the letting schedule altered or optimized to reflect
the available resources and capabilities of the construction industry?
- This question showed a small decrease (2%) from 9.5 in 2008 to 9.3 in 2009. This is the result of decreased scores in five agencies. The number of agencies reaching the implementation threshold dropped from 42 agencies to 39 agencies.
- The comments provided by each agency did not clearly identify trends as to why the score decreased.
- 4.2.6 Does the agency's transportation planning process
engage planners as part of a multidisciplinary/multiagency team in
the development of Transportation Management Plans involving major
corridor improvements?
- This question showed a slight decrease (1%) from 8.7 in 2008 to 8.6 in 2009. This is the result of decreased scores in eight agencies. While a number of agencies scores decreased, the number of agencies reaching the implementation threshold actually increased from 36 agencies to 37 agencies.
- The comments provided by each agency did not clearly identify trends as to why the score decreased.
Decreased scores for these questions were likely based on an enhanced evaluation that led stakeholders to conclude that a previous year rating was too high.
Most agencies reported an increase in their overall WZ SA score between 2008 and 2009. The average score increased for 41 of 51 agencies (80%), decreased for 9 of 51 agencies (18%), and remained the same for 1 of 51 agencies (2%). These percentages continue a similar trend from 2007 to 2008. Table 2 shows the changes in average agency scores from 2008 to 2009.
| Score Change | Agencies | Percent of Agencies |
|---|---|---|
| Increased by more than 10% | 5 | 10% |
| Increased 6% to 10% | 9 | 17% |
| Increased 1% to 5% | 27 | 53% |
| No Change | 1 | 2% |
| Decreased by less than 5% | 5 | 10% |
| Decreased by 5% or more | 4 | 8% |
| Total | 51 | 100% |
One of the biggest changes between 2008 and 2009 is that more agencies are seeing an impact from the Rule, based on the responses to the supplemental questions. A majority of agencies have experienced some positive changes in their practices as a result of the Rule. Thirty-six agencies (71%) reported either a significant change (5 agencies) or some change (31 agencies) in enhanced consideration and management of work zone safety and mobility impacts, starting during planning and continuing though project completion. The number of agencies that thought it was too early to tell if the Rule has had an impact has dropped on all five of the supplemental questions, with most of those agencies now indicating that a positive change has occurred.
1 Numbers in this table and other tables in this report may not calculate exactly due to rounding. Non-rounded values were used in these and other calculations throughout this report. E.g., For Section 2, the change from 2008 (8.17) to 2009 (8.23) is .06, which rounds to 0.1.
previous | next