Detailed Results
This section presents the results of the 2008 WZ SA at a more detailed level. The results represent a compilation of scores and comments submitted from all 52 Divisions/States. For each section of the WZ SA, the information includes:
- An explanation of the intent of the section,
- The questions asked in that section,
- National average ratings for each question and comparative data from the 2007 WZ SA, and
- A question-by-question discussion of the scores, including the percentage of agencies implementing the practice asked about in the question (meaning they rated themselves at 7 or higher) and a summary of comments included by respondents in the results they submitted.
The section on results of the 2008 WZ SA supplemental questions includes:
- A question-by-question discussion of the scores, including the percentage of agencies who responded that the Rule has caused change, the Rule has not caused change, and that it is too early to tell.
Many responders provided comments for some questions. The responders that provided comments offer helpful examples of some of the specific practices and efforts being done to make work zones work better.
Another rich source of examples is the series of implementation guides published by FHWA to assist transportation agencies in implementing the Work Zone Rule (23 CFR 630 Subpart J). The Guides contain many good examples of State DOT practices in use and provide references to helpful informational resources. The Guides include an overall implementation guide, "Implementing the Rule on Work Zone Safety and Mobility, " and three companion technical guides: "Work Zone Public Information and Outreach Strategies," "Developing and Implementing Transportation Management Plans for Work Zones," and "Work Zone Impacts Assessment: An Approach to Assess and Manage Work Zone Safety and Mobility Impacts of Road Projects." The Guides, as well as other information on the Work Zone Rule, are available from the FHWA Work Zone Program website at http://www.ops.fhwa.dot.gov/wz/resources/final_rule.htm. The website also contains a list of work zone publications, studies, links, training resources, and examples of what agencies are doing to support implementation of the Work Zone Rule.
Since 2007, the WZ SA has included linkages, as applicable by question, to the appropriate sections of the Work Zone Rule. As agencies worked to implement the Work Zone Rule by the October 12, 2007 deadline, these efforts have affected the ratings in a positive way. Ratings for next year may begin to flatten out as more agencies are above the implementation threshold of 7.0 for many of the questions in the WZ SA.
Leadership and Policy
Agency leadership support should drive overall policy making for the agency. This support fosters an environment conducive to developing an effective work zone program. Project planning, design, and construction and maintenance activities should all incorporate consideration of work zone safety and mobility impacts and mitigation strategies. Agency management should facilitate and encourage a multidisciplinary approach to traffic management throughout all phases in the life of a project. Senior managers should be personally, visibly, and proactively involved in efforts to enhance the safety of motorists and workers in work zones and minimize work zone delays.
Goals provide high-level direction and establish expectations for agency staff. Clear and specific goal statements such as "Reduce congestion and delay in work zones by 10% in 5 years" establish a basis on which to develop strategies and actions. Use of performance measures helps to assess progress toward fulfillment of a goal. For example, to track progress toward reduction of work zone delays, an agency may gather information regarding the total vehicle hours of delay for a sample of work zones and track these values over time.
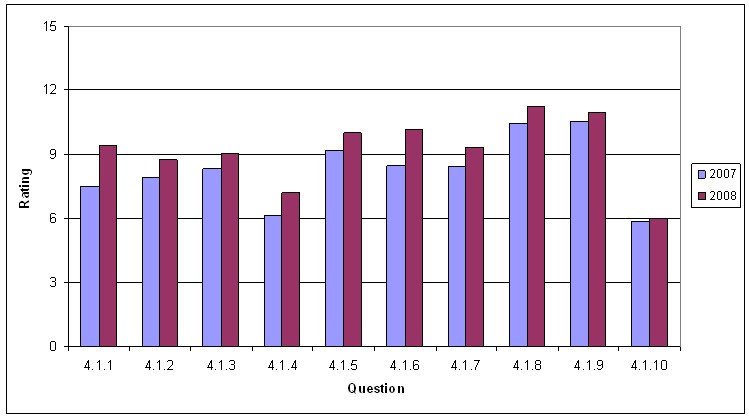
Figure 2 shows the average rating by question for 2007 and 2008 for the Leadership and Policy section. Table 5 shows the numeric ratings along with the percent change from 2007 to 2008 for each question. The average ratings increased for all of the questions in this section. For 2008, all but one of the questions had a national average score of 7.0 or greater, indicating that, on average, agencies are implementing the practices covered in this section. The one question with an average score below 7.0 (question 10) had the lowest percentage increase in this section (3%) from 2007 to 2008. Question 4, which addresses the establishment of work zone mobility measures was below 7.0 in 2007 but rose to 7.2 in 2008.
Figure 2. Results for Leadership and Policy Section
| Section | 2007 | 2008 | Change | Percent Change |
|---|---|---|---|---|
| 4.1.1 | 7.5 | 9.4 | 1.9 | 25% |
| 4.1.2 | 7.9 | 8.8 | 0.8 | 10% |
| 4.1.3 | 8.3 | 9 | 0.7 | 9% |
| 4.1.4 | 6.2 | 7.2 | 1 | 17% |
| 4.1.5 | 9.2 | 10 | 0.8 | 9% |
| 4.1.6 | 8.5 | 10.2 | 1.7 | 20% |
| 4.1.7 | 8.4 | 9.3 | 0.9 | 11% |
| 4.1.8 | 10.4 | 11.2 | 0.8 | 8% |
| 4.1.9 | 10.5 | 10.9 | 0.4 | 4% |
| 4.1.10 | 5.8 | 6 | 0.2 | 3% |
Questions 1, 6, and 4 in this section increased substantially (25%, 20%, and 17% respectively) from 2007 to 2008. The ratings for some questions likely increased due to the October 2007 deadline for compliance with the Work Zone Rule. This is particularly likely for Question 1, which relates to the Work Zone Rule requirement to define and identify "significant projects", and Question 6, which relates directly to the Work Zone Rule requirement to develop Transportation Management Plans (TMPs) to reduce the work zone impacts of projects.
4.1.1 Has the agency developed a process to determine whether a project is impact type I, II, III, or IV? Thirty-nine agencies (75%) of the agencies have developed a process to determine the impact type of projects. The average score for this question had the largest percent increase (25%) in the WZ SA. These processes are located in a standard policy or sometimes done as an informal process during the construction phase. A number of agencies have processes in place to determine significant or non-significant projects, but not all are determining impact type. One agency noted that they have a process in place that identifies significant and non-significant projects using a project cost threshold as the basis for determination. The 25% increase in score for this question was due to small increases by many agencies and larger increases by a few agencies.
4.1.2 Has the agency established strategic goals specifically to reduce congestion and delays in work zones? Over two-thirds (69%) of the responding agencies indicated that they have strategic goals to reduce work zone congestion and delays. Goals to reduce congestion and delays in work zones are supported by practices such as the use of QuickZone (a queue analysis spreadsheet tool for work zones), ITS technologies, and lane closure policies that minimize closures during peak periods. Several agencies noted that draft policies are in place to help them focus on reducing congestion and delay. Some agencies focus on reducing congestion and delay but have not developed specific strategic goals. One agency noted that it has identified three goals related to congestion and delay in work zones: to enhance the movement of people and products throughout the state; to optimize the quality, timeliness, and cost effectiveness of their products and services; and to use innovative and creative techniques to optimize the use of all resources.
4.1.3 Has the agency established strategic goals specifically to reduce crashes in work zones? Out of 52 reporting agencies, over two-thirds of them (69%) have strategic goals specifically to reduce crashes in work zones. Several cited use of strategies designed to reduce crashes in work zones but without a formal strategic goal. One agency noted three strategies related to work zones that support the safety goal: reduce worker exposure through improved traffic control in work zones; use the latest technology to enhance work zone safety; and lead a multi-organizational initiative to improve driver behavior within work zones. Another agency cited a goal for a reduction in all work zone crashes of 10%, and a Strategic Highway Safety Plan (SHSP) goal to reduce fatal work zone crashes as part of an overall goal to reduce statewide fatal crashes by 100 by 2010.
4.1.4 Has the agency established measures (e.g., vehicle throughput or queue length) to track work zone congestion and delay? Over half (56%) of the agencies are implementing measures to track work zone congestion and delay. The average score for this item increased from 6.2 to 7.2 (17%) between 2007 and 2008. The increase continues a trend from the previous three years. The number of agencies that have reached the implementation threshold for establishing congestion and delay performance measures increased from 23 to 29 (a 26% increase). This result indicates that a number of agencies are placing more emphasis on this area. Queue length and travel time variability are the most common measures used to track work zone delay, and some agencies use real-time data collection to measure conditions and provide traveler information on selected projects. One agency noted that they have delay thresholds set for corridors that are managed on a project-by-project basis.
4.1.5 Has the agency established measures (e.g., crash rates) to track work zone crashes? Forty-one agencies (79%) have established measures to track work zone crashes. Several agencies reported use of crash databases and crash reporting and archiving systems. Some agencies noted the difficulty interpreting data received from their crash report forms with regard to determining whether crashes were in the work zone itself and if they were caused by the presence of the work zone or by the traffic control setup. To alleviate this issue, one agency added a work zone field to the State crash report form so that officers can highlight if the crash occurred in a work zone. Another agency noted that all fatal crashes are reviewed by a multi-disciplinary team.
4.1.6 Has the agency established a policy for the development of Transportation Management Plans to reduce work zone congestion and crashes? Forty-seven agencies (90%) are implementing a policy for the development of Transportation Management Plans (TMPs) to reduce work zone congestion and crashes. The average score for this item increased by 20% in both 2007 and 2008, which is likely due to the October 2007 compliance date of the Work Zone Rule, which requires TMPs for all projects. Several agencies noted that the TMP process has become an integral part of their development process. The significant overall increase for this item is due to increased ratings from 31 agencies, with several agencies showing large increases.
4.1.7 Has the agency established work zone performance guidance that addresses maximum queue lengths, the number of open lanes, maximum traveler delay, etc.? Standards for work zone performance guidance have been established in 42 agencies (81%). Some agencies noted that performance measures are used at the project level to help determine times when lane closures are permitted. One agency noted that as part of their Work Zone Safety and Mobility policy for trunkline projects they have maximum delay goals related to additional travel time delay (10 minutes) caused by a work zone. Another agency noted that it has work zone performance guidance on the number of lanes to be open and is in the process of collecting data to establish performance guidelines that address maximum queue lengths and maximum traveler delays.4.1.8 Has the agency established criteria to support the use of project execution strategies (e.g., nightwork, full closures) to reduce public exposure to work zones and reduce the duration of work zones? Forty-eight agencies (92%) have established criteria to support the use of project execution strategies. Many agencies reported wide use of nighttime construction, especially on the Interstate system and in high traffic volume locations. One agency noted that night work is done on a regular basis. That agency compares overall delay for the project against instantaneous delay, in combination with construction costs and inconvenience to motorists and businesses, to determine whether innovative scheduling is more advantageous than night work. One agency noted the use of full closures on weekends or low volume times.
4.1.9 Has the agency developed policies to support the use of innovative contracting strategies to reduce contract performance periods? Of 52 reporting agencies, 48 of them (92%) have developed policies to support the use of innovative contracting strategies to reduce contract performance periods. Strategies used include A+B bidding, design-build and incentives/disincentives on major projects. A couple of agencies noted the use of lane rental procedures. Two agencies noted legislative and contracting regulation limitations in the use of certain strategies. One agency has implemented a construction-level value engineering program to promote innovation. Another agency said that they use delayed start specifications. The delayed start specifications allow the contractor to get critical submittals approved before starting work. The agency noted that a typical delayed start is 55 days after contract approval.
4.1.10 Has the agency established Memoranda of Understanding (MOU) between utility suppliers to promote the proactive coordination of long-range transportation plans with long-range utility plans, with the goal of reducing project delays and minimizing the number of work zones on the highway? Only 20 agencies (38%) have established an MOU between utility suppliers to promote the proactive coordination of long range transportation plans with long-range utility plans. While most agencies do not have a formal MOU, several agencies have agreements and cooperative understandings in place with utility suppliers. One agency noted that utility providers have begun partnering with the state DOT to share information on upcoming projects and work to schedule and coordinate maintenance work. Several agencies noted that they make efforts to coordinate utility work and construction projects. One agency noted that they coordinate with utility companies to include utility work in ongoing construction projects and then restrict utility work for five years at those locations.
Project Planning and Programming
While transportation planning and implementation processes differ significantly from State to State, they all focus on developing increased capacity and efficiency in the transportation system. They do this by developing long-range transportation plans (LRTPs), transportation improvement program plans (TIPs), unified planning work programs (UPWPs), and in some cases congestion management system (CMS) plans.
Transportation management and operations (M&O) processes are increasingly important to the planning professional. Metropolitan areas account for 83.5% of the nation's population2 and 90% of its economic output.3 They are centers for social as well as economic activity and are the hubs of the national transportation system. In addition, they are portals for people and freight moving between the United States and other countries. To meet the challenge of continued mobility, the planning community needs to take an active role in the development and implementation of transportation system M&O strategies.
The complexity of our transportation systems and the impact of congestion on our nation necessitate input from planners during the project development process in order to better assess and manage work zone impacts. The following are some example roles for planners:
- Using analytical traffic models to assess the system-wide impacts of specific project requirements.
- Evaluating programming estimates to ensure that the proper level of funding is included to mitigate traffic congestion and improve safety through work zones.
- Providing the critical "bridge" of knowledge between the planning world and the design world to reduce the impacts of work zones on the traveling public.
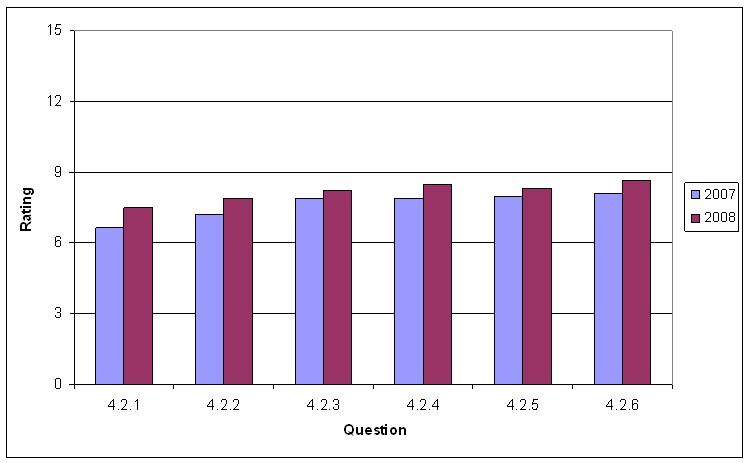
Figure 3 shows the average rating by question for 2007 and 2008 for the Project Planning and Programming section. Table 6 shows the numeric ratings along with the percent change in average rating from 2007 to 2008 for each question. The average ratings increased for all six questions. While the national average score for the question regarding the use of analytical modeling tools remained lower than the other questions in this section it is now above the implementation threshold and showed the largest average rating increase (12%) for this section.
Figure 3. Results for Project Planning and Programming Section
| Section | 2007 | 2008 | Change | Percent Change |
|---|---|---|---|---|
| 4.2.1 | 6.7 | 7.5 | 0.8 | 12% |
| 4.2.2 | 7.2 | 7.9 | 0.7 | 9% |
| 4.2.3 | 7.9 | 8.2 | 0.3 | 4% |
| 4.2.4 | 7.9 | 8.4 | 0.6 | 7% |
| 4.2.5 | 8 | 8.3 | 0.3 | 4% |
| 4.2.6 | 8.1 | 8.7 | 0.6 | 8% |
4.2.1 Does the agency's planning process actively use analytical traffic modeling programs to determine the impact of future type I and II road construction and maintenance activities on network performance? Almost two-thirds (63%) of the agencies actively use analytical traffic modeling programs to determine the impact of future type I and II project activities. The average rating for this question in 2008 increased by 12%. One agency uses modeling tools to identify weaknesses on highway segments and to develop estimates of the effects of operational improvements. Agencies cited use of a fairly broad range of proprietary software applications, including PeMS, QuickZone, Paramics, VISSIM, NETSIM, WZCAT, and Synchro, for modeling construction impacts.
4.2.2 Does the agency's planning process include developing alternative network options (e.g., frontage roads, increased capacity on parallel arterials, beltways, or strategically placed connectors) to maintain traffic volumes during future road construction and maintenance? Sixty-two percent of the agencies reported using tools to determine alternate network options for traffic volumes that could be delayed due to road construction. Corridor-level analysis can help identify alternative network options. One agency noted that in order to ensure that temporary detours are properly designed to provide adequate vehicular capacity for several construction phases of a project, they analyze the surrounding network to determine the best mitigation strategies, such as rerouting traffic onto parallel facilities. Some agencies noted that budget constraints prevent this from becoming a reality.
4.2.3 Does the agency's planning process manage the transportation improvement program to eliminate network congestion caused by poorly prioritized and uncoordinated execution of projects? Thirty-six agencies (69%) indicated they make efforts during the planning process to manage the transportation improvement program to eliminate network congestion caused by poorly prioritized and uncoordinated execution of projects. One agency cited the development of a TIP integration process where projects going into the TIP from each agency are discussed to look for synergy. Another agency provides a traveler information map to contractors to help coordinate projects. One agency noted that funding availability is normally the driving force and this can override efforts to better prioritize and coordinate projects.
4.2.4 Does the agency's transportation planning process include a planning cost estimate review for work types I, II, and III that accounts for traffic management costs (e.g., incident management, public information campaigns, positive separation elements, uniformed law enforcement, and intelligent transportation systems [ITS])? Thirty-four agencies (65%) have a process for estimating traffic management costs during the transportation planning process. Some agencies do this on type I and II projects, but not on type III projects. One agency noted that their cost estimating guidelines have recently been revised to include all disciplines in developing construction estimates for projects early on at the planning/programming phase as well as through the design phase. This increased coordination is resulting in more comprehensive estimates that capture all of the potential costs associated with each project. Another agency noted that they include line items for these types of strategies with every project having a prospectus.
4.2.5 Does the agency's transportation planning process include the active involvement of planners during the project design stage to assist in the development of congestion mitigation strategies for type I and II projects? Planners assist in developing congestion mitigation strategies in 67% of reporting agencies. Strategies can be developed from the early design phase, with designers, field personnel, and other partners working with planners. Agencies also involve local planners (MPO representatives) in the process for State projects. One agency noted that planners are involved during the project design stage and also serve on the Work Zone Committee. Another agency noted that planners are engaged at the concept level but not at a detailed level.
4.2.6 Does the agency's transportation planning process engage planners as part of a multi-disciplinary/multi-agency team in the development of Transportation Management Plans involving major corridor improvements? For 69% of the responding agencies, the transportation planning process engages planners as a part of a team in the development of Transportation Management Plans (TMPs). Planners and designers often meet during the development of the TMP. Some agencies cited the use of multi-disciplinary and multi-agency teams to review TMPs. One agency noted the use of TMP committees but the committees do not necessarily include planners. Another agency noted that planners are not engaged in the development of TMPs because the planning process and programming of projects at their agency are not combined.
Project Design
Project designers, working in concert with other functional experts, should consider work zone maintenance of traffic issues early in the design process. Designers should examine the use of different project execution strategies that can accelerate construction, thereby reducing construction time and minimizing the exposure of travelers to work zones. In addition, designers should actively lead the preparation of Transportation Management Plans, including Traffic Control Plans that will mitigate the impact of work zone activities.
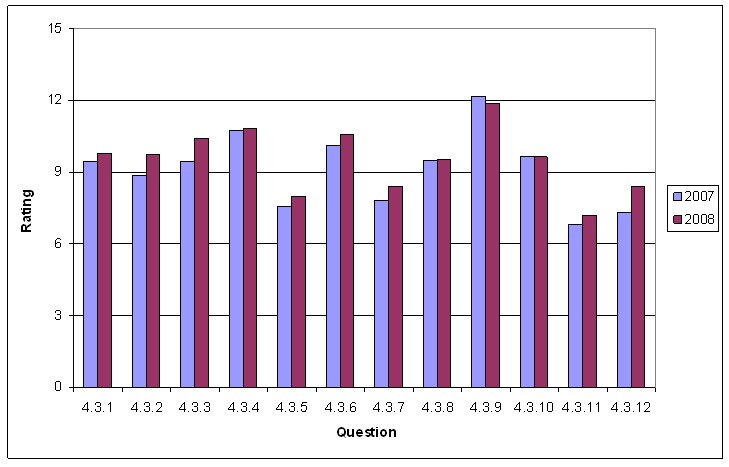
Figure 4 shows the average rating by question for 2007 and 2008 for the Project Design section. Table 7 shows the numeric ratings along with the percent change in average rating from 2007 to 2008 for each question. The average ratings increased from 2007 to 2008 for most of the questions, however, two questions (questions 8 and 10) saw no increase and question 9 saw a 3% decrease from 2007. The reduction for question 9 is due to decreases in scores for five agencies, with three dropping five points or more.
Figure 4. Results for Project Design Section
| Section | 2007 | 2008 | Change | Percent Change |
|---|---|---|---|---|
| 4.3.1 | 9.5 | 9.8 | 0.3 | 3% |
| 4.3.2 | 8.8 | 9.8 | 0.9 | 10% |
| 4.3.3 | 9.4 | 10.4 | 1 | 10% |
| 4.3.4 | 10.7 | 10.8 | 0.1 | 1% |
| 4.3.5 | 7.5 | 8 | 0.4 | 6% |
| 4.3.6 | 10.1 | 10.6 | 0.5 | 5% |
| 4.3.7 | 7.8 | 8.4 | 0.6 | 8% |
| 4.3.8 | 9.5 | 9.5 | 0 | 0% |
| 4.3.9 | 12.2 | 11.9 | -0.3 | -3% |
| 4.3.10 | 9.6 | 9.6 | 0 | 0% |
| 4.3.11 | 6.8 | 7.2 | 0.4 | 6% |
| 4.3.12 | 7.3 | 8.4 | 1.1 | 15% |
4.3.1 Does the agency have a process to estimate road user costs and use them to evaluate and select project strategies (full closure, night work, traffic management alternatives, detours, etc.) for type I and II projects? Forty-three agencies (83%) have a process to estimate road user costs. One agency noted the use of the guide for the Quewz software package to determine lane closures and to give the department delay based data to help determine strategies. Another agency noted that they have developed a lane closure guide and user delay process that is now operational. Some agencies noted that they have a process in place for estimating road user costs but either it is not used to determine types of project strategies or that some Districts choose not to use it.
4.3.2 Does the agency develop a Transportation Management Plan that addresses all operational impacts focused on project congestion for type I and II projects? Forty-six agencies (88%) develop a Transportation Management Plan (TMP) that addresses all operational impacts focused on project congestion for type I and II projects. The Work Zone Rule required TMPs and it was anticipated that all 52 agencies would have achieved the implementation level by 2008. In 2007 38 agencies (73 percent) had reached the implementation level so we do see an increase. During 2008 all 52 agencies should be at the implementation level.
4.3.3 Does the agency use multi-disciplinary teams consisting of agency staff to develop Transportation Management Plans for type I and II projects? Forty-six of the reporting agencies (88%) use multidisciplinary teams. These teams may consist of staff from planning, design, construction, operations, and other external stakeholders such as the public. In some cases, multidisciplinary teams are used primarily on high priority projects. One agency noted that they have coordination between traffic operations, planning, construction, design, public affairs, and project management through their project development structure. Another agency noted that they have an in-house core team and then bring in additional partners (like MPOs) on larger-scale projects.
4.3.4 Does the agency perform constructability reviews that include project strategies to reduce congestion and traveler delays during construction and maintenance for type I and II projects? Out of the 52 responding agencies, 50 of them (96%) use constructability reviews on projects. This practice has one of the highest implementation rates in the WZ SA. Agencies may only require constructability reviews for complex projects, or may decide to use them on a project-by-project basis. One agency performs constructability reviews on select small to medium projects and administers consulting engineering services to perform constructability reviews on larger projects. Another agency noted that the process is used on appropriate projects but their staff is limited.
4.3.5 Does the agency use independent contractors or contractor associations to provide construction process input to expedite project contract time for type I and II projects? Thirty-eight of the agencies (73%) use contractor associations to provide construction process input. This practice is often executed primarily on complex projects and also on design-build projects. One agency noted that this has been done on some projects, particularly design-build projects. Some agencies expressed concern over giving contractors advance knowledge of upcoming procurements and therefore do not use this process.
4.3.6 Does the agency use scheduling techniques that are based on time and performance, such as the critical path method or parametric models, to determine contract performance times for type I and II projects? Forty-five agencies (87%) are using a technique to determine contract performance times for type I and II projects. Several agencies noted use of the critical path method during the construction phase to determine performance times. One agency cited that their contracts and proposals department uses the bar chart method prior to letting. Another agency noted that construction schedules are required on all projects.
4.3.7 Does the agency have a process to evaluate the appropriate use of intelligent transportation system (ITS) technologies to minimize congestion in and around work zones for type I, II, and III projects? Thirty-eight of the agencies (73%) consider ITS technologies to minimize work zone congestion. Agencies use stand-alone work zone ITS systems and also use existing, permanent ITS for monitoring and management. Several agencies cited the use of ITS on significant projects and some are beginning to incorporate ITS strategies on a more routine basis. One agency noted that they use ITS in and around major work zones. They then gather feedback from the field in order to evaluate the effectiveness of various strategies for future use.
4.3.8 Does the agency use life-cycle costing when selecting materials to reduce the frequency and duration of work zones for type I, II, and III projects? Life-cycle costing is used by 41 agencies (79%) to reduce the frequency and duration of work zones. One agency cited the use of longer lasting pavements and pre-cast materials to reduce the frequency of work zones and the duration of work. Another agency noted examples of replacing three-beam median with concrete and using steel guardrail posts.
4.3.9 Does the agency have a process to assess projects for the use of positive separation devices for type I and II projects? Forty-nine agencies (94%) have a process to assess projects for the use of positive separation devices for type I and II projects. Some agencies set standards and specify that certain project types require positive separation devices. An agency may require the use of temporary concrete median barriers for major projects and on high speed facilities. Agencies may also use shadow vehicles, moveable concrete barriers, and arrestor nets to provide positive protection. One agency noted that this is included as part of the design process of projects. Positive separation devices (e.g. temporary concrete barrier) are used when necessary on projects when there's limited space. Question 9 saw a 3% decrease from 2007. The reduction is due to decreases in scores for five agencies, with three agencies dropping five points or more.
4.3.10 Does the agency anticipate and design projects to mitigate future congestion impacts of repair and maintenance for type I, II, and III projects? Forty-six agencies (88%) incorporate features into their project designs that accommodate the need for future repair and/or maintenance activities. One agency noted that they will often build additional lanes or full depth shoulders during construction which can be used during later repairs. Another agency noted that it has various policies in place - wider bridges and full depth shoulders - depending on the roadway classification. Some agencies noted that this can practice can be limited due to budget constraints.
4.3.11 When developing the Traffic Control Plan for a project, does the agency involve contractors on type I and II projects? Contractors are involved with the development of traffic control plans in 31 agencies (60%). Often, contractors are used informally during constructability reviews or may be consulted during the design stage if needed. Additionally, agencies allow contractors to submit ideas for or revisions to the traffic control plan. One agency noted that while contractors are not consulted during the development of the plan for significant projects, their modifications/suggestions are considered during the construction phase.
4.3.12 When developing the Traffic Control Plan for a project, does the agency use computer modeling to assess Traffic Control Plan impacts on traffic flow characteristics such as speed, delay, and capacity for type I and II projects? Thirty-eight of the 52 responding agencies (73%) implement computer modeling in the development of traffic control plans. Some agencies use this computer modeling on a project-by-project basis (potentially for larger projects when higher impacts are anticipated) or on occasion to evaluate the potential impacts. Agencies reported using QuickZone, Corsim, VISSIM, and WZCAT for analyzing impacts. Simple capacity calculations are often used in conjunction with traffic volume data to estimate impacts for a project, network, or corridor.
Project Construction and Operation
A roadway construction or maintenance site can be a very complex orchestration of activities affecting the public in many ways. There are many pieces to the project delivery process and everyone has a critical role, but what the public mostly sees and experiences is the construction end of the process. The use of letting strategies, quality-based contractor selection, time-sensitive bidding, efficient operations, traffic management, aggressive contract management, and good public information, can help agencies improve the execution and public perception of transportation improvements.
Complaints from the traveling public often focus on the proper use and maintenance of traffic control devices such as cones, drums, signs, barricades, barriers, striping, and changeable message signs. Some common problems include signs that inform travelers of conditions that do not exist, striping that is misleading, changeable signs that show the wrong message, and cones and drums that are improperly spaced. These inconsistencies have an impact on agency credibility with the traveling public. Drivers develop work zone habits that are based on past observations. Agencies can require and provide incentives for work zone contractor personnel to be trained in the proper application and maintenance of traffic control devices in work zones.
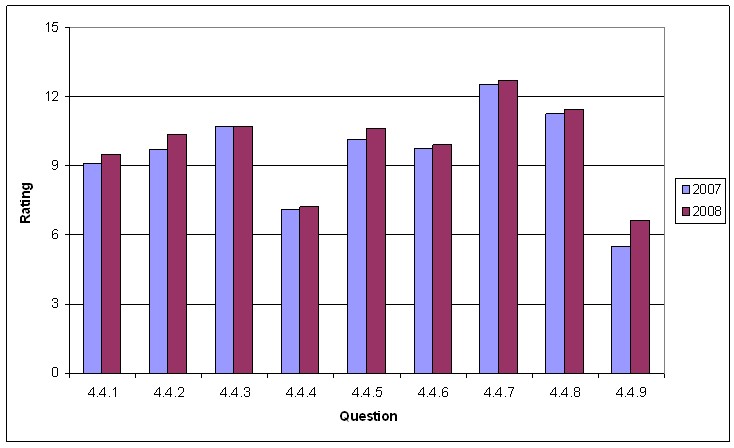
Figure 5 shows the average rating by question for 2007 and 2008 for the Project Construction and Operation section. Table 8 shows the numeric ratings along with the percent change in average rating from 2007 to 2008 for each question. Overall, this section had the second highest average rating of the six sections. The average ratings increased for all of the questions in this section. All the questions except question 9 have reached the implementation stage (score of 7 or higher), meaning on average agencies are generally implementing the practices addressed in this section.
The average score for question 9 continues to be significantly lower than the scores for other questions in this section; however, question 9 showed a 21% increase for both 2007 and 2008. Question 9 addresses training for law enforcement. As in 2007, two likely reasons for the continued major increase are the publication by FHWA of a work zone law enforcement course that can be used by DOTs to train law enforcement, and the Work Zone Rule provision that specifies that DOTs require that personnel in work zone enforcement be adequately trained. Additionally, in 2008 FHWA began offering the FHWA-developed work zone law enforcement course through its Work Zone Safety Grant with The American Traffic Safety Services Association (ATSSA).
Figure 5. Results for Project Construction and Operation Section
| Section | 2007 | 2008 | Change | Percent Change |
|---|---|---|---|---|
| 4.4.1 | 9.1 | 9.5 | 0.4 | 5% |
| 4.4.2 | 9.8 | 10.3 | 0.6 | 6% |
| 4.4.3 | 10.7 | 10.8 | 0 | 0% |
| 4.4.4 | 7.1 | 7.2 | 0.1 | 2% |
| 4.4.5 | 10.1 | 10.7 | 0.5 | 5% |
| 4.4.6 | 9.8 | 9.9 | 0.1 | 1% |
| 4.4.7 | 12.6 | 12.8 | 0.2 | 2% |
| 4.4.8 | 11.3 | 11.5 | 0.2 | 2% |
| 4.4.9 | 5.5 | 6.6 | 1.1 | 21% |
4.4.1 Is the letting schedule altered or optimized to reflect the available resources and capabilities of the construction industry? Forty-two agencies (81%) alter or optimize their letting schedule based on contractor resources and capabilities. Letting schedules are often driven by fiscal process constraints. One agency stated that they will only let projects if they believe there will be adequate competition and adequate industry resources for completing the work. One agency noted coordination with industry representatives on the timing of projects. The same agency noted that projects are generally let during the winter months prior to the project's planned summer construction season. One agency directly noted staggering the schedule by delaying or expediting projects to ensure adequate competition and resources.
4.4.2 Is the letting schedule altered or optimized to minimize disruptions to major traffic corridors? Ninety-two percent of the agencies are minimizing disruptions on major traffic corridors by optimizing the letting schedule. Projects are reviewed to make sure that multiple projects do not adversely impact traffic along certain corridors. Several agencies review major jobs and other construction activity on a case-by-case basis and adjust the letting schedule to reduce conflicts. Agencies often consider special events along a corridor in working to mitigate traffic impacts. One agency noted that schedules are altered or optimized to avoid upcoming special events and holidays. Another agency stated that an informal assessment occurs as opposed to a formal practice of altering schedules to minimize disruptions along major corridors.
4.4.3 When bidding type I and II projects, does the agency include road user costs in establishing incentives or disincentives (e.g., I/D, A+B, or lane rental) to minimize road user delay caused by work zones? Eighty-eight percent of the agencies include road user costs in establishing incentives/disincentives (I/D) to minimize road user delay in work zones. Some examples of the strategies used by agencies include A+B bidding, lane rental, I/D, and the use of modeling to determine the effects of construction on traffic. One agency cited use of I/D contracting, but said that it did not use A+B bidding. The same agency said that it uses a method similar to lane rental in order to limit the length of lane closures. Another agency cited success with I/D contracting but said that lane rental and A+B bidding have not been successful in the state. One agency noted use of disincentives in combination with off-peak work to ensure that adequate lanes are opened prior to peak traffic periods.
4.4.4 When bidding type I, II, and III projects, does the agency use performance-based selection to eliminate contractors who consistently demonstrate their inability to complete a quality job within the contract time? Twenty-eight of the responding agencies (54%) use performance-based selection to eliminate contractors that regularly have difficulty completing quality jobs on-time, which is one fewer than the 29 agencies implementing this practice in 2007. Two agencies stated that contractors are rated based on performance but that the ratings are not used to disqualify contractors from the bidding process. One agency noted that past performance is one criteria used when selecting a contractor for design/build projects. Another agency noted that this process also affects subcontractors.
4.4.5 When bidding type I and II project contracts, does the agency use incident management services (e.g., wreckers, push vehicles, and service patrols)? Incident management services such as wreckers, courtesy patrols, and off-duty highway patrol officers are used by 46 agencies (88%). While a majority of agencies use incident management services, some agencies commented that they do not include it as a bid item in the construction contract. Due to the common presence of incident management services in cities, urban freeway work zones benefit from services that are provided on a routine basis without the work zone in place. Alternatively, several agencies stated that dedicated incident management services are used on a project by project basis. One agency evaluated use of incident management services in work zones and determined that they are generally not cost effective.
4.4.6 When bidding contracts, does the agency use flexible starting provisions after the Notice to Proceed is issued? Most agencies (79%) routinely use flexible starting provisions after the Notice to Proceed is issued. One agency noted that project specifications will often include a set number of work days, but the contractor is allowed to begin at any time as long as the project is completed within the number of days specified. Another agency cited flexibility to account for the winter season, but typically allows 45 days between issuing the notice to proceed and the start date. One agency cited the need to determine the benefits of using this approach (for both the contractor and the owner-agency) along with the appropriate instances in which to use it.4.4.7 During type I, II, and III projects, does the agency use uniformed law enforcement? Ninety-two percent of the agencies use uniformed law enforcement on projects. As in 2007, this question has the highest overall rating of any question in the WZ SA, indicating that the use of law enforcement in work zones is a well-established and assessed practice in many agencies. Typical law enforcement roles include providing enhanced visibility during installation/removal of work zone traffic control; presence as a deterrent to speeding; and active enforcement. Several agencies have formal agreements with highway patrol to provide these services. Some agencies use law enforcement personnel on a project-by-project basis. One agency determines when to use law enforcement personnel in work zones based on the facility type (mainly limited access highways). One agency said it had begun use of automated speed enforcement in work zones (typically an officer is present when the system is active).
4.4.8 Does the agency provide/require training of contractor staff on the proper layout and use of traffic control devices? Most agencies (87%) indicated that they provide and/or require training of contractor staff on proper use of traffic control devices. Some agencies list training and certification requirements in their specifications. Several agencies cited focus on this area because of the provisions in the Work Zone Rule. One agency noted that local agencies within the state require training, and several agencies cited use of training provided by ATSSA chapters and Local Technical Assistance Programs (LTAP). One agency stated that a policy has been developed and that training is being implemented for designers, engineers, construction, and inspection personnel. FHWA is sponsoring training courses through the Work Zone Safety Grants Program that provides many agencies with training at a substantially reduced cost.
4.4.9 Does the agency provide training to uniformed law enforcement personnel on work zone devices and layouts? More than half (52%) of responding agencies provide training to uniformed law enforcement. This question had one of the highest percentage increases (21%) in the WZ SA for both 2007 and 2008. Several agencies use the FHWA Work Zone law enforcement training course as-is. One agency used the FHWA course as a starting point, developed a state-specific version, and provided train-the-trainer sessions to 65 law enforcement personnel. Some agencies have dedicated law enforcement personnel for work zones and provide enhanced training for this group. The Work Zone Rule now requires that enforcement personnel be trained, which likely contributed to increased development of agency plans for training law enforcement, moving the average score from 5.5 to 6.6 and closer to the implementation stage.
Communications and Education
To reduce public anxiety and frustration regarding work zones, it is important to sustain effective communications and outreach with the public about road construction and maintenance activity, and the potential impacts of the activities. This also increases the public's awareness of such activity. Lack of information is often cited as a key cause of frustration for the traveling public; therefore, the agency should identify and consider key issues from a public outreach and information perspective.
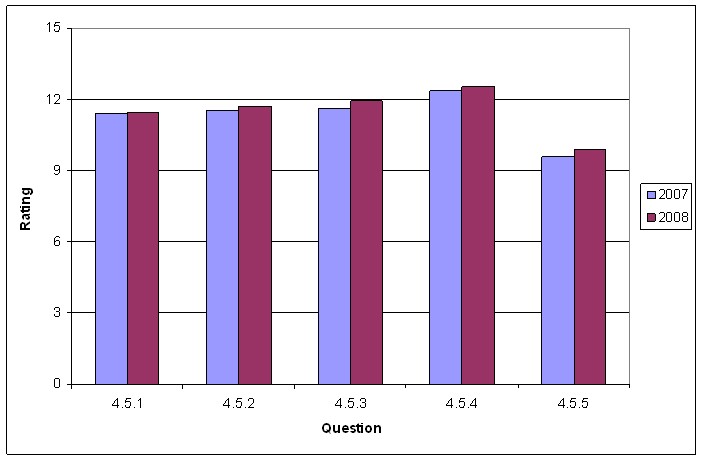
Figure 6 shows the average rating by question for 2007 and 2008 for the Communications and Education section. Table 9 shows the numeric ratings along with the percent change in average rating from 2007 to 2008 for each question. The average ratings increased for all of the questions in this section except question 1 which remained the same. The scores in this section have consistently been the highest in the WZ SA and remain so this year.
Figure 6. Results for Communications and Education Section
| Section | 2007 | 2008 | Change | Percent Change |
|---|---|---|---|---|
| 4.5.1 | 11.4 | 11.4 | 0 | 0% |
| 4.5.2 | 11.6 | 11.7 | 0.2 | 1% |
| 4.5.3 | 11.6 | 11.9 | 0.3 | 3% |
| 4.5.4 | 12.4 | 12.6 | 0.2 | 2% |
| 4.5.5 | 9.6 | 9.9 | 0.3 | 3% |
4.5.1 Does the agency maintain and update a work zone web site providing timely and relevant traveler impact information for type I, II, and III projects to allow travelers to make effective travel plans? Forty-eight agencies (92%) implement a web site to provide traveler impact information on projects to allow travelers to make more effective travel plans. One agency has implemented an e-traffic alert advisory system to alert subscribers about work zone notifications. One agency provides information that is updated each minute, while another agency updates project information on a daily basis. Some agencies use advanced technology (ITS) that will often include a website that provides information to the public about real-time traffic conditions.
4.5.2 Does the agency sponsor National Work Zone Awareness week? Most agencies (88%) sponsor National Work Zone Awareness week. Some agencies have no formal campaign but still support the program while others have planned activities throughout the week. One agency hosted the 2008 National Work Zone Awareness Week on the steps of its State Capitol. Examples of other activities include local memorials, displaying the national memorial, and work zone safety awareness conferences.
4.5.3 Does the agency assume a proactive role in work zone educational efforts? Most agencies (96%) are developing educational materials to inform and educate the public on work zone safety. This question was one of the highest scoring on the WZ SA, with many agencies not only implementing this strategy but also performing assessment of their work zone educational efforts. Most agencies that provided comments cited the use of educational efforts from public service announcements to high school driver's education programs. One agency has a program that has reached 25,000 high school students to create awareness about driving in work zones. One agency has a contract with a marketing firm to develop work zone safety and public awareness campaigns.
4.5.4 During type I, II, and III project construction, does the agency use a public information plan that provides specific and timely project information to the traveling public through a variety of outreach techniques (e.g., agency website, newsletters, public meetings, radio, and other media outlets)? This practice is being implemented by 51 of 52 agencies, giving it the highest implementation rate in the WZ SA. Almost all agencies (98%) use a public information plan to provide specific and timely project information to the traveling public through a variety of outreach techniques. Some of these techniques include publishing information on the agency's web site and providing information to media outlets. Other techniques include work zone maps, public relations managers, radio, TV, newspaper ads, telephone hotlines, and public information centers. Several agencies noted that they have a dedicated Public Information Officer who is responsible for planning outreach efforts. This question was the second highest scoring question on the WZ SA, indicating that the use of public information plans is widespread and is a well-established practice in most agencies.
4.5.5 During type I, II, and III projects, does the agency use intelligent transportation system (ITS) technologies to collect and disseminate information to motorists and agency personnel on work zone conditions? Forty-five agencies (87%) use ITS technologies to collect and disseminate work zone information. Many agencies use more basic systems, including portable changeable message signs to give the traveling public specific and timely project information and Highway Advisory Radio (HAR). Of the agencies who use ITS, several noted that use is on a project by project basis depending on need. One agency noted that ITS is generally not needed due to a policy on maintaining the same number of lanes during construction as were available prior to construction.
Program Evaluation
Evaluation is necessary to identify successes and analyze failures. Work zone performance monitoring and reporting at a nationwide level can increase the knowledge base on work zones and help lead to the development of better tools to help agencies better plan, design, and implement road construction and maintenance projects. At the local level, performance monitoring and reporting provides an agency with valuable information on the effectiveness of congestion mitigation strategies, contractor performance, and work zone safety.
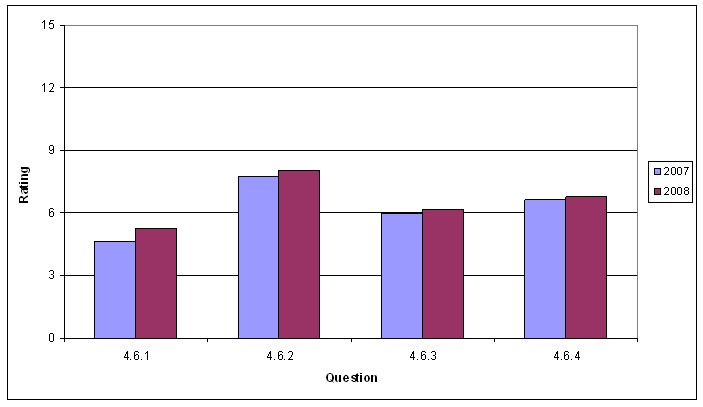
Figure 7 shows the average rating by question for 2007 and 2008 for the Program Evaluation section. Table 10 shows the numeric ratings along with the percent change in average rating from 2007 to 2008 for each question. The average ratings increased for all questions in this section. Question 1 (collecting data to track congestion and delay) had the largest percentage increases from 2007 (15%). The questions in this section remain among the lowest rated questions in the WZ SA.
Figure 7. Results for Program Evaluation Section
| Section | 2007 | 2008 | Change | Percent Change |
|---|---|---|---|---|
| 4.6.1 | 4.6 | 5.3 | 0.7 | 15% |
| 4.6.2 | 7.7 | 8.1 | 0.3 | 4% |
| 4.6.3 | 5.9 | 6.2 | 0.2 | 4% |
| 4.6.4 | 6.6 | 6.8 | 0.2 | 2% |
4.6.1 Does the agency collect data to track work zone congestion and delay in accord with agency-established measures? (See Section 1, item 4.1.4) Only 17 agencies (33%) collect data to track work zone congestion and delay performance against agency measures. Although this question had the lowest average score in the WZ SA, it had one of the largest percent increases in the WZ SA and had the highest percent increase for this section. Thus it appears that more agencies are moving toward using data to track work zone congestion and delay. One agency stated that development of a policy on work zone mobility and safety has identified a need, but that performance measures still need to be established. Another agency cited use of measures such as speed, volume, queue length, and delay during design. One agency noted that congestion and delay were not significant due to the large proportion of rural areas within the state.
4.6.2 Does the agency collect data to track work zone safety performance in accordance with agency-established measures? (See Section 1, item 4.1.5) Thirty-one agencies (60%) are collecting data to track work zone safety performance. One agency noted that data are collected on fatalities in work zones, but that the data reporting detail does not lend itself to evaluation via performance measures. One agency is evaluating data from select projects as part of planned reviews. It appears that crash data are often not detailed enough to support work zone safety measures. Surrogates for safety impacts, such as average speed and variability in speed on approach to the work zone (relative to upstream approach speeds), may prove useful to agencies in assessing safety impacts.
4.6.3 Does the agency conduct customer surveys to evaluate work zone traffic management practices and polices on a statewide/area-wide basis? Twenty-three agencies (44%) are using customer surveys to evaluate work zone performance. Agencies provide various opportunities for feedback on ways to improve work zones. Customer surveys are used in most cases. Customer surveys are often part of Context Sensitive Solutions practices in planning for and designing projects. One agency noted use of surveys and focus groups through the established public outreach process. Another agency noted use of annual surveys for project types III and IV. Use of telephone access lines for public input and comment was also cited by one agency.
4.6.4 Does the agency develop strategies to improve work zone performance on the basis of work zone performance data and customer surveys? Over half of agencies (58%) develop strategies to improve work zone performance based on work zone data and customer surveys. One agency noted that work zone safety strategies are developed based on both motorist and worker input. One agency noted that they are in the development stage of collecting, tracking, and monitoring work zone site information, as well as considering the use of customer surveys as a tool to improve performance. Another agency mobilizes a team to evaluate projects with excessive delay and make recommendations to the project team.
2 U.S. Census (http://www.census.gov/Press-Release/www/releases/archives/population/011671.html)
3 Bureau of Economic Analysis (http://www.bea.gov/newsreleases/regional/gdp_metro/2008/gdp_metro0908.htm)
previous | next