Work Zone Mobility and Safety Program

FHWA Work Zone Project Coordination Webinar

slide 1: Work Zone Project Coordination – Michigan's I-94 Corridor and the Great Lakes Megaregion

Bobbi Welke, Southwest Region Engineer
Michigan Department of Transportation

Peter Rafferty, ITS Program Manager
Wisconsin TOPS Lab, University of Wisconsin-Madison

September 24, 2012

Download the Printable Version [PDF, 3.3 MB]
PDF files can be viewed with the Acrobat® Reader®.


slide 2: Overview

  • Michigan's I-94 Corridor
    • GLRTOC
    • Partners & Mission
    • Geographic Area
    • Work Zone Coordination


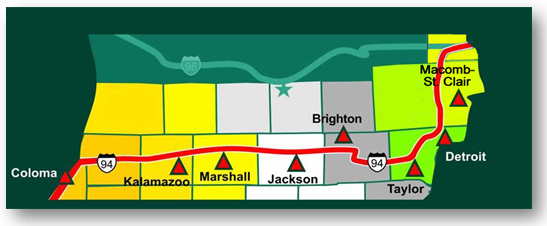
slide 3: MDOT Structure/I-94 Corridor

Map depicts the I-94 corridor from Caloma, Michigan, through MacComb-St. Clair, Michigan.


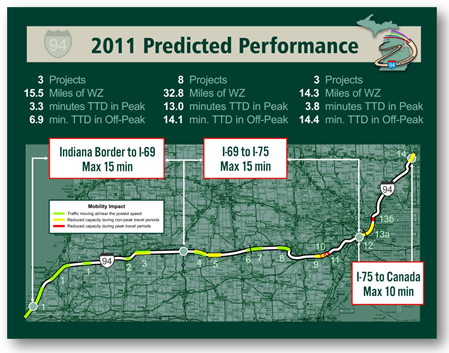
slide 4: 2011 Predicted Performance

Map of the I-94 corridor with 2011 predicted performance for three segments: 1. Indiana Border to I-69 (15 minutes max), 2. I-69 to I-75 (15 minutes max) and 3. I-75 to Canada (max 10 minutes). For the first segment, three projects were planned for 15.5 miles of WZ, 3.3 minutes TTD in peak, and 6.9 minutes TTD in off-peak. For the second segment, 8 projects were planned for 32.8 miles of WZ, 13.0 minutes TTD in peak, and 14.1 minutes TTD in off-peak. For the third segment, 3 projects were planned for 14.3 miles of WZ, 3.8 minutes TTD in peak, and 14.4 minutes TTD in off-peak.


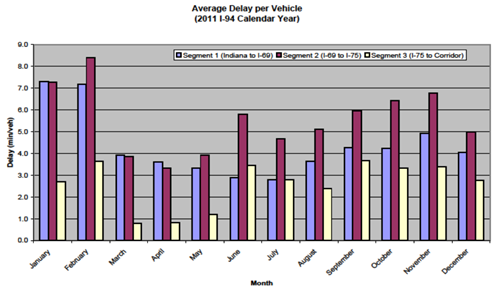
slide 5: Average Delay per Vehicle

Graph shows average delay for 2011 for the I-94 corridor broken out by segment and by month. Segment 2 (I-69 to I-75) shows the greatest delay for all months except March and April, in which Setment 1 (Indiana to I-69) carries the greatest delay.


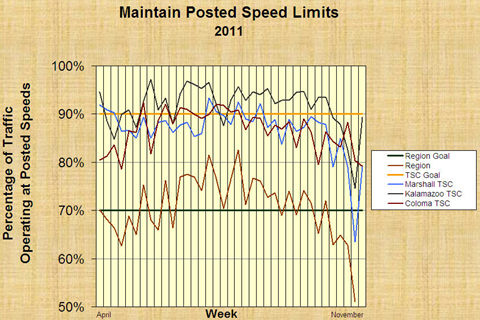
slide 6: Main Posted Speed Limits 2011

Graph shows the percentage of traffic operating at posted speeds by week from April through November for each municipality in the region.


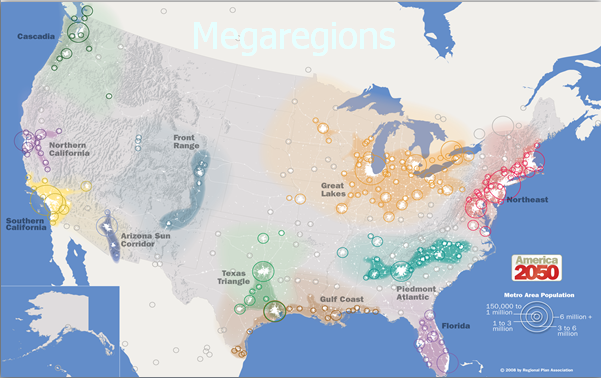
slide 7: Megaregions

Heat map of the United States showing projected metro area population projections for 2050.


slide 8: GLRTOC Partners & Mission

  • Chicago Skyway / Indiana Toll Road
  • Illinois DOT
  • Illinois Tollway
  • Indiana DOT
  • Michigan DOT
  • Ministry of Transportation Ontario
  • Minnesota DOT
  • Wisconsin DOT

Improve cross-regional transportation operations in support of regional economic competitiveness and improved quality of life.


slide 9:

Map of the Great Lakes region from Minneapolis, MN in the west, Lake Superior in the north, Toronto in the East, and Chicago and Detroit in the South.


slide 10: GLRTOC Strategies

  • Three Strategic Focus Areas
    • Efficient freight operations
    • Reliable mobility
    • TIM / ETO


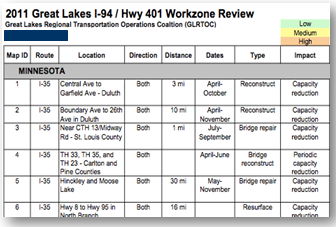
slide 11: Annual Work Zone Preview

  • LMIGA has been doing this for years for the Chicago region
  • Among the first efforts of GLRTOC
  • Held first week of February in Chicago

Screenshot of a table depicting the highway 401 workzone review for 2011. Table data includes map ID, route, location, direction, distance, dates, type, and impact.


slide 12:

Screenshot of an ArcGIS-generated GLRTOC Corridor and Workzone Map.


slide 13:

Screenshot of an ArcGIS-generated map that allows the user to select work zones on GLRTOC corridor routes or work zones outside the corridors. By selecting the work zone icon on the map, popup boxes appear describing teh location, direction, dates, type of work, etc. The user may also add or update work zone information.


slide 14: GLRTOC MCOM Award

  • Multi-State Corridor Operations & Management award for:
    • Center to Center Communications
    • Smart Work Zone Coordination

Maps depicting the states participating in multi-state corridor operations and a pole with communications equipment mounted on it.


slide 15: Smart Work Zone Coordination

  • Three tasks:
    • Annual work zone preview enhancements
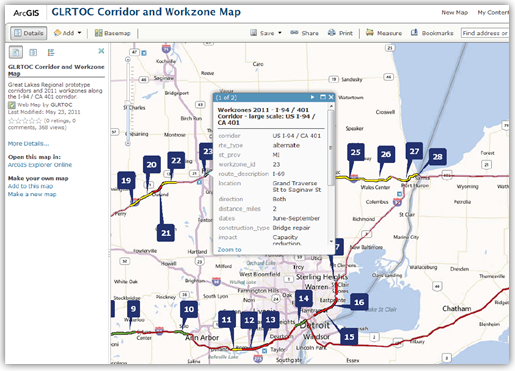
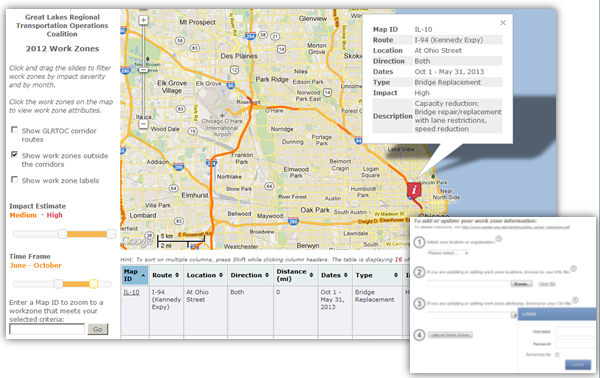
    • Work zone mapping application
    • Work zone performance monitoring


slide 16: 2. Work Zone Mapping Application
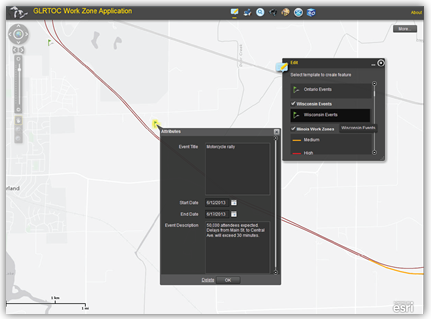
Screenshot the GLRTOC work zone application.


slide 17:

Screenshot the GLRTOC work zone application.


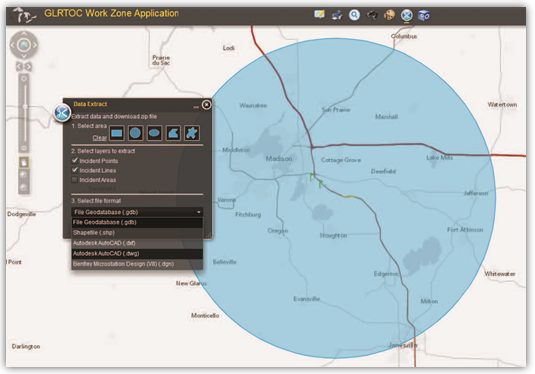
slide 18: 3. Smart Work Zone Monitoring

  • Pilot test segment is I-39/90 between Madison, WI and Rockford, IL
  • 65-mile mostly rural corridor
  • Minimal detection available
  • Three agencies
  • Multiple medium and high impact work zones


slide 19: Thank You

www.glrtoc.org

info@glrtoc.org

Office of Operations