Planned Special Events Capability Maturity Model
A Concise User's Guide to the Online Self-Assessment Tool
![]()
“Applying the key dimensions of organizational capability to Planned Special Events”
Table of Contents
- List of Figures
- List of Tables
- Purpose of User's Guide
- Requirements for Using the Online Tool
- Usage Note Pertaining to the “Back” Button
- Introduction
- The Key Dimensions of Capability
- The Four Levels of Capability
- The Home Screen
- The Menu Bar
- Choosing Your Assessment Path
- Scoring Your Assessment
- Creating a Customized Action List
- Print Q&A
List of Figures
- Figure 1. The Tool Home Screen.
- Figure 2. Tool Menu Bar.
- Figure 3. Hovers Showing Help Text for Menu Bar.
- Figure 4. Context Sensitive Help Text.
- Figure 5. Choosing Your Assessment Path Through the Tool.
- Figure 6. Questions and Answers for the Full Assessment Path.
- Figure 7. Selecting “Next” To Continue Through the Assessment.
- Figure 8. Selecting “Previous” To Return to Previous Screens of Questions.
- Figure 9. Selecting “Show Summary” to See Assessment Results.
- Figure 10. Matrix for 1-minute Assessment.
- Figure 11. Highlighted User Selections on 1-minute Assessment Matrix.
- Figure 12. Scoring Results From Assessment.
- Figure 13. Action Selection Screen.
- Figure 14. Actions Dialogue with Selected Actions.
- Figure 15. Selecting Different Capability Levels.
- Figure 16. Print Options for Action Selection Screen.
- Figure 17. Example of “My Selected Actions” Formatted for Printing.
- Figure 18. Print Q&A Capabilities.
- Figure 19. Text-Only Version Output.
List of Tables
- Table 1. Icons and Definitions Used in the Tool for the Key Dimensions of Capability.
- Table 2. Levels and Key Characteristics of Capability.
- Table 3. Menu Bar Buttons and Functions.
Purpose of User's Guide
The purpose of this user's guide is to give a concise background and overview of the Planned Special Events Capability Maturity Framework Online Self-Assessment Tool. In addition to the user's guide, the tool contains context sensitive help on each screen. The user's guide covers how the tool functions and highlights key capabilities. It is not intended to be a primer on conducting an assessment of planned special events capability within your region or agency.
Requirements for Using the Online Tool
The online tool is designed to be used with any modern web browser. The tool is lightweight in that it does not require any communication with an external database, require log-ins, or transmit any personally identifiable information (PII).
The web browser must support both JavaScript and a web browser capability called “local storage”. Local storage is simply a modem web browser technique of storing information locally without transmission to an external database. Browsers which do not support local storage (such as Internet Explorer 8) cannot be used with the tool.
The following browsers have been tested against the tool as of February 2015.
- Internet Explorer – tested from Version 9.0 and up
- Chrome – tested from Version 33 and up
- Firefox – tested from Version 30 and up
- Safari – tested from Version 7 and up
Other browsers may work as well, as long as they support the use of JavaScript and local storage.
Usage Note Pertaining to the “Back” Button
The online tool is constructed so that all actions are accomplished using navigation internal to the tool. Users should refrain from using the back button on their browser as this will exit you from the tool.
Introduction
The Planned Special Events Capability Maturity Framework (CMF) Self-Evaluation Tool is intended to help agencies/regions assess their current planned special events capabilities and develop an implementation plan for moving to a higher level of capability. This plan development is guided by a menu of actions to consider based on current and desired levels of capability. Users of the tool can take a full, highly detailed assessment, or a quick (1-minute) assessment to arrive at the point of selecting actions.
Modeled after the AASHTO Systems Operations and Maintenance guidance, this tool assesses planned special events capability in the same six dimensions — Business Processes, Systems and Technology, Culture, Organization and Workforce, Performance Measurement, and Collaboration. However, in this tool, planned special events is viewed as a subset of the larger Transportation Systems Management and Operations (TSM&O) program. The capability levels and the actions are more focused and defined from a traffic manager's perspective. The actions may require other agencies to be the responsible party, which is intended to foster multi-agency collaboration and dialogue about planned special events at the regional level. Users that take this assessment are encouraged to share this tool with agencies that they collaborate and work with on planned special events of their respective transportation systems.
Before initiating the assessment, you may want to identify the individuals in your Planned Special Events Center or other traffic operations and planning personnel in the region who are best positioned and experienced to address the steps outlined above, and involve them throughout the self-evaluation and action planning process.
The Key Dimensions of Capability
The assessment tool is built around the six key dimensions of capability. The tool uses icons to represent these dimensions. On-screen definitions are available to the user throughout the tool. The icons representing the six dimensions and their associated definitions are shown below in Table 1 for your reference and convenience.
| Dimension Icon | Definition |
|---|---|
 |
Business processes, in the context of TSM&O, refers to activities such as planning, programming, agency project development processes, and those organizational aspects that govern various technical or administrative functions such as training, human resource management, contracting and procurement, information technology, or agreements. In many cases, the business process elements go beyond the day-to-day operational activities and require broader institutional support and involvement to address. All of these processes are fundamental to the success of operations and management activities. Without the right procurement processes, partnering commitments, sustainable funding, internal awareness, and support, there could be a limited capacity to be able to implement more complex operations programs and activities. |
 |
Use of the appropriate processes for design and implementation of systems will ensure that the needs of the region are appropriately addressed, that systems are implemented in an efficient manner, and that interoperability with other systems is achieved. |
 |
Performance measurement is essential as the means of determining program effectiveness, determining how changes are affecting performance, and guiding decision-making. In addition, operations performance measures demonstrate the extent of transportation problems and can be used to “make the case” for operations within an agency and for decision-makers and the traveling public, as well as to demonstrate to them what is being accomplished with public funds on the transportation system. |
 |
Efficient execution of processes supporting effective programs requires appropriate combination of coordinated organizational functions and technical qualified staff with clear management authority and accountability. |
 |
Culture is the combination of values, assumptions, knowledge, and expectations of the agency in the context of its institutional and operating context, and as expressed in its accepted mission and related activities. |
 |
The development and implementation of TSM&O requires a collaborative approach. The effectiveness of most strategies is dependent on improving the coordinated performance of each partner. |
The Four Levels of Capability
Within each of the key dimensions of capability, agencies are categorized as being at Levels 1 through 4. Table 2 lists the four levels of capability and the associated key descriptor word and characteristics. It is important to understand that levels of capability are not judgmental—they are simply an indication of the current capabilities of an agency.
Many agencies taking the assessment today have results in Levels 1 and 2 across most or all of the key dimensions of capability. The overall intent of the online tool is to provide agencies with a method to customize an action list to transform an agency by increasing the level of capability within each dimension.
| Level | Key Descriptor | Key Characteristics |
|---|---|---|
| 1 | Performed |
|
| 2 | Managed |
|
| 3 | Integrated |
|
| 4 | Optimized |
|
The Home Screen
Figure 1 shows the home screen of the tool. Note that the Uniform Resource Locator (URL) shown in the figure may be different once the tool is hosted in its permanent location at the Federal Highway Administration (FHWA).

Figure 1. The Tool Home Screen.
The home screen features several key navigational and informational elements:
- Menu bar – provides access to all screens internal to the tool
- Introductory text – a short introduction explaining the tool
- Personalization information – text boxes to personalize your inputs into the tool (not required), and
- Assessment path icons – two icons allowing a user to choose their desired path through the assessment.
The Menu Bar
The menu bar for the tool (shown in Figure 2) remains the same across all screens of the tool for consistency.
Figure 2. Tool Menu Bar.
Table 3 shows the individual menu bar buttons and identifies their function within the tool.
| Menu Bar Button | Function |
|---|---|
Pressing the “start” button while anywhere in the tool returns the user to the home screen of the self-assessment tool. Pressing this button will prompt a dialogue box asking if the user is certain they want to leave the current screen within the tool. |
|
Pressing the “clear” button erases all input data (question responses, comments, and descriptive information) internal to the tool. |
|
Pressing the “print Q&A” button provides a summary of the self-evaluation questions and answers suitable for printing or copying and pasting into another program. |
|
Pressing the “score” button takes the user to a summary table of the most recent assessment results. |
|
Pressing the “actions” button allows the user to select and print a customized set of actions across dimensions and levels, particular to the agency. |
|
Selecting the “user's guide” button opens up a new browser tab with this document. |
|
Hovering over the “help” button displays context sensitive help applicable to the current screen the user is on in the tool. |
Tool Bar Hovers and Context Sensitive Help
Figure 3 shows an example of the information box that is displayed when a user hovers their mouse or pointing device over one of the menu bar options.

Figure 3. Hovers Showing Help Text for Menu Bar.
Figure 4 shows an example of the context sensitive help text. The text displayed in this hover can change on a screen by screen basis. The information contained in this hover will provide direction about what is displayed on the user's current screen and/or how to utilize the tool capabilities on that screen.

Figure 4. Context Sensitive Help Text.
Use of the Back Button While Navigating the Tool
The tool is designed to function with all navigation internal to the tool. The user does not need to use the back button of the browser or pointing device at any time.
Choosing Your Assessment Path
Starting from the home screen, the tool allows for two levels of user assessment; a “full assessment” or a “1-minute assessment.” The home screen also provides an opportunity for a user to input their name, email, agency, and department information. This information is not required and is provided solely for a user to customize their assessment and printouts from the tool for their own benefit. This information is stored in the local storage of the browser and is not transmitted anywhere externally, nor is it archived for future use.
Figure 5 illustrates the information input blocks to customize the tool outputs and an icon for each assessment path through the tool.

Figure 5. Choosing Your Assessment Path Through the Tool.
The full assessment path, will present a list of individual questions related to each dimension. A series of answers will be provided for each question, allowing the user to select the response that most closely represents the current capability of their agency.
The 1-minute assessment path will present a matrix showing generalized descriptions of agency capabilities within each dimension. A user can then estimate the appropriate level without going through each individual question.
It is important to understand that regardless of selecting the full or 1-minute assessment path, the user will arrive at the same point in the tool, with the same ability to prepare a customized list of actions to facilitate an agency moving between different levels in each dimension of capability.
Selecting the Full Assessment Path
Figure 6 illustrates the information that a user would see when they select the full assessment path. All questions related to a particular dimension of capability are presented at once. The user may need to scroll vertically to see and answer each question.
Figure 6 also illustrates the dimension icon and definition (as shown previously in Table 1) that is displayed at the top of the screen. This keeps the definition in full view of the user, allowing them to refer to the definition as needed.
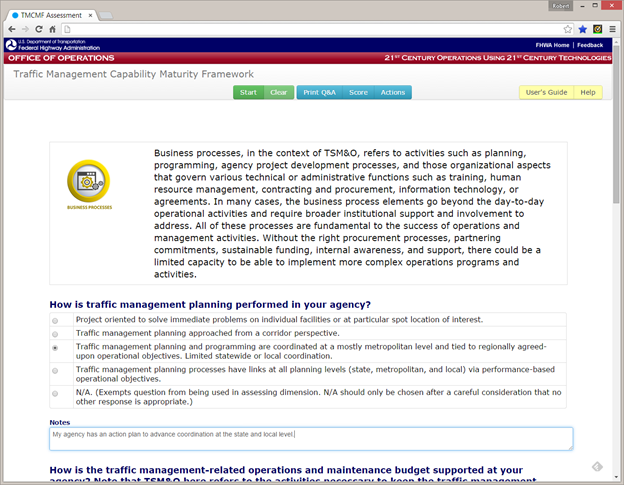
Figure 6. Questions and Answers for the Full Assessment Path.
Select the most appropriate answer for the question by pressing the circular radio button in front of the question. Only one answer is allowed per question. If the user selects N/A (Not Applicable), the scoring mechanism for the tool will remove that question from the calculations. Careful consideration should be made of all available answers before selecting N/A.
Figure 6 also illustrates the capability to record notes pertinent to each question in the box below the answers. This text box is not required, but is provided to give the user the ability to record any pertinent information or discussion related to the question at hand.
After answering each question in a particular dimension, the user will see a button stating “Next” as illustrated in Figure 7. The numbers to the left of the button indicate the total number of screens of questions (six, one screen for each dimension), and the number of question screens completed (in this case, one).

Figure 7. Selecting “Next” To Continue Through the Assessment.
After the first screen of questions, the user will have the opportunity to return to previous questions by selecting the “Previous” button at the bottom of the screen, as illustrated in Figure 8.

Figure 8. Selecting “Previous” To Return to Previous Screens of Questions.
At the conclusion of all the questions, the user will be presented with a button labeled “Show Summary”, as illustrated in Figure 9. Selecting this button completes the question and answer session and shows the user the results of their assessment.

Figure 9. Selecting “Show Summary” to See Assessment Results.
Selecting the 1-Minute Assessment Path
Figure 10 illustrates the screen that a user would see if they chose the 1-minute assessment. In this option, the user is presented with a matrix of dimensions and levels, and can simply select the level for each dimension that most closely matches the capability level of their agency. It is important to note that, unlike the full assessment option, the 1-minute assessment does not have the capability to record individual notes or pertinent information as part of the assessment routine.

Figure 10. Matrix for 1-minute Assessment.
The user selects the desired level with their mouse or pointing device. As illustrated in Figure 11, once selected, the chosen level will be highlighted. The user can switch their selection as much as they want, but only one level is allowed to be selected per dimension. It is important to note that, if a user does not select a level for a particular dimension, the tool will default their answer to Level 1.
Hovering over each dimension icon with the mouse or selection device will display a pop-up box containing the definition of the dimension. Moving the mouse or selection device away from the icon will clear the hover box.
At the bottom of the matrix, the user will see a blue “Show Summary” button. Selecting this button completes the 1-minute assessment option and shows the user the results of their assessment.

Figure 11. Highlighted User Selections on 1-minute Assessment Matrix.
Scoring Your Assessment
As shown in Figure 12, the selection of the “Show Summary” displays a matrix of dimensions by assessed level. If your selected path was the 1-minute assessment, the highlighted cells are the specific levels you chose for each dimension. In this case of the 1-minute assessment, the second column (labeled as “% score”) will show values of zero since no individual questions were answered. The tool will automatically score your assessment. No user interaction or calculation is required. Similar to the previous screens, holding the mouse or selection tool over the dimension icon will produce a hover box with the dimension definition.
In the case of the full assessment, utilizing individual questions, the second column will show the percentage of points scored vs. total points possible. If a question during the full assessment was answered with N/A (Not Applicable), the point values for that question were removed from the scoring by the tool to avoid artificially lowering your percentage score.
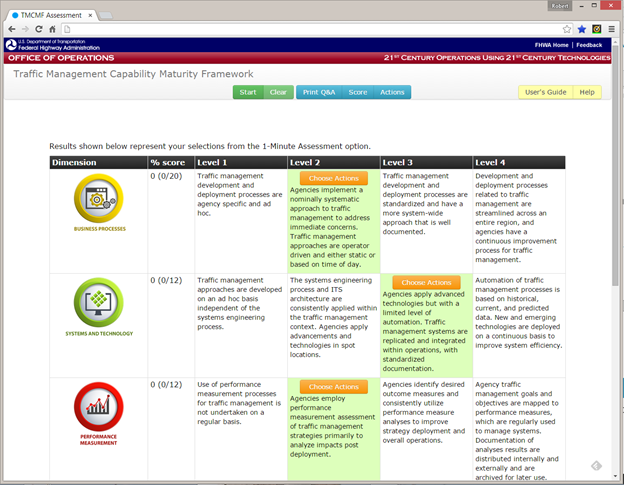
Figure 12. Scoring Results From Assessment.
At the top of the grid, the tool prints a note indicating how you arrived at the scoring matrix, i.e., either by the full or 1-minute assessment option.
A user can return to the scoring matrix at any time and from any screen by selecting “Score” button from the tool menu.
Selecting “Choose Actions” from within any the highlighted cells will start the process of creating a customized action list. The selection order does not matter. The actions selection process is fully interactive and users can switch back and forth between dimensions as they create customized lists.
Creating a Customized Action List
The online tool provides an intuitive process to create a customized action list for an agency to advance between levels in each key dimension of capability.
Selecting “Choose Actions” from any of the highlighted cells in the scoring matrix presents the user with a screen similar to the one shown in Figure 13. There are several items to take note of on this screen.
- The dimension you clicked on the scoring matrix is highlighted in the left-most column. In the example shown in Figure 13, “Business Processes” is highlighted in red, indicating that is the dimension that the user clicked on to start to action selections process.
- The middle (red) column of the screen is labeled “Available Actions”. Each action is outlined in its own box. These boxes can be dynamically moved by dragging and dropping them into the third (green) column labeled “My Selected Actions”.
- The text listed in the middle (red) column for each action is a description. Additional information is available for each action and includes a rationale statement and the parties typically responsible for implementing that selected action. This information is not presented in this actions selection dialogue but is processed in the background will be printed as part of the report showing the selected actions.
- Above the “Available Actions” column, there are two text boxes.
- The first box is labeled “Assessed”, and it is the level resulting from your assessment path for the dimension of capability currently highlighted.
- The “Assessed” level is a result of the user assessment path (either full or 1-minute) and will not change unless the user decides to return to the questions and changes answers to result in a different assessment level.
- The second box is labeled “Viewing”. It is a user-selectable drop-down menu that allows users to see actions from all levels of capability within a dimension. Upon first entering the “Available Actions” screen, this drop-down is automatically set to show actions that would elevate you from your currently-assessed level to the next (improved) level. In the example screenshot shown in Figure 13, the drop-down shows “Level 2 to Level 3” indicating that you were assessed at Level 2 and the default action would be to select actions to move to a Level 3 capability.
The validation workshops performed during the construction of this tool indicated that although users may score at a particular level, the users may want to investigate and select actions at other levels. Users of the tool can use the “Viewing” drop-down menu to select a different level step and see the associated actions. Any desired actions from any level can be placed into the “My Selected Actions” box, as described in the next section.

Figure 13. Action Selection Screen.
Figure 14 shows the same screen with some actions selected by the user and dragged from the second (red) column to the third (green) column. Actions can be moved back and forth at will. There are no limitations on the number of actions that can be selected among the available actions within a particular dimension and level.
It is expected that the selection of actions would be an interactive process amongst all group members who are assessing the agency's capability. The actions selection dialogue automatically saves all your selections in the browser's local storage. The user does not need to do anything to save their selections.
Depending on the individual settings of the user's computer and screen size, vertical scrolling may be necessary in the process of dragging and dropping actions. Dropping an action anywhere on the third (green) column will place it as a selected action.
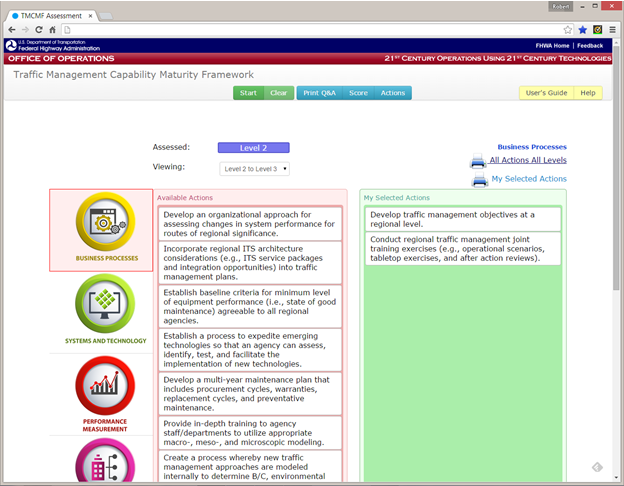
Figure 14. Actions Dialogue with Selected Actions.
Users are free to move between dimensions and levels at will. The tool will automatically save all changes and the selected actions will be retained unless the user removes the actions by dragging them from “My Selected Actions” (the green column) back to the “Available Actions” (the red column). A user can even use the main menu and go to other areas of the tool and return to actions screen without losing any information on the selected actions.
The sole exception to the above rule is if a user clicks on the main menu option of “Clear” and accepts the warning to clear all information. At that point all local storage is cleared and all previous answers, scoring results, and chosen actions will be reset to the default state.
Figure 15 shows the ability to select different levels within each dimension. Once a different level is selected, the list of “Available Actions” in the second (red) column will change. All actions previously moved to the third (green) column will remain intact, and the user can add any action items from this new list to the “My Selected Actions” (green) column.
The actions in the “My Selected Actions” (green) column will not reset or change when the user selects different level steps from the “Viewing” drop-down box (i.e., Level 1 to Level 2, or Level 3 to Level 4). The user does not have to worry about putting their selected actions in any order in the third (green) column. The tool will automatically order actions on the output in a hierarchical manner starting from the lowest to the highest level.
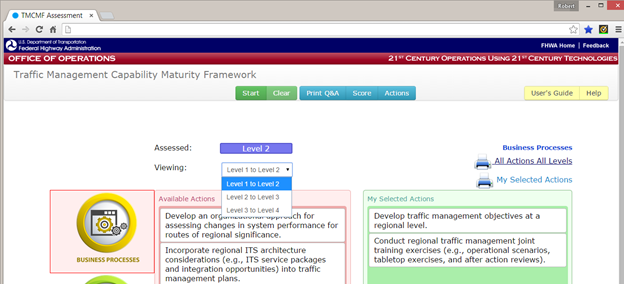
Figure 15. Selecting Different Capability Levels.
Printing Actions
The primary output of the actions selection dialogue is to create a customized output of your selection actions.
The print dialogue is shown above the third (green) column and can be activated at any time. The print options are shown in Figure 16.
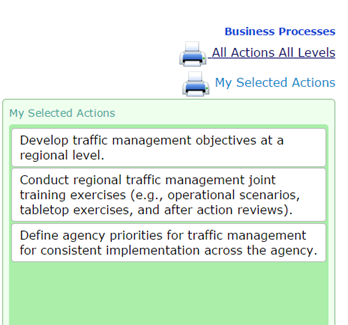
Figure 16. Print Options for Action Selection Screen.
There are several items to note pertaining to the print options.
- As a reminder for the user, the currently selected dimension is displayed above the print options. This changes dynamically as the user moves through the dimensions of capability in the first column.
- The print option labeled “All Actions All Levels” will print a fully formatted output of ALL of the action statements for ALL action levels within each dimension. This option allows users to have a full set of action information for each dimension.
- The print option labeled “My Selection Actions” will print a customized output from all actions currently in the third (green) column.
- All print dialogues open up in a new browser tab so that the users never lose their place internal to the tool.
Figure 17 shows an example of the “My Selected Actions” print result in a new browser tab. Users should note that due to browsers and printer differences, the physical output may look slightly different from the example shown in Figure 17.
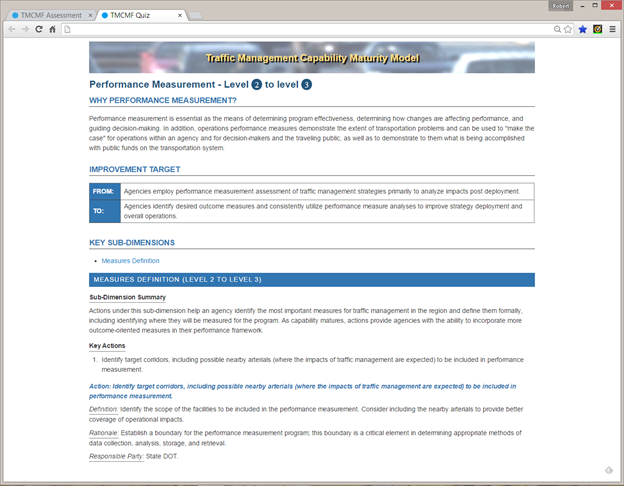
Figure 17. Example of “My Selected Actions” Formatted for Printing.
Users should note that the action output from the tool, as shown in Figure 17 contains additional information beyond that which is displayed in the tool. Specifically, the action output includes the following:
- The dimension and definition
- Headings highlighting the movement between levels, such as Level 2 to Level 3.
- A text block indicating the improvement target by moving from one level to the next
- A listing of sub-dimensions. Sub-dimensions are specific categories of similar actions under each dimension. Each sub-dimension has a definition which is included in the printout.
- A numerical listing of the key actions under each sub-dimension. Key actions are the ones selected by the user through the interactive actions selection process.
- For each individual action, the following are available:
- The action statement,
- The action definition,
- The action rationale, and
- The party or parties responsible for implementing the action
Print Q&A
Similar to the actions, the tool contains a print capability to allow a user to record their individual questions, answers, and associated notes. Please note that this output option only applies to the full assessment path.
Selecting the “Print Q&A” button from the tool menu will show a screen similar to Figure 18. For each question, the answer selected by the user during the full assessment is highlighted. Any notes recorded by the user during the assessment are also presented.
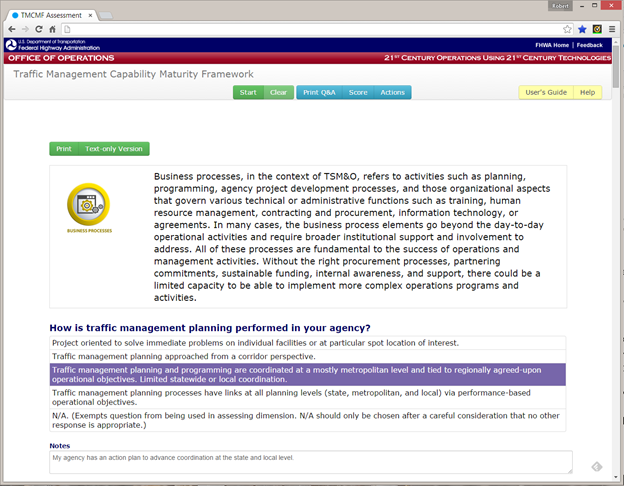
Figure 18. Print Q&A Capabilities.
At the top of the screen, there are two sub-menu options, “Print” and “Text-Only Version”. Selecting “Print” will directly invoke the browser's print dialogue. This dialogue differs slightly between browsers. Slight formatting differences between the printed version and the on-screen version may be noticeable as different browsers support different levels of formatting in their print options.
Selecting “Text-Only Version” will produce a plain text output of the questions and answers in a new browser tab. This plain text option has been provided to facilitate a user desire to copy and paste questions and answers into other programs beyond the browser such as a word processor, spreadsheet, or presentation program.
Note that in the text-only output (see example Figure 19), the selected answer for each question has an “*” in front of it.

Figure 19. Text-Only Version Output.