Appendix H: Understanding CORSIM Outputs
TSIS and CORSIM report the numerical results of the model run in text output files or spreadsheet files. The results are summarized over time and/or space. It is critical that the analyst understands how CORSIM has accumulated and summarized the results to avoid pitfalls in interpreting the numerical output. A summary of all MOEs available through the output processor is presented at the end of this appendix.
Cumulative Versus Interval Data
CORSIM accumulates data over time intervals and either reports the cumulative sum, maximum, or average. The output processor can also report data specific to the time interval or time period. Interval specific data are useful for comparing volume data that vary over time periods. The changes are reflected close to when the changes were made, whereas cumulative data, especially data averaged over the duration of the run, takes a long time to reflect the changes in the output. Figure 89 shows the cumulative average speed and the interval specific average speed over the duration of a peak period. The figure shows that the cumulative average speed is slow to react to the conditions in the network while the interval average speed shows the speed changes more like they occur in the real world.
Figure 89. Graph. Cumulative versus interval data.
CORSIM can report the results for specific points on a link in the network by using detectors or data stations, or for aggregated data over the entire link. The point-specific output is similar to what would be reported by detectors in the field. Link-specific values of road performance are accumulated over the length of the link and, therefore, will vary from the point data.
The key to correctly interpreting the numerical output of CORSIM is to understand how the data were accumulated by the model and summarized in the report. The report headings give the analyst a clue as to the method of accumulation used. The method of data accumulation and averaging can be determined through a detailed review of the CORSIM documentation of the reports that it produces and, if the documentation is lacking, by querying the software developers themselves through technical support or other means.
An initial healthy skepticism is valuable when reviewing reports until the analyst has more experience with CORSIM. CORSIM, like any other software program, may have an error in the programming. It helps to cross-check output to ensure that the analyst understands how the data is accumulated and reported by the software.
Control Delay
In the 1997 version of the HCM, intersection control delay (ICD) was defined as the delay incurred by the control facility. “Control delay includes initial deceleration delay, queue move-up time, stopped delay and final acceleration delay.”(3) Figure 90 illustrates the components of control delay.
Figure 90. Diagram. Control delay components.
From the figure, it can be seen that:
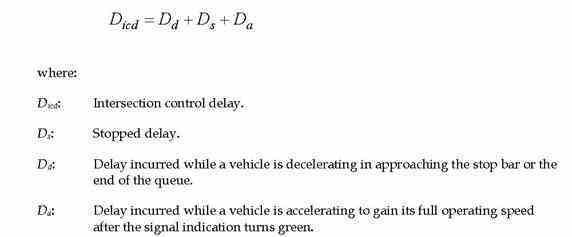
Figure 91. Equation. Control delay components.
The intersection control delay Dicd can be calculated as follows:
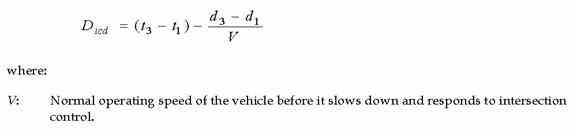
Figure 92. Equation. Calculating intersection control delay.
When traffic volume is light, the free-flow speed of the vehicle on the link can replace V in the equation in Figure 92. However, at high demand, V can be considerably smaller than the free-flow speed. In other words, while the vehicle is delayed by intersection control, it is also delayed by high volume. The total delay from time t1 to t3 is calculated in the equation in Figure 93.
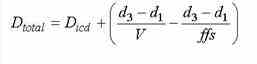
Figure 93. Equation. Calculating intersection total delay.
It should be pointed out that only control delay fully accounts for any slow down caused by intersection signal control. Stopped delay (Ds) only considers the time lost while a vehicle stops in the queue waiting for a green signal indication or waiting for its leader to move forward. It does not consider the time lost while a vehicle is slowing down and approaching the stop bar or the end of the queue (Dd), nor does it consider the time lost while a vehicle is in a process of regaining its normal operating speed (Da). Approach delay may fully account for Ds and Dd, however, accumulation of Da is terminated when a vehicle passes the stop bar of the intersection, even though it may still be in the process of regaining its full operating speed. This of course underestimates the delay incurred during the acceleration stage. In addition, the portion of Da that is ignored may represent a significant part of Da if the vehicle is among those first vehicles behind the stop bar. Obviously, control delay is a more accurate measurement of vehicular delay caused by intersection control.
Average ICD (AICD) can be calculated analytically by applying formulas (9-22) through (9-27) in the HCM.(3) There are several approaches to measure ICD at existing intersections:
- Test-car observing.
- Path tracking.
- Arrival and departure queue observing.
HOV Link Statistics
Most of these statistics are the same as the link statistics, except broken down by lane, and some MOEs are converted to units per person. The conversion is accomplished by dividing the MOEs by the total number of occupants transported by all of the vehicles on the link since the beginning of the simulation. This table also indicates that a lane is an HOV lane or an SOV lane and reports the volume of violators that used the HOV lanes. A violator is a vehicle that does not qualify to use the HOV lane but uses it anyway.
Output Processocr MOE Description
The output processor writes the collected data to an Excel workbook, a comma-separated file, a tab-separated file, and/or an XML file. Data collected during multiple runs of CORSIM can be averaged and many other statistics can be calculated. Interval data and time period data can be selected to produce interval specific data or time period specific data in addition to cumulative data. Application Program Interface (API) functions in CORSIM are used by the Output Processor so the MOEs available in CORSIM can change without requiring changes to other components of the TSIS package. Consequently, all data that are available in the CORSIM output (*.out) file are available from the output processor. All values are calculated by CORSIM. The TSIS Output Processor is capable of collecting and summarizing an extensive list of different MOEs.
Table 23 through Table 43 describe the MOEs available through the output file (*.out) or Output Processor.
| CLASS NAME: Bus_Route | ||
|---|---|---|
MOE LABEL |
UNITS |
DESCRIPTION |
Person Travel Time |
Minutes |
Total time that persons spent traversing the route. Calculated as Travel Time Total times the average bus occupancy. |
Person Trips |
---- |
Number of persons that have completely traversed the route in a bus. Calculated as Bus Trips times the average bus occupancy. |
Travel Time Per Bus |
Minutes/Bus |
Average time a bus spent traversing the route. Calculated as Travel Time Total divided by Bus Trips. |
Travel Time Total |
Minutes |
Total time that buses spent traversing the route. Accumulated when a bus discharges from the last link of the route. |
Trips |
---- |
Number of buses that have completely traversed all links in the route. Accumulated when a bus exits the last link of a route. |
| CLASS NAME: BusStation | ||
|---|---|---|
MOE LABEL |
UNITS |
DESCRIPTION |
Buses Serviced Total |
---- |
The total number of buses that serviced the station. Accumulated during the evaluation interval. |
Capacity Exceeded Time Total |
Minutes |
Total time that the capacity of the station was exceeded. Accumulated when buses cannot enter the station because the station is full. |
Dwell Time Total |
Minutes |
Total time that buses dwelled in the station. Accumulated during the evaluation interval. |
Empty Time Total |
Minutes |
Total time that the station was empty (no buses dwelling in the station). Accumulated during the evaluation interval. |
| CLASS NAME: Data_Station | ||
|---|---|---|
MOE LABEL |
UNITS |
DESCRIPTION |
Headway Average |
Seconds |
Average time between vehicles crossing the data station. Calculated as the sum of the headways of all vehicles crossing the data station divided by the number of vehicles crossing the data station. |
Speed Average |
Feet/Second |
Average speed of vehicles crossing the data station. Calculated as the sum of the speeds of all vehicles crossing the data station divided by the number of vehicles crossing the data station. |
Table 26. Data station histogram MOEs.
| CLASS NAME: Data_Station_Histogram | ||
|---|---|---|
MOE LABEL |
UNITS |
DESCRIPTION |
Headway Histogram Data |
---- |
Histogram of headways. Calculated as the number of vehicles that crossed the data station with a headway in the indicated range, divided by the number of vehicles crossing the data station, multiplied by 100 to express in percentage. |
Speed Histogram Data |
---- |
Histogram of speeds. Calculated as the number of vehicles that crossed the data station with a speed in the indicated range, divided by the number of vehicles crossing the data station, multiplied by 100 to express in percentage. |
Table 27. Freeway Detector MOEs.
| CLASS NAME: Detector_Freeway | ||
|---|---|---|
MOE LABEL |
UNITS |
DESCRIPTION |
Headway Average |
Seconds |
Average headway of vehicles crossing the detector. Calculated as the sum of vehicle headways divided by the vehicle count. |
Occupancy Percent |
---- |
Ratio of the detector on time to the duration of the evaluation interval scaled to a point value and expressed as a percent. Calculated as the detector on time divided by the duration of the evaluation interval and multiplied by the ratio of the average vehicle length divided by the sum of the average vehicle length plus the detector length. |
Speed Average |
Miles/Hour |
Average speed of vehicles crossing the detector. Calculated as the sum of the speeds of all vehicles crossing the detector divided by the vehicle count. |
Volume |
Vehicles/Hour |
Number of vehicles crossing the detector, converted to an hourly count. Calculated as the vehicle count divided by the length of the evaluation interval and scaled to one hour. |
Table 28. Surface street detector MOEs.
| CLASS NAME: Detector_Surface | ||
|---|---|---|
MOE LABEL |
UNITS |
DESCRIPTION |
Count |
---- |
Number of vehicles crossing the detector. Accumulated during the evaluation interval. |
Occupancy Percent |
---- |
Ratio of the detector on time to the duration of the evaluation interval, expressed as a percent. Calculated as On Time divided by the duration of the evaluation interval. |
On Time |
Seconds |
Total time that the detector was activated. Accumulated during the evaluation interval. |
Speed Average |
Miles/Hour |
Average speed of vehicles crossing the detector. Calculated as the sum of the speeds of all vehicles crossing the detector divided by Count. |
| CLASS NAME: Entry_Link | ||
|---|---|---|
MOE LABEL |
UNITS |
DESCRIPTION |
Delay Per Vehicle |
Seconds/Vehicle |
Total delay experiences by all vehicles waiting to enter the network divided by the number of vehicles waiting to enter the network. |
Delay Total |
Seconds |
Total delay experienced by all vehicles waiting to enter the network. |
Delayed Vehicles |
Vehicles |
Total number of vehicles that were unable to enter the network at their scheduled time. |
Vehicles Discharged Total |
Vehicles |
Number of vehicles that have been discharged from the link. Accumulated during the evaluation interval. |
Vehicles In Queue Current |
Vehicles |
Total number of vehicles that are currently in queue at the entry link because they were unable to enter the network at their scheduled time. |
| CLASS NAME: Fleet_Link | ||
|---|---|---|
MOE LABEL |
UNITS |
DESCRIPTION |
Fuel Consumption |
Gallons |
Total amount of fuel consumed by all vehicles in the fleet. Accumulated for the link during the evaluation interval. |
| CLASS NAME: Lane_Freeway | ||
|---|---|---|
MOE LABEL |
UNITS |
DESCRIPTION |
Content Current |
Vehicles |
A snapshot of the current number of vehicles in the lane. |
Delay Travel Per Vehicle |
Seconds/Vehicle |
Average time a vehicle was delayed in the lane. Calculated as Travel Time Per Vehicle minus Move Time Per Vehicle. |
Delay Travel Total |
Minutes |
Total time vehicles were delayed in the lane. Accumulated per vehicle during the evaluation interval, using each vehicle's travel time, distance traveled in the lane, and desired free-flow speed. |
Move Time Per Vehicle |
Seconds/Vehicle |
Theoretical time for a vehicle to travel the length of the lane if it were moving unimpeded at the free-flow speed. Calculated as (Travel Time Total minus Delay Travel Total) divided by Travel Time Total times Travel Time Per Vehicle. |
Person Delay Per Person |
Seconds/Person |
Average time a person is delayed in the lane. Calculated as (Travel Time Total divided by Person Travel Time Total) times Delay Time Per Vehicle. |
Person Move Time Per Person |
Seconds/Person |
Move Time Per Vehicle times average content divided by average occupancy per vehicle, using data accumulated per lane. |
Person Travel Time Per Person |
Seconds/Person |
Average time a person travels in the lane. Calculated as Person Delay Per Person plus Person MoveTime Per Person |
Person Travel Time Total |
Seconds |
Total time that people were traveling in the lane. Accumulated during the evaluation interval. |
Speed Average |
Miles/Hour |
Average speed of the vehicles in the lane. Calculated as Travel Distance Total divided by Travel Time Total. |
Travel Distance Total |
Miles |
Total distance traveled by vehicles while they were in the lane. Accumulated during the evaluation interval. |
Travel Time Per Vehicle |
Seconds/Vehicle |
Average time for a vehicle to traverse the entire lane. Calculated as the length of the lane divided by Speed Average. |
Travel Time Total |
Minutes |
Total time that vehicles were in the lane. Accumulated during the evaluation interval. |
Volume |
Vehicles/Hour |
Number of vehicles using the lane, expressed as an hourly value. Calculated as the lane density times Speed Average for the lane. Lane density is determined by dividing the average content for the lane by the length of the lane. |
Table 32. Freeway HOV Lane MOEs.
| CLASS NAME: Lane_Freeway_HOV | ||
|---|---|---|
MOE LABEL |
UNITS |
DESCRIPTION |
Content Current |
Vehicles |
A snapshot of the current number of vehicles in the lane. |
Delay Travel Per Vehicle |
Seconds/Vehicle |
Average time a vehicle was delayed in the lane. Calculated as Travel Time Per Vehicle minus Move Time Per Vehicle. |
Delay Travel Total |
Minutes |
Total time vehicles were delayed in the lane. Accumulated per vehicle during the evaluation interval, using each vehicle’s travel time, distance traveled in the lane, and desired free-flow speed. |
Move Time Per Vehicle |
Seconds/Vehicle |
Theoretical time for a vehicle to travel the length of the lane if it were moving unimpeded at the free-flow speed. Calculated as (Travel Time Total minus Delay Travel Total) divided by Travel Time Total times Travel Time Per Vehicle. |
Person Delay Per Person |
Seconds/Person |
Average time a person is delayed in the lane. Calculated as (Travel Time Total divided by Person Travel Time Total) times Delay Time Per Vehicle. |
Person Move Time Per Person |
Seconds/Person |
Move Time Per Vehicle times average content divided by average occupancy per vehicle, using data accumulated per lane. |
Person Travel Time Per Person |
Seconds/Person |
Average time a person travels in the lane. Calculated as Person Delay Per Person plus Person MoveTime Per Person |
Person Travel Time Total |
Seconds |
Total time that people were traveling in the lane. Accumulated during the evaluation interval. |
Speed Average |
Miles/Hour |
Average speed of the vehicles in the lane. Calculated as Travel Distance Total divided by Travel Time Total. |
Travel Distance Total |
Miles |
Total distance traveled by vehicles while they were in the lane. Accumulated during the evaluation interval. |
Travel Time Per Vehicle |
Seconds/Vehicle |
Average time for a vehicle to traverse the entire lane. Calculated as the length of the lane divided by Speed Average. |
Travel Time Total |
Minutes |
Total time that vehicles were in the lane. Accumulated during the evaluation interval. |
Vehicles Entering HOV Lane |
Vehicles |
Number of vehicles entering an HOV lane at the start of the HOV lane. Accumulated during the evaluation interval. |
Vehicles Exiting HOV Lane |
Vehicles |
Number of vehicles exiting an HOV lane at the end of the HOV lane. Accumulated during the evaluation interval. |
Violator Volume |
Vehicles/Hour |
Hourly volume of all vehicles that used the lane even though they do not meet the requirements for the lane. Calculated as the lane density times Speed Average for violators using the lane. Lane density is determined by dividing the average content for violators in the lane by the length of the lane. |
Volume |
Vehicles/Hour |
Number of vehicles using the lane, expressed as an hourly value. Calculated as the lane density times Speed Average for the lane. Lane density is determined by dividing the average content for the lane by the length of the lane. |
Table 33. Surface street lane MOEs.
| CLASS NAME: Lane_Surface | ||
|---|---|---|
MOE LABEL |
UNITS |
DESCRIPTION |
Content Current |
Vehicles |
A snapshot of the current number of vehicles in the lane. |
Queue Average Number Vehicles |
Vehicles |
Average number of vehicles in queue in the lane. Calculated as the number of vehicles in queue, accumulated every second, divided by the duration of the evaluation interval. |
Queue Current Length |
Feet |
A snapshot of the distance from the stop line to the end of the current queue in lane. |
Queue Current Number Vehicles |
Vehicles |
A snapshot of the current number of vehicles in queue in the lane. |
Queue Maximum Number Vehicles |
Vehicles |
Largest number of vehicles in queue in the lane during the evaluation interval. |
Vehicles Discharged Per Hour |
Vehicles/Hour |
Number of vehicles discharged from the lane, converted to an hourly rate. |
Vehicles Discharged Total |
Vehicles |
Total number of vehicles discharged from the lane during the evaluation interval. |
| CLASS NAME: Link_Freeway | ||
|---|---|---|
MOE LABEL |
UNITS |
DESCRIPTION |
Bus Delay Per Vehicle |
Seconds/Vehicle |
Average time that a bus was delayed on the link. Calculated as Bus Delay Total divided by Bus Trips. |
Bus Delay Total |
Minutes |
Total time that buses were delayed on the link. Calculated as Bus Travel Time Total minus Bus Move Time Total. |
Buses That Stopped |
---- |
Number of buses that stopped at least once on the link. Accumulated during the evaluation interval when a bus stops, provided the bus has not previously stopped. |
Bus Move Time Per Travel Time Ratio |
---- |
Ratio of the theoretical move time to the actual travel time for buses on the link. Calculated as Bus Move Time Total divided by Bus Travel Time Total. |
Bus Move Time Total |
Minutes |
Total theoretical time for discharged buses to travel the length of the link if moving unimpeded at the free-flow speed. Calculated as Bus Trips times the length of the link divided by the link free-flow speed. |
Bus Person Trips |
---- |
Number of persons that have completely traversed the link in a bus. Calculated as Bus Trips times the average bus occupancy. |
Bus Speed Average |
Miles/Hour |
Average speed at which a bus traverses the link. Calculated as Bus Trips times the length of the link divided by Bus Travel Time Total. |
Bus Travel Time Per Vehicle |
Seconds/Vehicle |
Average time for a bus to traverse the link. Calculated as Bus Travel Time Total divided by Bus Trips. |
Bus Travel Time Total |
Minutes |
Total time that discharged buses spent traversing the link. Accumulated whenever a bus discharges the link during the evaluation interval. |
Bus Trips |
---- |
Number of buses that have completely traversed the link during the evaluation interval. |
Content Average |
Vehicles |
Average number of vehicles on the link during the evaluation interval. Calculated as the Travel Time Total divided by the duration of the evaluation interval. |
Content Current |
Vehicles |
A snapshot of the current number of vehicles on the link. |
Delay Travel Per Distance Traveled |
Minutes/Mile |
Average time vehicles were delayed per each mile of travel. Calculated as Delay Travel Per Vehicle divided by Travel Time Per Vehicle multiplied by Travel Time Per Distance Traveled. |
Delay Travel Per Vehicle |
Seconds/Vehicle |
Average time that a vehicle was delayed on the link. Calculated as the Delay Travel Total divided by Vehicles Discharged. |
Delay Travel Total |
Minutes |
Total time that all vehicles were delayed on the link. Calculated as the Travel Time Total minus Move Time Total for the link. |
Density Per Lane |
Vehicles/Mile/Lane |
Average number of vehicles per mile per lane. Calculated as Content Average divided by link area. Link area is the sum of the lengths of the lanes in the link. |
Emissions Rate CO |
Kilograms/Mile-Hour |
The CO emission rate due to all vehicles on the link. Calculated as Emissions Total CO divided by the duration of the evaluation interval. |
Emissions Rate HC |
Kilograms/Mile-Hour |
The HC emission rate due to all vehicles on the link. Calculated as Emissions Total HC divided by the duration of the evaluation interval. |
Emissions Rate NOx |
Kilograms/Mile-Hour |
The Nox emission rate due to all vehicles on the link. Calculated as Emissions Total Nox divided by the duration of the evaluation interval. |
Emissions Total CO |
Grams/Mile |
The total CO emissions per mile produced by all vehicles on the link. Accumulated during the evaluation interval. |
Emissions Total HC |
Grams/Mile |
The total HC emissions per mile produced by all vehicles on the link. Accumulated during the evaluation interval. |
Emissions Total Nox |
Grams/Mile |
The total Nox emissions per mile produced by all vehicles on the link. Accumulated during the evaluation interval. |
Fuel Consumption Total |
Gallons |
Total fuel consumed by all vehicles on the link. Calculated as the sum of the Fuel Consumption by fleet on the link. |
Lane Changes Total |
---- |
Total number of lane changes that have been completed on the link. Accumulated during the evaluation interval. |
Move Time Per Travel Time Ratio |
---- |
Ratio of the theoretical move time to the actual travel time for vehicles on the link. Calculated as Move Time Total divided by Travel Time Total. |
Move Time Per Vehicle |
Seconds/Vehicle |
Theoretical time for a vehicle to travel the length of the link if it were moving unimpeded at the free-flow speed. |
Move Time Total |
Minutes |
Total theoretical time for discharged vehicles to travel the length of the link if moving unimpeded at the free-flow speed. Calculated as Travel Distance Total divided by the free-flow speed on the link. |
Speed Average |
Miles/Hour |
Average speed of a vehicle that has completely traversed the link. Calculated as Travel Distance Total divided by the Travel Time Total. |
Travel Distance Total |
Miles |
Total distance traveled by vehicles on the link. Accumulated during the evaluation interval. |
Travel Time Per Distance Traveled |
Minutes/Mile |
Average time for a vehicle to travel one mile. Calculated as Travel Time Total divided by Travel Distance Total. |
Travel Time Per Vehicle |
Seconds/Vehicle |
Average time for a vehicle to traverse the link. Calculated as the length of the link divided by Speed Average. |
Travel Time Total |
Minutes |
Total time that all vehicles were on the link. Accumulated during the evaluation interval. |
Vehicles Discharged |
Vehicles |
Number of vehicles that have been discharged from the link. Accumulated during the evaluation interval. |
Vehicles Discharged Left |
Vehicles |
Number of vehicles that have been discharged from the link exiting to the left. Accumulated during the evaluation interval. |
Vehicles Discharged Right |
Vehicles |
Number of vehicles that have been discharged from the link exiting to the right. Accumulated during the evaluation interval. |
Vehicles Discharged Through |
Vehicles |
Number of vehicles that have been discharged from the link continuing through. Accumulated during the evaluation interval. |
Vehicles Entering Link |
Vehicles |
Number of vehicles that have entered the link. Accumulated during the evaluation interval. |
Vehicles Exiting Link |
Vehicles |
Number of vehicles that have exited from the link. Accumulated during the evaluation interval. |
Volume Per Lane |
Vehicles/Hour/Lane |
Average number of vehicles traversing each lane, converted to an hourly value. Calculated as Density times Speed Average. |
Table 35. Surface street link MOEs.
| CLASS NAME: Link_Surface | ||
|---|---|---|
MOE LABEL |
UNITS |
DESCRIPTION |
Bus Delay Per Vehicle |
Seconds/Vehicle |
Average time that a bus was delayed on the link. Calculated as Bus Delay Total divided by Bus Trips. |
Bus Delay Total |
Minutes |
Total time that buses were delayed on the link. Calculated as Bus Travel Time minus Bus Move Time. |
Buses That Stopped |
---- |
Number of buses that stopped at least once on the link. Accumulated when a bus stops, provided the bus has not previously stopped. |
Bus Move Time Per Travel Time Ratio |
---- |
Ratio of the theoretical move time to the actual travel time for buses on the link. Calculated as Bus Move Time divided by Bus Travel Time. |
Bus Move Time Total |
Minutes |
Total theoretical time for discharged buses to travel the length of the link if moving unimpeded at the free-flow speed. Calculated as Bus Trips times the length of the link divided by the link free-flow speed. |
Bus Person Trips |
---- |
Number of persons that have completely traversed the link in a bus. Calculated as Bus Trips times the average bus occupancy. |
Bus Speed Average |
Miles/Hour |
Average speed at which a bus traverses the link. Calculated as Bus Trips times the length of the link divided by Bus Travel Time Total. |
Bus Travel Time Per Vehicle |
Seconds/Vehicle |
Average time a bus traverses the link. Calculated as Bus Travel Time Total divided by Bus Trips. |
Bus Travel Time Total |
Minutes |
Total time that discharged buses spent traversing the link. Accumulated whenever a bus discharges the link during the evaluation interval. |
Bus Trips |
---- |
Number of buses that have completely traversed the link during the evaluation interval. |
Content Average |
Vehicles |
Average number of vehicles on the link during the evaluation interval. Calculated as Travel Time Total divided by the duration of the evaluation interval. |
Content Current |
Vehicles |
A snapshot of the current number of vehicles on the link. |
Content Current Diagonal |
Vehicles |
A snapshot of the current number of diagonal-turning vehicles on the link. |
Content Current Left |
Vehicles |
A snapshot of the current number of left-turning vehicles on the link. |
Content Current Right |
Vehicles |
A snapshot of the current number of right-turning vehicles on the link. |
Content Current Through |
Vehicles |
A snapshot of the current number of through-moving vehicles on the link. |
Delay Control Per Vehicle |
Seconds/Vehicle |
Average time that a vehicle was delayed due to signals on the link. Calculated as Delay Control Total divided by the sum of Trips and Content Current. |
Delay Control Per Vehicle Left |
Seconds/Vehicle |
Average time that a left-turning vehicle was delayed due to signals on the link. Calculated as Delay Control Total Left divided by the sum of Trips Left and Content Current Left. |
Delay Control Per Vehicle Right |
Seconds/Vehicle |
Average time that a right-turning vehicle was delayed due to signals on the link. Calculated as Delay Control Total Right divided by the sum of Trips Right and Content Current Right. |
Delay Control Per Vehicle Through |
Seconds/Vehicle |
Average time that a through-moving vehicle was delayed due to signals on the link. Calculated as Delay Control Total Through divided by the sum of Trips Through and Content Current Through. |
Delay Control Total |
Minutes |
The total time vehicles are delayed due to signals on the link. The CORSIM User’s Guide(1) contains a detailed description of control delay. |
Delay Control Total Left |
Minutes |
The total time left-turning vehicles are delayed due to signals on the link. The CORSIM User’s Guide(1) contains a detailed description of control delay. |
Delay Control Total Right |
Minutes |
The total time right-turning vehicles are delayed due to signals on the link. The CORSIM User’s Guide(1) contains a detailed description of control delay. |
Delay Control Total Through |
Minutes |
The total time through-moving vehicles are delayed due to signals on the link. The CORSIM User’s Guide(1) contains a detailed description of control delay. |
Delay Queue Per Vehicle |
Seconds/Vehicle |
Average time that a vehicle was queued on the link. Calculated as Delay Queue Total divided by the sum of Trips and Content Current. |
Delay Queue Total |
Minutes |
Total time that vehicles were queued on the link. The CORSIM User’s Guide(1) contains a detailed description of queue delay. |
Delay Queue Total Left |
Minutes |
Total time that left-turning vehicles were queued on the link. The CORSIM User’s Guide(1) contains a detailed description of queue delay. |
Delay Queue Total Right |
Minutes |
Total time that right-turning vehicles were queued on the link. The CORSIM User’s Guide(1) contains a detailed description of queue delay. |
Delay Queue Total Through |
Minutes |
Total time that through-moving vehicles were queued on the link. The CORSIM User’s Guide(1) contains a detailed description of queue delay. |
Delay Stop Per Vehicle |
Seconds/Vehicle |
Average time that a vehicle was stopped on the link. Calculated as Delay Stop Total divided by the sum of Trips and Content Current. |
Delay Stop Total |
Minutes |
Total time that vehicles were stopped on the link. Accumulated during the evaluation interval. |
Delay Stop Total Left |
Minutes |
Total time that left-turning vehicles were stopped on the link. Accumulated during the evaluation interval. |
Delay Stop Total Right |
Minutes |
Total time that right-turning vehicles were stopped on the link. Accumulated during the evaluation interval. |
Delay Stop Total Through |
Minutes |
Total time that through-moving vehicles were stopped on the link. Accumulated during the evaluation interval. |
Delay Travel Per Distance Traveled |
Minutes/Mile |
Average time vehicles were delayed per each mile of travel. Calculated as Delay Travel Total divided by Travel Distance Total. |
Delay Travel Per Vehicle |
Seconds/Vehicle |
Average time that a vehicle was delayed on the link. Calculated as Delay Travel Total divided by the sum of Trips and Content Current. |
Delay Travel Per Vehicle Left |
Seconds/Vehicle |
Average time that a left-turning vehicle was delayed on the link. Calculated as Delay Travel Total Left divided by Trips Left. |
Delay Travel Per Vehicle Right |
Seconds/Vehicle |
Average time that a right-turning vehicle was delayed on the link. Calculated as Delay Travel Total Right divided by Trips Right. |
Delay Travel Per Vehicle Through |
Seconds/Vehicle |
Average time that a through-moving vehicle was delayed on the link. Calculated as Delay Travel Total Through divided by Trips Through. |
Delay Travel Total |
Minutes |
Total time that vehicles were delayed on the link. Calculated as Travel Time Total minus Move Time Total. |
Delay Travel Total Left |
Minutes |
Total time that left-turning vehicles were delayed on the link. Calculated as Travel Time Total Left minus Move Time Total Left. |
Delay Travel Total Right |
Minutes |
Total time that right-turning vehicles were delayed on the link. Calculated as Travel Time Total Right minus Move Time Total Right. |
Delay Travel Total Through |
Minutes |
Total time that through-moving vehicles were delayed on the link. Calculated as Travel Time Total Through minus Move Time Total Through. |
Emissions Rate CO |
Kilograms/Mile-Hour |
The CO emission rate due to all vehicles on the link. Calculated as Emissions Total CO divided by the duration of the evaluation interval. |
Emissions Rate HC |
Kilograms/Mile-Hour |
The HC emission rate due to all vehicles on the link. Calculated as Emissions Total HC divided by the duration of the evaluation interval. |
Emissions Rate NOx |
Kilograms/Mile-Hour |
The Nox emission rate due to all vehicles on the link. Calculated as Emissions Total Nox divided by the duration of the evaluation interval. |
Emissions Total CO |
Grams/Mile |
The total CO emissions per mile produced by all vehicles on the link. Accumulated during the evaluation interval. |
Emissions Total HC |
Grams/Mile |
The total HC emissions per mile produced by all vehicles on the link. Accumulated during the evaluation interval. |
Emissions Total Nox |
Grams/Mile |
The total Nox emissions per mile produced by all vehicles on the link. Accumulated during the evaluation interval. |
Fuel Consumption Total |
Gallons |
Total fuel consumed by all vehicles on the link. Calculated as the sum of the Fuel Consumption by fleet on the link. |
Lane Changes Total |
---- |
Total number of lane changes that have been completed on the link. Accumulated during the evaluation interval. |
Move Time Per Travel Time Ratio |
---- |
Ratio of the theoretical move time to the actual travel time for vehicles on the link. Calculated as Move Time Total divided by Travel Time Total. |
Move Time Per Travel Time Ratio Left |
---- |
Ratio of the theoretical move time to the actual travel time for left-turning vehicles on the link. Calculated as Move Time Total Left divided by Travel Time Total Left. |
Move Time Per Travel Time Ratio Right |
---- |
Ratio of the theoretical move time to the actual travel time for right-turning vehicles on the link. Calculated as Move Time Total Right divided by Travel Time Total Right. |
Move Time Per Travel Time Ratio Through |
---- |
Ratio of the theoretical move time to the actual travel time for through-moving vehicles on the link. Calculated as Move Time Total Through divided by Travel Time Total Through. |
Move Time Total |
Minutes |
Total theoretical time for discharged vehicles to travel the length of the link if moving unimpeded at the free-flow speed. Calculated as Travel Distance Total divided by the free-flow speed on the link. |
Move Time Total Left |
Minutes |
Total theoretical time for discharged left-turning vehicles to travel the length of the link if moving unimpeded at the free-flow speed. Calculated as Travel Distance Total Left divided by the free-flow speed on the link. |
Move Time Total Right |
Minutes |
Total theoretical time for discharged right-turning vehicles to travel the length of the link if moving unimpeded at the free-flow speed. Calculated as Travel Distance Total Right divided by the free-flow speed on the link. |
Move Time Total Through |
Minutes |
Total theoretical time for discharged through-moving vehicles to travel the length of the link if moving unimpeded at the free-flow speed. Calculated as Travel Distance Total Through divided by the free-flow speed on the link. |
Person Delay Total |
Person-Minutes |
Total delay to persons completely traversing the link. Calculated as Person Travel Time Total minus the division of Person Travel Distance Total by the free-flow speed on the link. |
Person Travel Distance Total |
---- |
Total distance traveled by persons on the link. Calculated as Travel Distance Total times the average number of persons per vehicle for vehicles on the link. |
Person Travel Time Total |
Minutes |
Total time that people were traveling the link. Calculated as Travel Time Total times the average number of persons per vehicle for vehicles on the link. |
Person Trips Total |
---- |
Total number of people traversing the link. Calculated as Trips times the average number of persons per vehicle for vehicles on the link. |
Phase Failures Total |
---- |
Total number of phase failures on the link. A phase failure occurs when vehicles queued at a signal are not all discharged in one cycle during the phase serving the queue. Accumulated during the evaluation interval. |
Speed Average |
Miles/Hour |
Average speed of a vehicle that has completely traversed the link. Calculated as Travel Distance Total divided by the Travel Time Total. |
Speed Average Left |
Miles/Hour |
Average speed of a left-turning vehicle that has completely traversed the link. Calculated as Travel Distance Total Left divided by the Travel Time Total Left. |
Speed Average Right |
Miles/Hour |
Average speed of a right-turning vehicle that has completely traversed the link. Calculated as Travel Distance Total Right divided by the Travel Time Total Right. |
Speed Average Through |
Miles/Hour |
Average speed of a through-moving vehicle that has completely traversed the link. Calculated as Travel Distance Total Through divided by the Travel Time Total Through. |
Stopped Vehicles |
Vehicles |
Number of discharged vehicles that stopped at least once on the link. Accumulated during the evaluation interval. |
Stopped Vehicles Percent |
---- |
Percentage of vehicles that have completely traversed the link that were forced to stop at least once while on the link. Calculated as Stopped Vehicles divided by Trips. |
Stopped Vehicles Percent Left |
---- |
Percentage of left-turning vehicles that have completely traversed the link that were forced to stop at least once while on the link. Calculated as the number of left-turning vehicles that stopped divided by Trips Left. |
Stopped Vehicles Percent Right |
---- |
Percentage of right-turning vehicles that have completely traversed the link that were forced to stop at least once while on the link. Calculated as the number of right-turning vehicles that stopped divided by Trips Right. |
Stopped Vehicles Percent Through |
---- |
Percentage of through-moving vehicles that have completely traversed the link that were forced to stop at least once while on the link. Calculated as the number of through-moving vehicles that stopped divided by Trips Through. |
Storage Percent |
---- |
Average percentage of link length that vehicles occupied. Calculated as Content Average times the average vehicle length divided by the link area. Link area is the sum of the lengths of the lanes in the link. |
Travel Distance Total |
Miles |
Total distance traveled by vehicles on the link. Accumulated during the evaluation interval and adjusted for vehicles entering the link via a right turn. |
Travel Distance Total Left |
Miles |
Total distance traveled by left-turning vehicles on the link. Calculated as Travel Distance Total times Trips Left divided by Trips. |
Travel Distance Total Right |
Miles |
Total distance traveled by right-turning vehicles on the link. Calculated as Travel Distance Total times Trips Right divided by Trips. |
Travel Distance Total Through |
Miles |
Total distance traveled by through-moving vehicles on the link. Calculated as Travel Distance Total times Trips Through divided by Trips. |
Travel Time Per Distance Traveled |
Minutes/Mile |
Average time for a vehicle to travel one mile. Calculated as Travel Time Total divided by Travel Distance Total. |
Travel Time Per Vehicle |
Seconds/Vehicle |
Average time for a vehicle to traverse the link. Calculated as Travel Time Total divided by the sum of Trips and Content Current. |
Travel Time Per Vehicle Left |
Seconds/Vehicle |
Average time for a left-turning vehicle to traverse the link. Calculated as Travel Time Total Left divided by Trips Left. |
Travel Time Per Vehicle Right |
Seconds/Vehicle |
Average time for a right-turning vehicle to traverse the link. Calculated as Travel Time Total Right divided by Trips Right. |
Travel Time Per Vehicle Through |
Seconds/Vehicle |
Average time for a through-moving vehicle to traverse the link. Calculated as Travel Time Total Through divided by Trips Through. |
Travel Time Total |
Minutes |
Total time that all discharged vehicles were on the link. Accumulated during the evaluation interval when a vehicle exits the link. |
Travel Time Total Left |
Minutes |
Total time that discharged left-turning vehicles were on the link. Accumulated during the evaluation interval when a left-turning vehicle exits the link. |
Travel Time Total Right |
Minutes |
Total time that discharged right-turning vehicles were on the link. Accumulated during the evaluation interval when a right-turning vehicle exits the link. |
Travel Time Total Through |
Minutes |
Total time that discharged through-moving vehicles were on the link. Accumulated during the evaluation interval when a through-moving vehicle exits the link. |
Trips |
---- |
Total number of vehicles that have traversed the link. A vehicle that completely traverses the link counts as one full trip. A vehicle that enters at the upstream end of the link but is extracted at a sink node counts as half of a trip, and a vehicle that enters from a source node and discharges at the downstream end of the link is counted as half a trip. Accumulated during the evaluation interval when a vehicle exits the link. |
Trips Left |
---- |
Total number of left-turning vehicles that have traversed the link. A vehicle that completely traverses the link counts as one full trip. A vehicle that enters at the upstream end of the link but is extracted at a sink node counts as half of a trip, and a vehicle that enters from a source node and discharges at the downstream end of the link is counted as half a trip. Accumulated during the evaluation interval when a vehicle exits the link. |
Trips Right |
---- |
Total number of right-turning vehicles that have traversed the link. A vehicle that completely traverses the link counts as one full trip. A vehicle that enters at the upstream end of the link but is extracted at a sink node counts as half of a trip, and a vehicle that enters from a source node and discharges at the downstream end of the link is counted as half a trip. Accumulated during the evaluation interval when a vehicle exits the link. |
Trips Through |
---- |
Total number of through-moving vehicles that have traversed the link. A vehicle that completely traverses the link counts as one full trip. A vehicle that enters at the upstream end of the link but is extracted at a sink node counts as half of a trip, and a vehicle that enters from a source node and discharges at the downstream end of the link is counted as half a trip. Accumulated during the evaluation interval when a vehicle exits the link. |
Vehicles Discharged |
Vehicles |
Total number of vehicles that have been discharged from the link. Accumulated during the evaluation interval when a vehicle exits the link. |
Vehicles Discharged Left |
Vehicles |
Total number of left-turning vehicles that have been discharged from the link. Accumulated during the evaluation interval when a vehicle exits the link. |
Vehicles Discharged Right |
Vehicles |
Total number of right-turning vehicles that have been discharged from the link. Accumulated during the evaluation interval when a vehicle exits the link. |
Vehicles Discharged Through |
Vehicles |
Total number of through-moving vehicles that have been discharged from the link. Accumulated during the evaluation interval when a vehicle exits the link. |
Volume |
Vehicles/Hour |
Average number of vehicles traversing the link, converted to an hourly value. Calculated as Trips divided by the duration of the evaluation interval. |
| CLASS NAME: Network | ||
|---|---|---|
MOE LABEL |
UNITS |
DESCRIPTION |
Content Average |
Vehicles |
Average number of vehicles in the network during the evaluation interval. Calculated as the Travel Time Total divided by the duration of the evaluation interval. |
Content Current |
Vehicles |
Snapshot of the current number of vehicles in the network. |
Delay Travel Per Distance Traveled |
Minutes/Mile |
Average delay per mile traveled. Calculated as Delay Travel Total divided by Travel Distance Total. |
Delay Travel Total |
Hours |
Total time that all vehicles were delayed in the network. Calculated as the Travel Time Total minus Move Time Total for the network. |
Move Time Per Travel Time Ratio |
---- |
Ratio of the theoretical move time to the actual travel time for vehicles in the network. Calculated as Move Time Total divided by Travel Time Total. |
Move Time Total |
Hours |
Total theoretical time for all vehicles traveling in the network if moving unimpeded at the free-flow speed. Calculated as Travel Distance Total divided by the free-flow speed, computed by link and summed for all links in the network. |
Speed Average |
Miles/Hour |
Average speed of a vehicle traveling in the network. Calculated as Travel Distance Total divided by Travel Time Total. |
Travel Distance Total |
Miles |
Total distance traveled by all vehicles. Calculated as the sum of Travel Distance Total for all subnetworks. |
Travel Time Per Distance Traveled |
Minutes/Mile |
Average time for a vehicle to travel one mile. Calculated as Travel Time Total divided by Travel Distance Total. |
Travel Time Total |
Hours |
Total travel time for all vehicles in the network. Calculated as the sum of Travel Time Total for all subnetworks. |
Table 37. Freeway network MOEs.
| CLASS NAME: Network_Freeway | ||
|---|---|---|
MOE LABEL |
UNITS |
DESCRIPTION |
Content Average |
Vehicles |
Average number of vehicles in the FRESIM subnetwork during the evaluation interval. Calculated as the sum of Content Average for all links in the subnetwork. |
Content Current |
Vehicles |
Snapshot of the current number of vehicles in the FRESIM subnetwork. Calculated as the sum of Content Current for all links in the subnetwork. |
Delay Travel Per Distance Traveled |
Minutes/Mile |
Average delay per mile traveled. Calculated as Delay Travel Total divided by Travel Distance Total. |
Delay Travel Total |
Hours |
Total time that all vehicles were delayed in the FRESIM subnetwork. Calculated as the sum of Delay Travel Total for all links in the subnetwork. |
Lane Changes Total |
---- |
Total number of lane changes that have been completed on all links in the FRESIM subnetwork. Calculated as the sum of Lane Changes Total for all links in the subnetwork. |
Move Time Per Travel Time Ratio |
---- |
Ratio of the theoretical move time to the actual travel time for vehicles in the FRESIM subnetwork. Calculated as (Travel Time Total minus Delay Travel Total) divided by Travel Time Total. |
Speed Average |
Miles/Hour |
Average speed of a vehicle traveling in the FRESIM subnetwork. Calculated as Travel Distance Total divided by Travel Time Total. |
Travel DistanceTotal |
---- |
Total distance traveled by all vehicles in the FRESIM subnetwork. Calculated as the sum of Travel Distance Total for links in the subnetwork. |
Travel Time Per Distance Traveled |
Minutes/Mile |
Average time for a vehicle to travel one mile in the FRESIM subnetwork. Calculated as Travel Time Total divided by Travel Distance Total. |
Travel Time Total |
Hours |
Total travel time for all vehicles in the FRESIM subnetwork. Calculated as the sum of Travel Time Total for all links in the subnetwork. |
Table 38. Surface street network MOEs.
| CLASS NAME: Network_Surface | ||
|---|---|---|
MOE LABEL |
UNITS |
DESCRIPTION |
Content Average |
Vehicles |
Average number of vehicles in the NETSIM subnetwork during the evaluation interval. Calculated as the sum of Content Average for all links in the subnetwork. |
Content Current |
Vehicles |
Snapshot of the current number of vehicles in the NETSIM subnetwork. Calculated as the sum of Content Current for all links in the subnetwork. |
Delay Queue Total |
Minutes |
Total time that vehicles in the NETSIM subnetwork were in queue. Calculated as the sum of Delay Queue Total on all links in the subnetwork. |
Delay Stop Total |
Minutes |
Total time that vehicles were stopped in the NETSIM subnetwork. Calculated as the sum of Delay Stop Total on all links in the subnetwork. |
Delay Travel Total |
Hours |
Total time that vehicles were delayed in the NETSIM subnetwork. Calculated as Travel Time Total minus Move Time Total. |
Lane Changes Total |
---- |
Total number of lane changes that have been completed on all links in the NETSIM subnetwork. Calculated as the sum of Lane Changes Total for all links in the subnetwork. |
Move Time Per Travel Time Ratio |
---- |
Ratio of the theoretical move time to the actual travel time for vehicles in the NETSIM subnetwork. Calculated as Move Time Total divided by Travel Time Total. |
Move Time Total |
Hours |
Total theoretical time for all vehicles traveling in the NETSIM subnetwork if moving unimpeded at the free-flow speed. Calculated as the sum of Move Time Total for all links in the subnetwork. |
Phase Failures Total |
---- |
Total number of phase failures in the NETSIM subnetwork. A phase failure occurs when vehicles queued at a signal are not all discharged in one cycle during the phase serving the queue. Calculated as the sum of Phase Failures Total on all links in the subnetwork. |
Speed Average |
Miles/Hour |
Average speed of a vehicle traveling in the NETSIM subnetwork. Calculated as Travel Distance Total divided by Travel Time Total. |
Stopped Vehicles Percent |
---- |
Percentage of vehicles that have completely traversed links in the NETSIM subnetwork that were forced to stop at least once while on a link. Calculated as the sum of Stopped Vehicles divided by sum of Trips for all links in the subnetwork. |
Storage Percent |
---- |
Average percentage of total subnetwork link length that vehicles occupied. Calculated as the sum of the product of Content Average and average vehicle length divided by the sum of link area for all links in the subnetwork. |
Travel Distance Total |
Miles |
Total distance traveled by all vehicles in the NETSIM subnetwork. Calculated as the sum of Travel Distance Total for all links in the subnetwork. |
Travel Time Per Distance Traveled |
Minutes/Mile |
Average time for a vehicle to travel one mile in the NETSIM subnetwork. Calculated as Travel Time Total divided by Travel Distance Total. |
Travel Time Total |
Hours |
Total travel time for all vehicles in the NETSIM subnetwork. Calculated as the sum of Travel Time Total for all links in the subnetwork. |
Trips |
---- |
Number of vehicles that have left the subnetwork via an exit node or sink node. Accumulated during the evaluation interval. |
| CLASS NAME: Section | ||
|---|---|---|
MOE LABEL |
UNITS |
DESCRIPTION |
Content Average |
Vehicles |
Average number of vehicles in the section. Calculated as the sum of Content Average on all links in the section. |
Delay Travel Total |
Minutes |
Total time that vehicles were delayed in the section. Calculated as the sum of Delay Travel Total on all links in the section. |
Speed Average |
Miles/Hour |
Average speed of a vehicle traveling in the section. Calculated as Travel Distance Total divided by Travel Time Total. |
Stopped Vehicles Percent |
---- |
Percentage of vehicles that have completely traversed links in the section that were forced to stop at least once while on a link. Calculated as the sum of Stopped Vehicles for the links in the section divided by Trips. |
Travel Distance Total |
Miles |
Total distance traveled by all vehicles in the NETSIM subnetwork. Calculated as the sum of Travel Distance Total for links in the section. |
Travel Time Per Vehicle |
Seconds/Vehicle |
Average travel time for a vehicle in the section. Calculated as Travel Time Total divided by Trips. |
Travel Time Total |
Minutes |
Total travel time for all vehicles in the section. Calculated as the sum of Travel Time Total for all links in the section. |
Trips |
---- |
Total number of vehicles that have completely traversed the links in the section. Calculated as the sum of Trips on all links in the section. |
Table 40. Link vehicle type MOEs.
| CLASS NAME: Vehicle_Type_Link | ||
|---|---|---|
MOE LABEL |
UNITS |
DESCRIPTION |
Emissions Total CO |
Grams/Mile |
The total CO emissions per mile produced by all vehicles of the specified type on the link. Accumulated during the evaluation interval. |
Emissions Total HC |
Grams/Mile |
The total HC emissions per mile produced by all vehicles of the specified type on the link. Accumulated during the evaluation interval. |
Emissions Total NOx |
Grams/Mile |
The total Nox emissions per mile produced by all vehicles of the specified type on the link. Accumulated during the evaluation interval. |
Fuel Consumption Total |
Gallons |
Total fuel consumed by all vehicles of the specified type on the link. Accumulated during the evaluation interval. |
Fuel Efficiency |
Miles/Gallon |
Average distance traveled per gallon of fuel for vehicles of the specified type on the link. Calculated for each vehicle type as Travel Distance Total divided by Fuel Consumption Total. |
Speed Average |
Miles/Hour |
Average speed of vehicles of the specified type on the link. Calculated as Travel Distance Total divided by Travel Time Total. |
Travel Distance Total |
Feet |
Total distance traveled by all vehicles of the specified type on the link. Accumulated during the evaluation interval. |
Travel Time Total |
Seconds |
Total travel time for vehicles of the specified type on the link. Accumulated during the evaluation interval. |
Vehicles Discharged |
Vehicles |
Number of vehicles of the specified type that have discharged from the link. Accumulated during the evaluation interval. |
Table 41. Freeway network vehicle type MOEs.
| CLASS NAME: Vehicle_Type_Network_Freeway | ||
|---|---|---|
MOE LABEL |
UNITS |
DESCRIPTION |
Emissions Total CO |
Grams/Mile |
The total CO emissions per mile produced by all vehicles of the specified type in the FRESIM subnetwork. Accumulated during the evaluation interval. |
Emissions Total HC |
Grams/Mile |
The total HC emissions per mile produced by all vehicles of the specified type in the FRESIM subnetwork. Accumulated during the evaluation interval. |
Emissions Total NOx |
Grams/Mile |
The total Nox emissions per mile produced by all vehicles of the specified type in the FRESIM subnetwork. Accumulated during the evaluation interval. |
Fuel Consumption Total |
Gallons |
Total fuel consumed by all vehicles of the specified type in the FRESIM subnetwork. Accumulated during the evaluation interval. |
Fuel Efficiency |
Miles/Gallon |
Average distance traveled per gallon of fuel for vehicles of the specified type in the FRESIM subnetwork. Calculated as the total number of miles traveled in the FRESIM subnetwork divided by Fuel Consumption Total. |
Table 42. Surface street network vehicle type MOEs.
| CLASS NAME: Vehicle_Type_Network_Surface | ||
|---|---|---|
MOE LABEL |
UNITS |
DESCRIPTION |
Emissions Total CO |
Grams/Mile |
The total CO emissions per mile produced by all vehicles of the specified type in the NETSIM subnetwork. Accumulated during the evaluation interval. |
Emissions Total HC |
Grams/Mile |
The total HC emissions per mile produced by all vehicles of the specified type in the NETSIM subnetwork. Accumulated during the evaluation interval. |
Emissions Total NOx |
Grams/Mile |
The total NOx emissions per mile produced by all vehicles of the specified type in the NETSIM subnetwork. Accumulated during the evaluation interval. |
Fuel Consumption Total |
Gallons |
Total fuel consumed by all vehicles of the specified type in the NETSIM subnetwork. Accumulated during the evaluation interval. |
Fuel Efficiency |
Miles/Gallon |
Average distance traveled per gallon of fuel for vehicles of the specified type in the NETSIM subnetwork. Calculated as the total number of miles traveled in the NETSIM subnetwork divided by the Fuel Consumption Total. |
| CLASS NAME: Conflict_Data | ||
|---|---|---|
MOE LABEL |
UNITS |
DESCRIPTION |
Conflicts Total |
---- |
Total Number of Conflicts. |
Conflicts Total Auto Auto |
---- |
Total Number of Auto/Auto Conflicts. |
Conflicts Total Auto Truck |
---- |
Total Number of Auto/Truck Conflicts. |
Conflicts Total Truck Auto |
---- |
Total Number of Truck/Auto Conflicts. |
Conflicts Total Truck Truck |
---- |
Total Number of Truck/Truck Conflicts. |