2010 Traffic Incident Management Self-Assessment (TIM SA) National Analysis Report
Background and Methodology
The TIM SA was developed in 2002 by the American Transportation Research Institute (ATRI) under contract to the Federal Highway Administration (FHWA). The objective of the TIM SA was to provide a tool by which State, regional and local TIM practitioners could assess progress in achieving successful multi-agency traffic incident management programs. At the local level, the TIM SA provided TIM program managers a way to identify areas where additional resources (human, financial, technical) could be deployed to improve program performance. At the national level, the aggregated TIM SA results provide FHWA with a means for evaluating broader program areas on which to focus national program initiatives.
The TIM SA was launched in 2003 in the nation's top 75 urban areas. Those 75 census areas were subsequently redefined by FHWA Division Offices into 80 operational areas for the TIM SA. Initially intended to be completed on a biennial basis, the TIM SA process was modified in 2006 so that all 80 areas were requested to complete the assessment on an annual basis. Since that time, additional areas beyond the 80 have taken part in the annual TIM SA process.
In 2007 FHWA initiated a TIM SA Revision to better align the TIM SA with current TIM state of practice. To bring greater clarity to some questions and eliminate duplication in others, the questions were revised and the total number of TIM SA questions was reduced from 34 to 31. Although the TIM SA Revision was completed in 2008, the revised TIM SA was not deployed until 2009.
The 31 questions are grouped into three sections; Strategic, Tactical and Support. In order to benchmark progress for each question and the three sections over time, the initial assessments completed in 2003, 2004 and one in 2005 (78 in total) have been used each year as the Baseline. Due to the changes resulting from the TIM SA Revision, baseline data was recalculated in 2010 to reflect the combined, eliminated and new questions. This was particularly necessary for the new questions which, prior to the 2009 assessment, had no established baseline scores. The score achieved for each of the new questions in 2009 is now its baseline and is part of the overall baseline calculation for each section.
Prior to the Revision, the TIM SA was scored by participants using a numeric value. The new scoring process (described in Table 1) asked participants to evaluate program progress using High, Medium and Low. Supplemental scores were added to clarify specific program progress based on an initial score of Low or Medium. The supplemental scores are described in Table 2.
| Score | Description |
|---|---|
| LOW | Little to no progress in this area.
|
| MEDIUM | Progress in this area is moderate to good.
|
| HIGH | Progress in this area is strong to outstanding.
|
| Score | Description |
|---|---|
| LOW | No Activity
|
| LOW | Some Activity
|
| MEDIUM | Fair Level of Activity
|
| MEDIUM | Good Level of Activity
|
Results – Overall
A total of 92 assessments were completed in 2010 with an overall score of 63.9 percent, representing a 37.8 percent increase over the Baseline (Table 3). Scores for the questions in Strategic show the greatest percentage change (67.2%) over the Baseline and the highest section score was achieved in Tactical (71.5%).
| Section | # of Questions | Mean Score Baseline | Mean Score 2010 | % Change in scores from Baseline | Section Weights |
|---|---|---|---|---|---|
| Strategic | 11 | 33.00% | 55.20% | 67.20% | 30% |
| Tactical | 13 | 60.90% | 71.50% | 17.40% | 40% |
| Support | 7 | 40.50% | 62.60% | 54.60% | 30% |
| Overall Total | 31 | 46.40% | 63.90% | 37.80% | 100% |
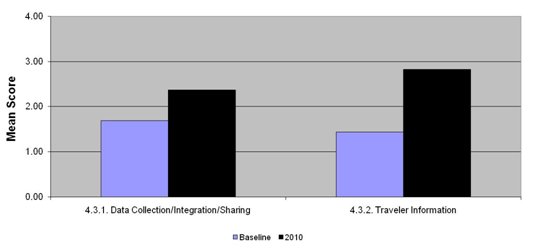
The 31 TIM SA questions are further divided into category-specific subsections. The revised TIM SA has seven subsections, down from the original eight. Table 4 shows the overall scores by subsection for the 2010 TIM SA and the Baseline, along with the percentage change from the Baseline. As has been the case in previous years, the five questions in the Strategic section on TIM Performance Measurement (4.1.3) collectively achieved the highest percentage change from the Baseline (118.9 percent).
Traveler Information (4.3.2), a subsection of Support, had the second largest increase over the Baseline (95.6 percent). The remaining subsections of questions showed significant increases over the Baseline, though Policies and Procedures (4.2.1) had the smallest percentage increase (9.8 percent) of the subsections. Policies and Procedures had the highest score in the Baseline (2.70). This high baseline affords less opportunity for substantial percentage increases in the score year to year.
| Sections and Subsections | No. | Mean Score |
Mean Score Range = 0 to 4 2010 (n=92) |
% Change in 2010 from Baseline |
|---|---|---|---|---|
| Strategic | 4.1 | |||
| Formal TIM Programs | 4.1.1 | 1.53 | 2.12 | 38.50% |
| Multi-agency TIM Teams | 4.1.2 | 1.81 | 2.71 | 49.30% |
| TIM Performance Measurement | 4.1.3 | 0.84 | 1.84 | 118.90% |
| Tactical | 4.2 | |||
| Policies and Procedures | 4.2.1 | 2.7 | 2.97 | 9.80% |
| Responder and Motorist Safety | 4.2.2 | 2.01 | 2.69 | 33.90% |
| Support | 4.3 | |||
| Data Collection/ Integration/Sharing | 4.3.1 | 1.69 | 2.38 | 40.60% |
| Traveler Information | 4.3.2 | 1.45 | 2.83 | 95.60% |
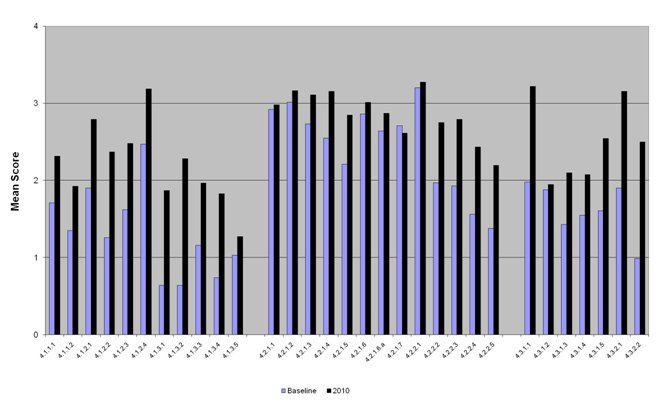
Scores for all 31 questions for both the Baseline and the 2010 assessments are shown in Figure 1. Following Figure 1 is a section-by-section analysis of the change in TIM SA scores from the Baseline to 2010.
Figure 1. Mean Scores for All Questions Baseline – 2010
Results – Strategic
Mean Score: 55.2% (16.6 of 30 points)
The means for organizing and sustaining a TIM program comprise the Strategic program elements. The continued climb in scores in this section since 2003 (Table 5) illustrates the evolution of TIM programs from ad hoc operations to more formalized and sustained programs.
| Year | Mean Score |
|---|---|
| Baseline1 | 33 |
| 2006 | 48.5 |
| 2007 | 48.8 |
| 2008 | 51 |
| 2009 | 51.1 |
| 20102 | 55.2 |
| 1 The baseline was recalculated in 2010
to incorporate the changes from the TIM SA Revision. Prior to the
TIM SA Revision, the Baseline for Strategic was 36.3. 2 2009 was the first year of the revised TIM SA questions, including questions which had not previously been asked and therefore had no baseline score. The scores achieved by those questions in 2009 became the baseline for each and are now part of the recalculated baseline in 2010. |
|
There were no changes to the Strategic subsections as part of the TIM SA Revision. However, under each of the three subsections (Formal Traffic Incident Management Programs, Multi-Agency TIM Teams and TIM Performance Measures) the questions were revised to more accurately reflect today's multi-agency coordinated approach to TIM.
The more evolved TIM programs are supported by multi-agency agreements or Memoranda of Understanding (MOU) which, in many cases, clearly define the common objectives, roles and responsibilities for each partner agency. The existence of such agreements or MOUs was the focus of the questions in the Formal Traffic Incident Management Programs subsection.
The Multi-Agency TIM Teams subsection targeted TIM team formal meetings, training, post-incident debriefings and planning for special events. Questions on specific types of training have been added to reflect current state of TIM practice, including NIMS training and training on the National Unified Goal (NUG) for Traffic Incident Management. Several non-scoring questions were added to the TIM SA this year to further quantify current state of practice, including one on the types of other training being offered through the multi-agency TIM team.
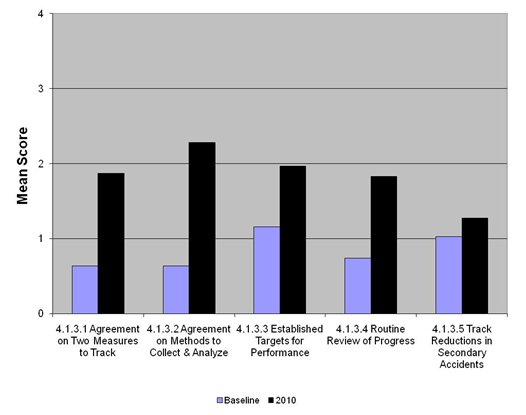
Questions in the subsection on TIM Performance Measurement targeted the two measures identified in FHWA's TIM Performance Measures Focus States Initiative (TIM PM FSI); Roadway Clearance Time and Incident Clearance Time. The TIM PM FSI also added a third measure on reduction of secondary incidents, which is now tracked through the TIM SA in question 4.1.3.5.
Figure 2 shows the change from the Baseline for each of the three subsections in Strategic.
Figure 2. Strategic
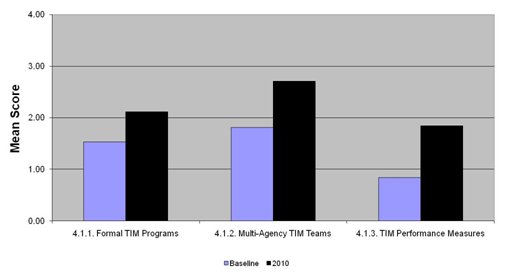
Table 6 shows the mean score (Baseline and 2010) for each of the 11 questions in Strategic, the percentage of assessments rating this question three or higher (indicating success) and the percentage increase in the mean score in 2010 from the Baseline.
| Question Number | Question | Mean Score Range = 0 to 4 Baseline | Mean Score Range = 0 to 4 2010 | % of Assessments Scoring 3 or Higher Baseline |
% of Assessments Scoring 3 or Higher 2010 |
% Change in 2010 Mean Scores from Baseline |
|---|---|---|---|---|---|---|
| 4.1.1.1 | Is the TIM program supported by multi-agency agreements/memoranda of understanding detailing coordinated objectives, roles and responsibilities and safe, quick clearance goals? | 1.71 | 2.32 | 18% | 43% | 35.40% |
| 4.1.1.2 | Is there a process in place to ensure the continuity of these agreements/memoranda of understanding through integrated planning and budgeting across and among participating agencies? | 1.35 | 1.92 | 12% | 35% | 42.50% |
| 4.1.2.1 | Have a formalized TIM multi-agency team or task force which meets regularly to discuss and plan for TIM activities? | 1.9 | 2.79 | 28% | 62% | 47.00% |
| 4.1.2.2 | Conduct training?
|
1.26 | 2.37 | 9% | 61% | 88.10% |
| 4.1.2.3 | Conduct post-incident debriefings? | 1.62 | 2.48 | 18% | 50% | 53.00% |
| 4.1.2.4 | Conduct planning for special events?
|
2.47 | 3.18 | 35% | 86% | 28.90% |
| 4.1.3.1 | Have multi-agency agreement on the two performance measures being tracked?
|
0.64 | 1.87 | 3% | 35% | 192.10% |
| 4.1.3.2 | Has the TIM program established methods to collect and analyze the data necessary to measure performance in reduced roadway clearance time and reduced incident clearance time? | 0.64 | 2.28 | 3% | 45% | 256.70% |
| 4.1.3.3 | Have targets (i.e. time goals) for performance of the two measures? | 1.16 | 1.97 | 4% | 35% | 69.60% |
| 4.1.3.4 | Routinely review whether progress is made in achieving the targets? | 0.74 | 1.83 | 3% | 30% | 146.80% |
| 4.1.3.5 | Track performance in reducing secondary incidents? | 1.03 | 1.27 | 8% | 11% | 23.50% |
For each question, respondents were asked to insert additional clarifying comments related to that topic. The information was intended to provide added insight into TIM program details. Additionally, several non-scoring supplemental questions were posed for the first time in the 2010 TIM SA to further elucidate TIM program trends.
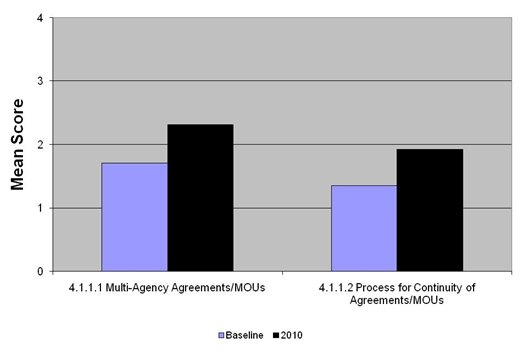
As reflected in the scores and shown in Figure 3, there has been greater success in the development of multi-agency agreements and MOUs than in ensuring the continuity of the agreements through integrating planning and budgeting across participating agencies. Part of the challenge in sustainability of the agreements may be based on the depth of understanding of the agreements/MOUs among responders. A supplemental, non-scored question asked respondents about the existence of a process to train responders and supervisors on the contents of the agreements/MOUs. Nearly 60 percent of TIM SA respondents indicated that there was no process in place to train those charged with executing the agreements on their contents.
Figure 3. Formal Traffic Incident Management Programs
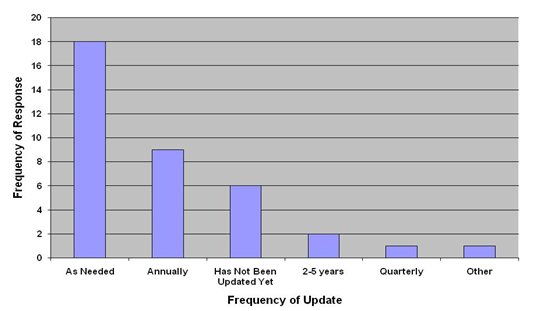
Another supplemental, non-scored question asked how frequently the agreements/MOUs were updated, with "as needed" being the most frequently cited response. The absence of a planned, systematic review and update of the plan may also hinder its continuity. Figure 4 shows the distribution of responses across the timeline for updating the agreements/MOUs.
Figure 4. Question 4.1.1.2.a – How often is the multi-agency
agreement/MOU updated?
Average scores for the second subsection, Multi-Agency TIM Teams (4.1.2), have increased 49.3 percent over the Baseline. Figure 5 displays the scores compared to Baseline. The highest mean score was achieved in planning for special events (4.1.2.4) with a mean score of 3.18. Planning for special events was the third highest scoring question overall in the 2010 TIM SA and is the question with the highest percentage (86%) of scores 3 or higher.
The score for this question is the aggregated average of individual scores in planning for the following types of events: Construction and Maintenance; Sporting Events, Concerts, Conventions; Weather-related Events and Catastrophic Events. Among those categories, Sporting Events, Concerts, Conventions (4.1.2.4.b) and Construction and Maintenance (4.1.2.4.a) achieved the highest mean scores of 3.32 and 3.30, respectively. The advanced notice of these events affords opportunities for planning, resulting in higher scores.
Figure 5. Multi-agency TIM Teams
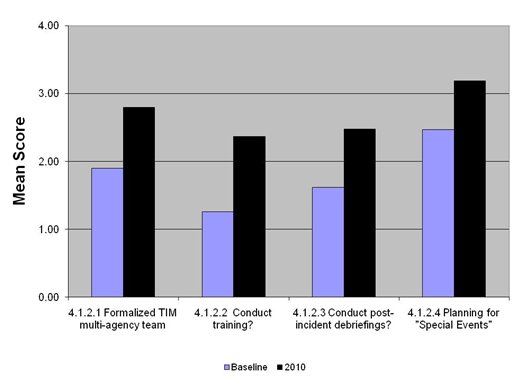
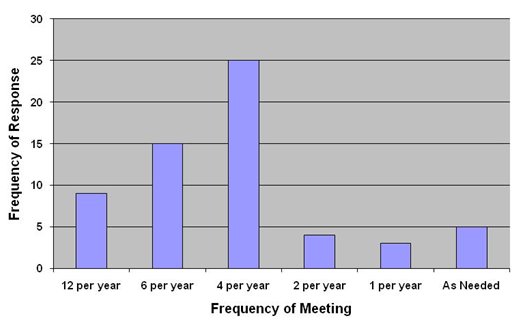
The presence of a formalized multi-agency TIM team which regularly meets (4.1.2.1) received a mean score of 2.79, up 47 percent from the Baseline. This year a non-scoring question was added to ask how often the TIM team meets. Figure 6 shows that quarterly was the most frequently cited response.
Figure 6. Question 4.1.2.1.a – How frequently are TIM
team meetings held?
Multi-agency TIM training is critical to ensure that responders understand each respective agency's roles and responsibilities at the scene. Additionally, ongoing training serves to maintain a constant learning base to mitigate the impacts of turnover among responders. Many TIM teams utilize team meetings for training and are benefiting from expanded course offerings being provided through FHWA, the I-95 Corridor Coalition, the Emergency Responder Safety Institute and the Strategic Highway Research Program (SHRP 2) TIM Responder Course, among others. Three categories of training were queried in the TIM SA and all three experienced increased scores in 2010 from 2009:
- National Incident Management System (NIMS) Training up to 2.62 from 2.50;
- Training on the core objectives and strategies of the TIM National Unified Goal up to 2.00 from 1.69; and
- Other training up to 2.49 from 2.30.
Based on the comments submitted, it appears that the NIMS training being offered is still the domain of the individual responder disciplines and is typically not provided as multi-agency training.
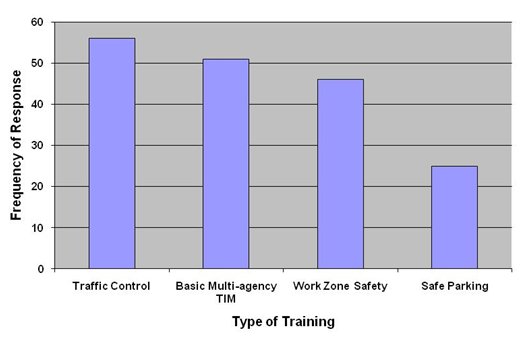
This year a supplemental, non-scoring question was added to identify the types of "Other" training being offered, with four options offered:
- Basic Multi-agency TIM Training
- Traffic Control
- Work Zone Safety
- Safe Parking
Figure 7 shows the frequency of responses for "Other" training being offered.
Figure 7. Question 4.1.2.2.c – Other types of training
conducted
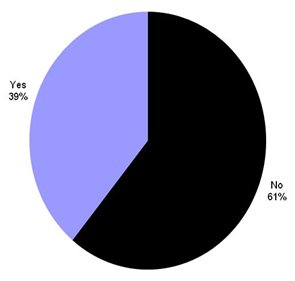
After steadily increasing for the past few years, post-incident debriefing scores (4.1.2.3) decreased from a mean score of 2.53 in 2009 to 2.48 in 2010. The comments indicated a wide range of policies governing debriefs from no formal process for scheduling a debrief, to incident debriefs being the responsibility of the individual agencies but not multi-agency activities, to regularly scheduled debriefs held as part of multi-agency TIM team meetings. To bring greater clarity to what triggers a post-incident debrief and how frequently debriefs are held, several supplemental, non-scoring questions were added for 2010.
As shown in Figure 8, 61 percent of TIM SA respondents indicated that there was not a defined incident threshold that mandates a post-incident multi-agency review or debrief. Where a threshold was established, it was often set at "major" incident which can include a road closure. In those locations where there was an expedited or incentivized clearance program for large commercial vehicle and other incidents, each activation of the clearance program triggered a post-incident debrief. Nearly 50 percent of TIM SA respondents indicated that at least one post-incident review was held during the previous 12 months, with the average number of reviews in the range of 5-12 per year.
Figure 8. Question 4.1.2.3.a – Incident level or threshold
at which mandatory multi-agency post-incident reviews are conducted?
TIM Performance Measurement (4.1.3) scores continue to be the lowest in the TIM SA. However, progress is being made; the 2010 TIM SA is the first time that one of the five questions in this subsection has scored above 2. Given the low Baseline scores in this subsection, these questions also continue to achieve the greatest percentage increase over the Baseline (Figure 9). Though almost identical in mean score, multi-agency agreement on tracking Roadway Clearance Time achieved a slightly higher score (1.95) than did the other measure being tracked, Incident Clearance Time (1.79).
Recognizing that TIM programs are tracking additional data beyond the two FHWA-identified measures (above), a supplemental, non-scoring question was added to quantify the other data being collected for TIM performance measures. Just over half (53%) of the TIM SA respondents indicated that additional performance data was being collected, in many cases associated with safety service patrol activities (response time, number of assists, types of incidents, location, roadway blockage).
The third TIM performance measure being tracked is reduction of secondary incidents (4.1.3.5). This measure saw a strong increase in mean score of 23.5 percent from 2009 to 2010 (2009 was the first year to query the existence of this measure). Numerous comments provided indicated a need for guidance on how to a) define a secondary incident and b) track reductions in their occurrence. Several respondents acknowledged the importance of protecting the traffic queue in an effort to reduce secondary incidents but the definitions and data are not well established. Work by FHWA to identify and promote where success is being achieved in tracking and reducing secondary incidents should lead to increased scores for this question in subsequent years. One of the challenges, as raised again in this year's comments, is the concern over liability arising from defining secondary incidents which might be prevented by TIM responder actions.
Despite the addition of the secondary incident question in 2009 and its low Baseline score, the mean score for TIM Performance Measurement (1.84) has more than doubled since the Baseline (0.84).
Figure 9. Traffic Incident Management Performance Measurement
The TIM programs achieving the highest scores in Strategic program areas are listed alphabetically in Table 7.
| TIM Program |
|---|
|
Results – Tactical
Mean Score: 71.5% (28.6 of 40 points)
The questions in Tactical focused on operational or on-scene activities and policies. There were two subsections in Tactical:
- Policies and Procedures
- Responder and Motorist Safety
As a group, the questions in Tactical continued to score the highest in the TIM SA, achieving a 71.5 percent in 2010, more than 17 percent over the Baseline (Table 8).
| Year | Mean Score |
|---|---|
| Baseline3 | 60.9 |
| 2006 | 65 |
| 2007 | 66 |
| 2008 | 66.2 |
| 2009 | 68.8 |
| 20104 | 71.5 |
| 3 The baseline was recalculated
in 2010 to incorporate the changes from the TIM SA Revision. Prior
to the TIM SA Revision, the Baseline for Tactical was 57.6. 4 2009 was the first year of the revised TIM SA questions, including questions which had not previously been asked and therefore had no baseline score. The scores achieved by those questions in 2009 became the baseline for each and are now part of the recalculated baseline in 2010. |
|
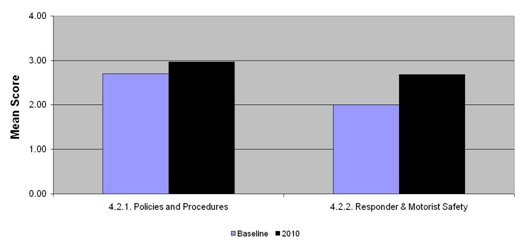
Figure 10 shows the change from the Baseline for the two subsections in Tactical. Though the questions in Policies and Procedures (4.2.1) had the highest average score (2.97) of the two subsections, Responder and Motorist Safety (4.2.2) achieved a higher percentage (33.9) increase over the Baseline.
Figure 10. Tactical
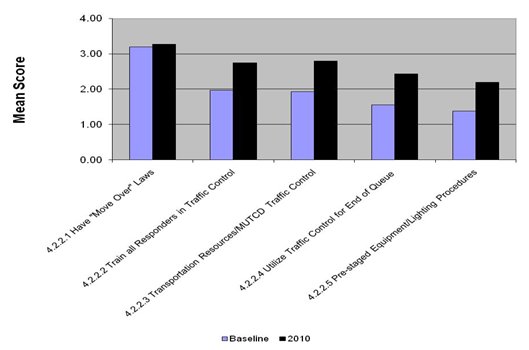
Prior to the TIM SA Revision, quick clearance laws and polices were queried in one question in the subsection on Response and Clearance Policies and Procedures. This prevented the ability to quantify which specific safe, quick clearance (SQC) laws had been promulgated and where efforts were needed to advance SQC. To address this deficiency, the TIM SA Revision created three separate questions on SQC laws:
- Authority Removal (4.2.1.1);
- Driver Removal (4.2.1.2);
- Move Over (4.2.2.1).
As shown in Table 9, question 4.2.2.1 on Move Over laws received the highest mean score (3.27) in the Tactical section, indicating a high degree of success in promulgating Move Over laws. Question 4.2.1.2 on Driver Removal was not far behind with a mean score in 2010 of 3.16. Move Over and Driver Removal also scored first and fourth overall, respectively, on the 2010 TIM SA. The third SQC law, Authority Removal, scored 2.98 in 2010.
What the comments submitted with all three questions made clear was the continued need for SQC outreach and education, for motorists and responders alike. Though confusion over the three SQC laws being queried in the TIM SA was mitigated through the TIM SA Revision process, there was still confusion over the difference between Authority Removal and Driver Removal. Furthermore, though there has been success in passing Move Over legislation, respondents indicated that the motoring public is unaware of, does not understand or simply ignores the law, and it is difficult to enforce. Anecdotally, it has also been reported that even in those locations where Move Over is being enforced on the roadway, citations are not being upheld by the court system.
Improving this situation is a key focus of the FHWA-sponsored TIM Decision Maker Education and Outreach initiative which has among its objectives to:
- Encourage State and local governments to adopt and promote SQC laws and policies;
- Educate State and local decision makers on the best strategies for implementing SQC laws and policies;
- Provide tools for TIM practitioners to educate the public and change driver behavior to improve compliance with the SQC laws and policies.
| Question Number | Question | Mean Score Range = 0 to 4 Baseline |
Mean Score Range = 0 to 4 2010 |
% of Assessments Scoring 3 or Higher Baseline |
% of Assessments Scoring 3 or Higher 2010 |
% Change in 2010 from Baseline Scores |
|---|---|---|---|---|---|---|
| 4.2.1.1 | Have "authority removal" laws allowing pre-designated responders to remove disabled or wrecked vehicles and spilled cargo? | 2.92 | 2.98 | 67% | 72% | 2.00% |
| 4.2.1.2 | Have "driver removal" laws which require drivers involved in minor crashes (not involving injuries) to move vehicles out of the travel lanes? | 3.01 | 3.16 | 71% | 76% | 5.10% |
| 4.2.1.3 | Use a safety service patrol for incident and emergency response? | 2.73 | 3.11 | 67% | 78% | 13.90% |
| 4.2.1.4 | Utilize the Incident Command System? | 2.55 | 3.15 | 58% | 76% | 23.60% |
| 4.2.1.5 | Have response equipment pre-staged for timely response? | 2.21 | 2.85 | 41% | 62% | 28.90% |
| 4.2.1.6 | Identify and type resources so that a list of towing, recovery and hazardous materials response operators (including operator capabilities and special equipment) is available for incident response and clearance? | 2.86 | 3.01 | 67% | 72% | 5.30% |
| 4.2.1.6.a | a. Is that list organized so that resources are identified and deployed based on incident type and severity? | 2.64 | 2.87 | 58% | 66% | 8.70% |
| 4.2.1.7 | Have specific policies and procedures for hazmat and fatal accident response that also address maintaining traffic flow around the incident? | 2.71 | 2.61 | 62% | 63% | -3.50% |
| 4.2.2.1 | Have "move over" laws which require drivers to slow down and if possible move over to the adjacent lane when approaching workers or responders and equipment in the roadway? | 3.2 | 3.27 | 85% | 80% | 2.20% |
| 4.2.2.2 | Train all transportation responders in traffic control following MUTCD guidelines? | 1.97 | 2.75 | 28% | 64% | 39.60% |
| 4.2.2.3 | Utilize transportation resources to conduct traffic control procedures in compliance with the MUTCD? | 1.93 | 2.79 | 27% | 60% | 44.70% |
| 4.2.2.4 | Utilize traffic control procedures for the end of the incident traffic queue? | 1.56 | 2.43 | 17% | 48% | 56.10% |
| 4.2.2.5 | Have mutually understood equipment staging and emergency lighting procedures on-site to maximize traffic flow past an incident while providing responder safety? | 1.38 | 2.2 | 14% | 42% | 59.10% |
The only question in the 2010 TIM SA to experience a lower mean score than its Baseline score was question 4.2.1.7 on specific policies and procedures for hazmat and fatal accident response (Figure 11). This continued a trend evident over the past several years of the TIM SA. In the 2010 TIM SA, respondents were asked to rate progress in policies and procedures for hazmat response separate from fatal accident response. The score for question 4.2.1.7 represented the composite score of the two; however, both questions achieved nearly identical scores (2.62 for hazmat, 2.61 for fatal). This breakout of the two was intended to identify if one type of incident was creating greater downward pressure on the score. This might have indicated a specific area where additional guidance was needed. However, it appears that there was not a discernible difference between the two in terms of their scores nor based on the comments provided for each.
As has been noted in previous reports, while there continued to be success (as evidenced by increasing scores) in the identification and typing of resources for incident and hazardous materials response (4.2.1.6), the effective deployment of those resources through specific hazardous materials and fatal incident response policies and procedures was lagging behind. However, this year's score was an increase over the 2009 mean score by roughly five percent.
Figure 11. Policies and Procedures
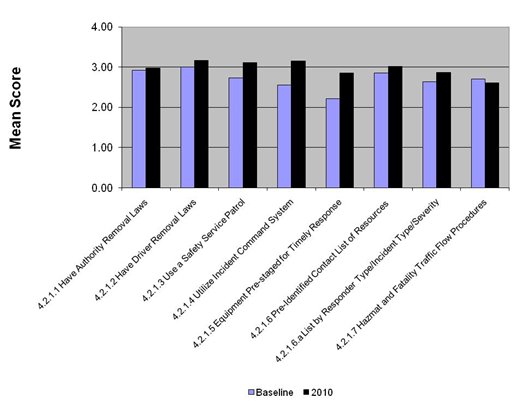
The question on the use of safety service patrols for incident and emergency response (4.2.1.3) achieved a mean score of 3.11, one of only eight questions on the 2010 TIM SA to score above 3 points. Two years ago nearly 10 percent of TIM SA respondents scored this question 0, indicating little, if any, progress toward the use of safety service patrols by those locations. This year, the percentage of TIM SA respondents scoring this question 0 is less than seven percent.
Encouraging the use of Full Function Service Patrols is another key objective of the FHWA-sponsored TIM Decision Maker Education and Outreach initiative. To better quantify current state of practice in safety service patrols, including achievement of "full function" status, the 2010 TIM SA included a supplemental, non-scoring question asking respondents with a safety service patrol (SSP) to provide additional details on the SSP including:
- Lane miles covered;
- Hours of operation;
- Services provided;
- Availability of staff 24/7 for immediate response.
For those programs that provided the lane miles covered by the SSP, the average range is approximately 150 to 200 miles. Less than 30 percent of the programs report 24/7 coverage, with the remainder providing service during peak travel times. Services offered ranged from basic motorist assist (change flat tire, provide gas) to full incident response and traffic control. A more detailed and complete inventory of SSPs is being assembled as part of the TIM Decision Maker Education and Outreach initiative and will be available in 2011.
Incident Command System (ICS) training is a NIMS requirement for all incident responders and the increasing score for question 4.1.2.2.a (Figure 12) indicates that NIMS training is continuing for multi-agency responders. Therefore, the high mean score (3.15) for question 4.2.1.4 on use of ICS was expected; just two of the 92 TIM SA scored this question lower than 3. However, a review of the comments (primarily submitted by those scoring this question 3 or higher) indicated that ICS still remains the domain of public safety responders and there was less understanding of and adherence to ICS among non-public safety responders.
Figure 12. Responder and Motorist Safety
Safely moving traffic past an incident scene is critical for protecting the safety of responders and motorists. In addition to Move Over laws, proper traffic control procedures greatly enhance incident scene safety. Question 4.2.2.2 asks about training transportation responders in traffic control procedures following the guidelines described in the Manual on Uniform Traffic Control Devices (MUTCD). With a mean score of 2.75, nearly two-thirds (64%) of the TIM SA respondents scored this question 3 or higher. Although the question specifically calls out training for transportation responders, the comments indicated that there was involvement in the training by law enforcement in some areas and a desire to have increased agency participation in the training by all responder disciplines. The training curriculum being finalized as part of the SHRP 2 TIM Responder Training course will provide an additional avenue for receiving multi-agency training in MUTCD-compliant traffic control procedures.
The lowest scoring question in the Responder and Motorist Safety subsection dealt with mutually understood equipment staging and lighting procedures to maximize traffic flow around the incident while protecting responders (4.2.2.5). Though it has increased nearly 60 percent over the Baseline, the relatively low mean score of 2.20 points to continued challenges in achieving consensus on how responder equipment should be staged and how responder lights should be deployed and eventually shed as the incident moves toward clearance. The comments provided additional evidence of this divergence of opinion. What has been anecdotally reported by incident responders for years – that fire, law enforcement and transportation disagree on how fire equipment should be deployed to protect responders – is still being mentioned in the comments as the basis for lower scores on this question. That this situation still exists 20+ years into coordinated traffic incident management practice provides ample justification for expanded multi-agency TIM training so that responders fully understand the roles, responsibilities and scene priorities of the respective disciplines.
The TIM programs achieving the highest scores in Tactical program areas are listed alphabetically in Table 10.
| TIM Program |
|---|
|
Results – Support
Mean Score: 62.6% (18.8 of 30 points)
The means for collecting and disseminating incident information were all part of the Support function. Without the infrastructure and back office support for incident information exchange, detection, verification, response and clearance times are delayed and responder and motorist safety is jeopardized. Therefore, one of the three key objectives of the National Unified Goal is prompt, reliable, interoperable communications.
The 2010 TIM SA grouped the Support questions into the following subsections:
- Data Collection/Integration/Sharing: These questions focused on how responders and support personnel (TMCs/TOCs) used transportation management systems (TMS) to collect, integrate and exchange incident information.
- Traveler Information: These questions focused on providing motorists with accurate and timely incident information to influence traveler behavior.
Despite a slight decline in mean score in 2009, the questions in Support have again rebounded and are now up 54.6 percent over Baseline (Table 11).
| Year | Mean Score |
|---|---|
| Baseline5 | 40.5 |
| 2006 | 57.1 |
| 2007 | 57.5 |
| 2008 | 59.4 |
| 2009 | 59 |
| 20106 | 62.6 |
| 5 The baseline was recalculated
in 2010 to incorporate the changes from the TIM SA Revision. Prior
to the TIM SA Revision, the Baseline for Support was 41.3. 6 2009 was the first year of the revised TIM SA questions, including questions which had not previously been asked and therefore had no baseline score. The scores achieved by those questions in 2009 became the baseline for each and are now part of the recalculated baseline in 2010. |
|
Figure 13 shows that of the two subsections, Traveler Information (4.3.2) had the higher score (2.83) and experienced the highest increase over Baseline (95.6 percent).
Figure 13. Support
Each of the questions in Support is listed in Table 12, with the Baseline mean score, the 2010 mean score, the percentage change and the percentage of assessments scoring each question 3 or higher (indicating success).
| Question Number | Question | Mean Score Baseline | Mean Score 2010 | % of Assessments Scoring 3 or Higher Baseline |
% of Assessments Scoring 3 or Higher 2010 |
% Change in 2010 from Baseline Scores |
|---|---|---|---|---|---|---|
| 4.3.1.1 | Does the TIM program use a Traffic Management Center/Traffic Operations Center (TMC/TOC) to coordinate incident detection, notification and response? | 1.98 | 3.22 | 41% | 80% | 62.50% |
| 4.3.1.2 | Is public safety co-located with transportation in the TMC/TOC? | 1.88 | 1.95 | 41% | 45% | 3.50% |
| 4.3.1.3 | Has the TIM program achieved TMC-CAD integration so that incident data and video information is transferred between agencies and applications? | 1.43 | 2.1 | 10% | 41% | 46.70% |
| 4.3.1.4 | Does the TIM program have specific policies and procedures for traffic management during incident response (i.e. signal timing changes, opening/closing of HOV lanes/ramp metering)? | 1.55 | 2.08 | 18% | 36% | 33.90% |
| 4.3.1.5 | Does the TIM program provide for interoperable, interagency communications on-site between incident responders? | 1.61 | 2.54 | 17% | 53% | 58.00% |
| 4.3.2.1 | Have a real-time motorist information system providing incident-specific information?
|
1.9 | 3.15 | 27% | 84% | 65.90% |
| 4.3.2.2 | Are motorists provided with travel time estimates for route segments? | 0.99 | 2.5 | 12% | 54% | 152.50% |
The use of a TMC/TOC to coordinate incident detection, notification and response (4.3.1.1) again scored the highest of the questions in the Data subsection with a mean score of 3.22, representing a 62.5 percent increase over Baseline.
However, lower scores throughout this section indicated that the potential of TMCs/TOCs is not yet being fully realized (Figure 14). Of the locations scoring the TMC/TOC question 3 or higher (80%), 20 percent do not yet have public safety co-located in the center, though several locations have fiber optic/virtual connections between public safety and the TMC/TOC. It was also noted by several respondents that co-location of public safety within the TMC/TOC was reserved for major/catastrophic events only but not for routine TIM.
Even prior to the events of September 11, 2001 highlighting the need for interoperable, interagency communications, TIM program managers have long understood that the inability for responders to communicate on-scene is a significant obstacle to safe, effective incident response and clearance. Much like the persistent disagreements over on-scene equipment staging, this perennial issue continues to stymie true multi-agency coordinated incident response. Though question 4.3.1.5 achieved a mean score of 2.54, representing a 58 percent increase over Baseline, 17 percent of respondents still scored this question Low, indicating little to no progress.
Figure 14. Data Collection/Integration/Sharing
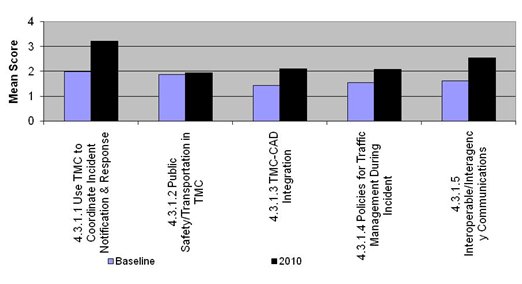
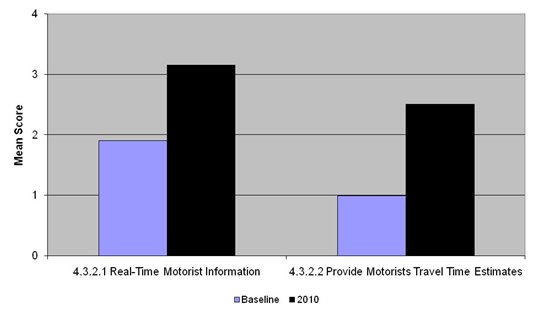
Figure 15 below shows the changes in scores from the Baseline for the two questions in Traveler Information (4.3.2). The average score for question 4.3.2.1 was a composite score of three sub-questions regarding traveler information delivered via 511 (4.3.2.1.a), traveler information website (4.3.2.1.b) or through traffic media access to TMC/TOC data/information (4.3.2.1.c). Of the three types, 511 as the least utilized; 25 percent indicated little to no activity in 511 deployment/utilization. However, there were a number of locations where the traveler information website was populated by the 511 system, so there was less distinction between the two delivery methods now than in previous years.
The provision of travel time estimates to motorists (4.3.2.2) achieved one of the highest percentage increases in 2010 from the Baseline (152.5%). However, the mean score still remained in the average range (2.50) and 27 percent of the TIM SA respondents indicated little to no activity in this area.
Figure 15. Traveler Information
The TIM programs achieving the highest scores in Support program areas are listed alphabetically in Table 13.
| TIM Program |
|---|
|
Opportunities for FHWA
A primary objective of the TIM SA is to identify those program areas where resources can be deployed to address TIM program gaps, both at the local level and nationally. First and foremost in the gap analysis is a review of the questions achieving the lowest mean scores. However, additional opportunities for FHWA are highlighted in a review of program areas with minimal progress in advancing the mean score from year to year.
TIM Performance Measures
As is the case each year, questions on TIM Performance Measures show up as some of the lowest scoring questions but also those with the largest increase over the Baseline. This year, three of the five questions achieving the lowest mean scores in 2010 are in TIM Performance Measurement. The lowest score overall was achieved in secondary incident tracking (4.1.3.5), which was not added to the TIM SA until 2009 (along with the questions on the two FHWA-identified measures, roadway clearance and incident clearance), after the TIM SA Revision.
TIM Performance Measurement is an emerging area and given the challenges faced by TIM programs in collecting and analyzing data to track multi-agency incident response and clearance for primary incidents, it is not surprising that tracking secondary incidents would face even greater hurdles. Support at the national level from FHWA for TIM performance measurement through programs such as the TIM Performance Measures Focus States Initiative and the TIM Performance Measures Knowledgebase are in large part responsible for the significant increases in scores over Baseline for the questions in this subsection (including identification of the two primary measures to be tracked by TIM programs). Given the increased focus on transportation system performance measures by the U.S. DOT and the likelihood that reauthorization of the transportation bill will bring new requirements for tracking and reporting transportation system performance, it is expected that scores in this area will continue to increase.
Where FHWA can provide guidance and drive scores upward is in the area of secondary incidents. Regularly cited as hindering success in this area are the lack of a consistent definition of what constitutes a secondary incident and the liability concerns that generate from classifying incidents as secondary (which presumably public agencies have some ability to affect based on their response to the primary incident).
Safe, Quick Clearance Laws and Policies
The post-Revision TIM SA broke out safe, quick clearance (SQC) laws and policies into three separate questions on Driver Removal, Authority Removal and Move Over. All three scored relatively high mean scores, with Move Over (4.2.2.1) achieving the highest score overall (3.27) on the 2010 TIM SA. Due to the high scores originally achieved by all three questions in 2009, there has been very little increase (>5%) in mean score over the Baseline (which for the post-Revision questions was set in 2009).
However, as repeatedly noted in the comments provided, having those laws and policies in place, and enforcement of and driver compliance with those laws and policies are not always equal. Move Over laws that drivers do not know about or comply with do not increase responder safety. Driver Removal laws that motorists do not understand will still result in cars blocking travel lanes unnecessarily. Decision makers who resist implementation of Authority Removal over liability concerns will contribute to spilt cargo and disabled vehicles impeding traffic flow around incidents.
FHWA can play a critical role in educating decision makers about the critical need to have in place and enforce all three SQC laws and in providing the outreach and education messages and tools for drivers to ensure compliance with those laws.
Traffic Management Centers/Traffic Operations Centers
Despite a decline in mean score in 2009 and projections that the overall score would continue to decline or perhaps level off (due to state budget issues), progress in the use of TMCs/TOCs to coordinate TIM (4.3.1.1) has increased. This year question 4.3.1.1 achieved the second highest score overall in the 2010 TIM SA.
FHWA can capitalize on this momentum through education, outreach and dissemination of FHWA-sponsored products that provide best practices and lessons learned in information data collection and sharing including:
- 2010 Traffic Incident Management Handbook Update
- Information Sharing Guidebook for Transportation Management Centers, Emergency Operations Centers, and Fusion Centers
- Information Sharing for Traffic Incident Management
By maximizing the value of the existing investment in TMCs/TOCs, they are less likely to become victim to budget cuts, and the rationale for new and expanded investment in TMCs/TOCs becomes more evident.
Leveraging Other Programs
There are a number of concurrent efforts underway that can and should be leveraged to improve TIM performance, and therefore, increase TIM SA scores.
National Traffic Incident Management Coalition and the TIM Network
The NTIMC, representing the broad range of TIM stakeholders, should be utilized to build greater awareness of the TIM SA and to actively engage in the development and dissemination of outreach, education and training to address issues identified in the gap analysis. The newly developed NTIMC TIM Network provides additional access to TIM practitioners who can participate in the training provided.
NCHRP 20-7 (282) Research Needs Assessment for Roadside Worker and Vehicle Visibility
This research initiative is developing a comprehensive, multiyear research program roadmap to improve visibility and conspicuity within work zones and at incident scenes; improve highway user response to the presence of first responder and roadway personnel and vehicles; and contribute to more effective multidisciplinary solutions for responder safety in keeping with the goals of the TIM National Unified Goal (NUG). The priority research studies identified through the gap analysis and stakeholder workshop will provide additional data, analysis and recommendations for improving responder and vehicle visibility and safety which can then be incorporated into the education, outreach and training.
Traffic Incident Management Responder Training
Several new TIM responder training courses are nearing completion which can be leveraged for improving TIM program performance and subsequently TIM SA scores. The Strategic Highway Research Program (SHRP II) Traffic Incident Responder Training has been through two pilot courses and will undergo additional pilot testing and refinement in 2011. Likewise, the I-95 Corridor Coalition is finalizing a three-dimensional, multi-player computer gaming simulation technology to train incident responders on best practices. These training efforts can be utilized to improve the knowledgebase and performance in specific TIM program areas where the TIM SA identifies a need through lower and/or decreasing scores.
Summary
A total of 92 TIM SA were completed in 2010, with an average overall score of 63.9 percent (out of a possible 100 percent). Overall scores are up 37.8 percent over the Baseline scores. The highest scores were achieved in Tactical (71.5 percent) and the largest percentage increase in scores from the Baseline was in Strategic (67.2 percent).
Tables 14 and 15 show the highest and lowest mean scores, respectively. Both sets of questions, along with the largest change in mean score (Table 16) present both challenges and opportunities for FHWA. Specifically, the 2010 TIM SA scores highlight a need for additional guidance in the following areas:
- TIM performance measures and specifically, defining and tracking secondary incident reduction;
- Safe, quick clearance laws and policies;
- Maximizing use of TMCs/TOCs.
| Mean Score Rank in 2010/ Baseline | Question Number | Question | 2010 Mean Score (n=92) | % Scoring 3 or Higher -2010 | % Change in 2010/ Baseline Mean Scores |
|---|---|---|---|---|---|
| 1/1 | 4.2.2.1 Tactical | Have "move over" laws which require drivers to slow down and if possible move over to the adjacent lane when approaching workers or responders and equipment in the roadway? | 3.27 | 80% | 2.20% |
| 2/11 | 4.3.1.1 Support | Use a Traffic Management Center/Traffic Operations Center to coordinate incident detection, notification and response? | 3.22 | 80% | 62.50% |
| 3/9 | 4.1.2.4 Strategic | Conduct planning for special events? | 3.18 | 86% | 28.90% |
| 4/2 | 4.2.1.2 Tactical | Have "driver removal" laws which require drivers involved in minor crashes to move vehicles out of the travel lanes? | 3.16 | 76% | 5.10% |
| 5/14 | 4.3.2.1 Support | Have a real-time motorist information system providing incident-specific information? | 3.15 | 84% | 65.90% |
| 5/8 | 4.2.1.4 Tactical | Utilize the Incident Command System? | 3.15 | 76% | 23.60% |
| Mean Score Rank in 2010/ Baseline | Question Number | Question | 2010 Mean Score (n=92) | % Scoring 3 or Higher -2010 | % Change in 2010/ Baseline Mean Scores |
|---|---|---|---|---|---|
| 22/30 | 4.1.3.5 Tactical | Has the TIM program established methods to collect and analyze the data necessary to measure performance in reduced roadway clearance time and reduced incident clearance time? | 2.28 | 45% | 256.70% |
| 29/30 | 4.1.3.4 Support | Have multi-agency agreement on the two performance measures being tracked (roadway clearance time and incident clearance time)? | 1.87 | 35% | 192.10% |
| 17/28 | 4.1.3.1 Strategic | Are motorists provided with travel time estimates for route segments? | 2.5 | 54% | 152.50% |
| 30/29 | 4.1.1.2 Tactical | Routinely review whether progress is made in achieving the targets? | 1.83 | 30% | 146.80% |
| 20/25 | 4.3.1.2 Support | Conduct training?
|
2.37 | 61% | 88.10% |
| Mean Score Rank in 2010/ Baseline | Question Number | Question | 2010 Mean Score (n=92) | % Scoring 3 or Higher -2010 | % Change in 2010/ Baseline Mean Scores |
|---|---|---|---|---|---|
| 31/27 | 4.1.3.5 Tactical | Track performance in reducing secondary incidents? | 1.27 | 11% | 23.50% |
| 30/29 | 4.1.3.4 Support | Routinely review whether progress is made in achieving the targets? | 1.83 | 30% | 146.80% |
| 29/30 | 4.1.3.1 Strategic | Have multi-agency agreement on the two performance measures being tracked (roadway clearance time and incident clearance time)? | 1.87 | 35% | 192.10% |
| 28/24 | 4.1.1.2 Tactical | Is there a process in place to ensure the continuity of these agreements / memoranda of understanding through integrated planning and budgeting across and among participating agencies? | 1.92 | 35% | 42.50% |
| 27/16 | 4.3.1.2 Support | Is public safety co-located with transportation in the TMC/TOC? | 1.95 | 45% | 3.50% |
| State – Urban Area | 2003 | 2004 | 2005 | 2006 | 2007 | 2008 | 2009 | 2010 |
|---|---|---|---|---|---|---|---|---|
| AK (Statewide) | N | R | R | |||||
| AL – Birmingham | B | R | R | R | R | R | R | |
| AR – Little Rock | B | R | R | R | R | R | R | |
| AZ – Phoenix | B | R | R | R | R | R | ||
| AZ – Tucson | B | R | R | R | R | R | ||
| CA – Bakersfield-Fresno | B | R | R | |||||
| CA – Los Angeles | B | R | R | |||||
| CA – Orange County | N | R | ||||||
| CA – Sacramento | B | R | R | |||||
| CA – San Bernardino-River. | N | R | ||||||
| CA – San Diego | B | R | R | R | ||||
| CA – San Francisco | B | R | R | R | ||||
| CO – Denver | B | R | R | R | R | R | R | |
| CT – Hartford | B | R | R | R | R | R | R | |
| DC – Washington | B | R | R | R | R | R | R | |
| FL – Ft. Lauderdale | B | R | R | R | R | R | ||
| FL – Ft. Pierce | N | |||||||
| FL – Jacksonville | B | R | R | R | R | R | ||
| FL – Lee – Charlotte | N | |||||||
| FL – Miami-Dade | B | R | R | R | R | R | ||
| FL – Polk County | N | |||||||
| FL – Orlando | B | R | R | R | R | R | ||
| FL – Sarasota-Bradenton | B | R | R | R | R | |||
| FL – St. Petersburg-Clearw. | B | R | R | R | ||||
| FL – Tampa-Hillsborough | B | R | R | R | R | |||
| FL – West Palm Beach | B | R | R | R | R | R | ||
| GA – Atlanta | B | R | R | R | R | R | ||
| HI (Statewide) | B | R | R | R | R | R | ||
| IL – Chicago | B | R | R | R | R | R | R | |
| IN – Indianapolis | B | R | R | R | R | R | R | |
| KS – Kansas City | N | |||||||
| KY – Lexington | N | R | R | R | ||||
| KY – Louisville | B | R | R | R | R | R | ||
| LA – Baton Rouge | B | R | R | R | R | R | ||
| LA – New Orleans | B | R | R | R | R | R | ||
| MD – Baltimore | B | R | R | R | R | R | R | |
| MD – Suburban Wash DC | B | R | R | R | R | R | R | |
| MA – Boston | B | R | R | R | R | R | ||
| MA – Springfield | N | R | R | R | R | |||
| ME – I-95 Corridor | N | R | ||||||
| MI – Detroit | B | R | R | R | R | R | R | |
| MI – Grand Rapids | B | R | R | R | R | R | R | |
| MN – Minneapolis – St. Paul | N | R | ||||||
| MO – Kansas City | B | R | R | R | R | R | R | |
| MO – St. Louis | B | R | R | R | R | R | R | |
| MS (Statewide) | N | |||||||
| NE – Omaha | B | R | R | R | R | R | R | |
| NH (Statewide) | N | |||||||
| NJ (Statewide) | N | R | ||||||
| NV – Las Vegas | B | R | R | R | R | R | R | |
| NM – Statewide | B | R | R | R | R | R | R | |
| NY – Albany | B | R | R | R | R | R | R | |
| NY – Buffalo | B | R | R | R | R | R | R | |
| NY – New York | B | R | R | R | R | R | R | |
| NY – New York-North NJ | N | |||||||
| NY – Rochester | B | R | R | R | R | R | R | |
| NY – Syracuse | B | R | R | R | R | R | R | |
| NC – Charlotte | B | R | R | R | R | R | R | |
| NC – Greensboro-WS-HP | B | R | R | R | R | R | R | |
| NC – Raleigh-Durham | B | R | R | R | R | R | R | |
| OH – Cincinnati | B | R | R | R | R | R | R | |
| OH – Cleveland | B | R | R | R | R | R | R | |
| OH – Columbus | B | R | R | R | R | R | R | |
| OH – Dayton | B | R | R | R | R | R | R | |
| OH – Toledo | B | R | R | R | R | R | R | |
| OH – Youngstown | B | R | R | R | R | R | R | |
| OK – Oklahoma City | B | R | R | R | R | R | ||
| OK – Tulsa | B | R | R | R | R | R | ||
| OR – Portland | B | R | R | R | R | R | R | |
| PA – Allentown-Bethlehem | B | R | R | R | R | |||
| PA – Harrisburg | B | R | R | R | R | |||
| PA – I-81 Corridor | N | |||||||
| PA – Philadelphia | B | R | R | R | R | R | R | |
| PA – Pittsburgh | B | R | R | R | R | R | R | |
| PA – Wilkes Barre-Scranton | B | R | R | R | R | R | ||
| PR – San Juan | B | R | R | R | R | R | R | |
| RI – Providence | B | R | R | R | R | |||
| SC (Statewide) | N | R | ||||||
| SC – Greenville-Spartanburg | B | R | R | R | R | |||
| SD (Statewide) | N | R | R | |||||
| TN – Chattanooga | N | R | R | R | ||||
| TN – Knoxville | B | R | R | R | R | R | R | |
| TN – Memphis | B | R | R | R | R | R | R | |
| TN – Nashville | B | R | R | R | R | R | R | |
| TX – Austin | B | R | R | R | R | R | R | |
| TX – Dallas-Ft. Worth | B | R | R | R | R | R | R | |
| TX – El Paso | B | R | R | R | R | R | R | |
| TX – McAllen (Pharr Dist) | B | R | R | R | R | R | ||
| TX – Houston | B | R | R | R | R | R | R | |
| TX – San Antonio | B | R | R | R | R | R | R | |
| UT – Salt Lake City | B | R | R | R | R | R | R | |
| VA – Norfolk-Virginia Beach | B | R | R | R | R | R | R | |
| VA – No. VA-Sub. Wash DC | B | R | R | R | R | R | R | |
| VA – Richmond | B | R | R | R | R | R | R | |
| WA – Seattle | B | R | R | R | R | R | R | |
| WI – Milwaukee | B | R | R | R | R | R | R | R |
| WV (Statewide) | N | R | ||||||
| WY (Statewide) | N | R |