2008 Traffic Incident Management Self-Assessment National Analysis Report
Background and Methodology
The Traffic Incident Management Self-Assessment (TIM SA) is a tool for benchmarking and measuring progress in TIM program performance. The TIM SA consists of 34 questions grouped into three sections:
- Program and Institutional Issues: Strategic program elements including formal multi-agency programs, institutional agreements, multi-year program roadmapping, multi-agency budget support for equipment and personnel and performance measurement for the multi-agency program.
- Operational Issues: Tactical program elements that address on-scene response, responder and motorist safety, comprehensive traffic control at the incident and at the end of the traffic queue behind the incident, and special procedures needed to clear major incidents.
- Communication and Technology Issues: Support program elements including integrated multi-agency communications, Intelligent Transportation Systems (ITS) tools and techniques for traffic management on facilities impacted by incidents, and incident-specific traveler information.
The scores assigned to each of the questions (0=little to no progress through 4=outstanding) were intended to be consensus values assigned by groups of TIM stakeholders (transportation, law enforcement, fire and rescue, emergency medical services, towing and recovery, traffic media and others). Typically, FHWA Division Office personnel, in conjunction with the State Department of Transportation (DOT), take responsibility for convening the TIM stakeholders (Regional, State, or local) for the purpose of completing the TIM SA. Over time, fewer and fewer TIM SAs have been completed by groups of TIM stakeholders, and instead, have become the outcome of the collaboration between very few TIM stakeholders in each State. The 2009 TIM SA will feature a revised protocol, which will ameliorate the way the TIM SA is completed to focus on the input of key TIM leaders in each state.
In its initial year (2003), FHWA defined 80 operational areas, which were required to complete the TIM SA. The original vision was to have all 80 areas complete a baseline TIM SA in 2003 and in subsequent years for 40 of those areas to complete the TIM SA on a rotating biennial basis. In 2006, the requirement was revised for all 80 operational areas to submit a TIM SA on an annual basis.
Baseline assessments were completed in 2003 (70 in total), 2004 (an additional 7), and 2005 (1) for a total of 78 individual Baseline scores. Since that time, an additional 7 areas, beyond the original 80, have completed and submitted assessments for inclusion in the national analysis. In 2008, a total of 74 re-assessments were completed, with two new areas submitting for the first time, making a total of 76 TIM SA being analyzed in this report.
Results - Overall
Table 7 shows the overall scores by section for the 2008 TIM SA and the Baseline, along with the percentage change from the Baseline. An overall score of 59.6 percent was achieved in 2008, with the highest section score in Operational Issues (66.2 percent). Overall, the scores have increased 29.9 percent over the Baseline and the scores in Communications and Technology Issues experienced the greatest percentage change (43.8 percent) over the Baseline.
| Section | # of Questions | Mean Score Baseline | Mean Score 2008 | % Change in scores from Baseline | Section Weights |
|---|---|---|---|---|---|
| Program and Institutional Issues | 12 | 36.30% | 51.00% | 40.50% | 30% |
| Operational Issues | 14 | 57.60% | 66.20% | 15.00% | 40% |
| Communication and Technology Issues | 8 | 41.30% | 59.40% | 43.80% | 30% |
| Overall Total | 34 | 45.90% | 59.60% | 29.90% | 100% |
Within each section, the 34 TIM SA questions are further divided into category-specific subsections. Table 8 shows the overall scores by subsection for the 2008 TIM SA and the Baseline, along with the percentage change from the Baseline.
In Program and Institutional Issues, the four questions in TIM Performance Measurement (4.1.3) continue to achieve the highest percentage change from the Baseline. The 84.5 percent increase over the Baseline also represents the single largest change of all the TIM SA subsections.
Substantial increases over the Baseline were also realized in the subsection on Traveler Information (4.3.3), achieving a 60.8 percent increase over the Baseline. The mean score for Integrated Interagency Communications (4.3.1), while representing a 51.9 percent increase over the Baseline, did not change from 2007, when the Baseline score was also 2.31.
| Sections and Subsections | No. | Mean Score Range = 0 to 4 |
% Change in 2008 from Baseline | |
|---|---|---|---|---|
| Baseline (n=78) |
2008 (n=76) |
|||
| Program and Institutional Issues | 4.1 | |||
| Formal TIM Programs | 4.1.1 | 1.63 | 2.23 | 36.6% |
| TIM Administrative Teams | 4.1.2 | 1.83 | 2.39 | 30.5% |
| Performance Measurement | 4.1.3 | 0.80 | 1.48 | 84.5% |
| Operational Issues | 4.2 | |||
| Procedures for Major Incidents | 4.2.1 | 2.41 | 2.9 | 20.2% |
| Responder and Motorist Safety | 4.2.2 | 1.71 | 2.21 | 29.5% |
| Response and Clearance Policies and Procedures | 4.2.3 | 2.60 | 2.77 | 6.7% |
| Communications and Technology Issues | 4.3 | |||
| Integrated Interagency Communications | 4.3.1 | 1.52 | 2.31 | 51.9% |
| Transportation Management Systems | 4.3.2 | 1.80 | 2.35 | 30.6% |
| Traveler Information | 4.3.3 | 1.52 | 2.44 | 60.8% |
Scores for all 34 questions for both the Baseline and the 2008 re-assessments are shown in Figure 1. Following Figure 1 is a section-by-section analysis of the change in TIM SA scores from the Baseline to 2008.
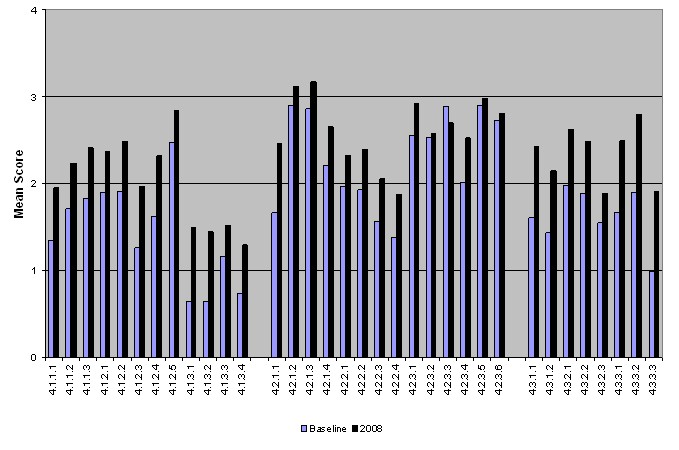
Figure 1. Mean Scores for All Questions Baseline – 2008.
Results - Program and Institutional Issues
Mean Score: 51.0% (15.3 of 30 points)
Strategic program elements focus on how a TIM program is organized and sustained and how it functions year after year. Programmatic success is evaluated in the following three subsections:
- Formal TIM Programs: This includes organizational structure, interagency relationships, and resource allocation.
- TIM Administrative Teams: This includes roles and responsibilities of agency partners and team functions.
- Performance Measurement: This includes activities involved in planning for and tracking performance.
The mean scores in Program and Institutional Issues have continually been the lowest overall each year since the TIM SA was initiated in 2003. This tracks the evolution of TIM programs, where the initial work has typically focused on on-scene operations conducted by an ad hoc group of stakeholders and not on building a formal program. However, progress is being made to advance TIM strategic program elements as evidenced by increasing mean scores (Table 9).
| Year | Mean Score |
|---|---|
| Baseline | 36.3 |
| 2006 | 48.5 |
| 2007 | 48.8 |
| 2008 | 51.0 |
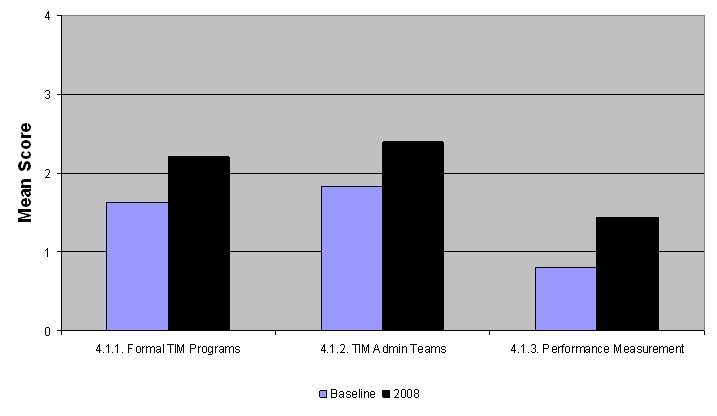
Figure 2. Programs and Institutional Issues (Strategic).
Figure 2 shows the change from the Baseline for each of the three subsections in Program and Institutional Issues.
Table 10 shows the mean score (Baseline and 2008) for each of the 12 questions in Program and Institutional Issues. Also shown is the percentage of TIM SAs scoring each question 3 or higher, indicating a good degree of success in the particular TIM program component. Table 10 also shows the percentage increase in the mean score in 2008 from the Baseline.
| Question Number |
Question | Mean Score Range = 0 to 4 | % of Assessments Scoring 3 or Higher | % Change in 2008 Mean Scores from Baseline |
||
|---|---|---|---|---|---|---|
| Baseline | 2008 | Baseline | 2008 | |||
| 4.1.1.1 | Have multi-agency, multi-year strategic plans detailing specific programmatic activities to be accomplished with appropriate budget and personnel needs identified? | 1.35 | 1.97 | 12% | 28% | 45.9% |
| 4.1.1.2 | Have formal interagency agreements on operational and administrative procedures and policies? | 1.71 | 2.28 | 18% | 39% | 33.1% |
| 4.1.1.3 | Have field-level input into the plans ensuring that the plans will be workable by those responsible for their implementation? | 1.83 | 2.44 | 33% | 50% | 33.1% |
| 4.1.2.1 | Have formalized TIM multi-agency administrative teams to meet and discuss administrative policy issues? | 1.90 | 2.36 | 28% | 47% | 24.4% |
| 4.1.2.2 | Hold regular meetings of the TIM administrative team? | 1.91 | 2.45 | 35% | 50% | 28.2% |
| 4.1.2.3 | Conduct training through simulation or “in-field” exercises? | 1.26 | 1.97 | 9% | 33% | 56.7% |
| 4.1.2.4 | Conduct post-incident debriefings? | 1.62 | 2.29 | 18% |
44% | 41.3% |
| 4.1.2.5 | Conduct planning for special events? | 2.47 | 2.87 | 35% | 54% | 16.2% |
| 4.1.3.1 | Have multi-agency agreements on what measures will be tracked and used to measure program performance? | 0.64 | 1.52 | 3% | 13% | 136.7% |
| 4.1.3.2 | Have agreed upon methods to collect and analyze/track performance measures? | 0.64 | 1.46 | 3% | 12% | 127.6% |
| 4.1.3.3 | Have established targets for performance? | 1.16 | 1.57 | 4% | 13% | 35.6% |
| 4.1.3.4 | Conduct periodic review of whether or not progress is being made to achieve targets? | 0.74 | 1.36 | 3% | 9% | 83.8% |
Each year TIM SA respondents are asked to provide comments on each score assigned to provide additional detail. Since the initial TIM SA in 2003, the number of comments submitted on any of the completed TIM SAs has been decreasing. However, this year's submittals saw a marked increase in the comments submitted for each question.
The comments submitted on the first three TIM SA questions that detailed progress in Formal Traffic Incident Management Programs, tended to reflect the mean scores achieved in each of the three questions (Figure 3). More work has gone into the development of interagency agreements (typically Memoranda of Understanding [MOU]) than into multi-agency, multi-year strategic plans. There continues to be a disconnect in the mean scores for questions 4.1.1.1 and 4.1.1.3, where the scores for field-level input into the strategic plans (4.1.1.3) is scored higher than the actual presence of strategic plans (4.1.1.1). The revised TIM SA, to be discussed in more detail within this report, should mitigate this apparent inconsistency in subsequent years.
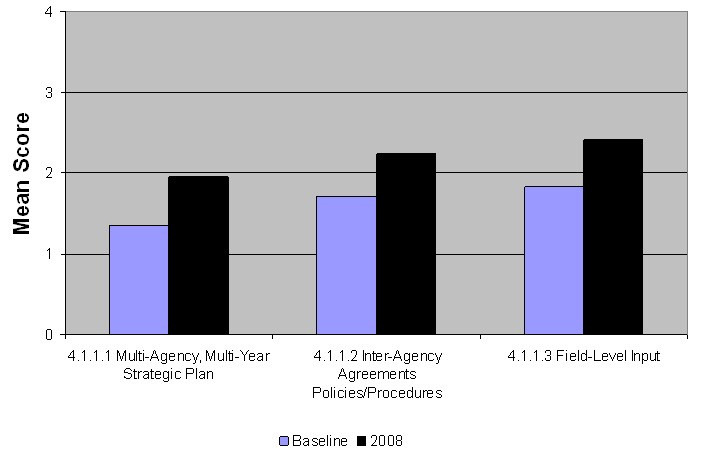
Figure 3. Formal Traffic Incident Management Programs.
On average, the scores in TIM Administrative Teams (4.1.2) increased 20 percent over the 2007 scores, and are 30.5 percent higher than the Baseline. The highest mean score was achieved in planning for special events (4.1.2.5), with a mean score of 2.87 (also representing the fifth highest scoring question out of the 34 TIM SA questions). That score is an aggregated average of individual scores in planning for the following activities:
- Construction and Maintenance.
- Sporting Events/Concerts/Conventions, etc.
- Weather-related Events.
- Catastrophic Events.
Of these preceding four category scores, the highest mean score (3.03) was achieved in planning for sporting events, concerts, and conventions, where the advanced notice of the events lends itself to an increased opportunity for pre-planning.
The comments submitted with the TIM SAs indicate that more post-incident debriefings are being held, although not necessarily with multi-agency participation.
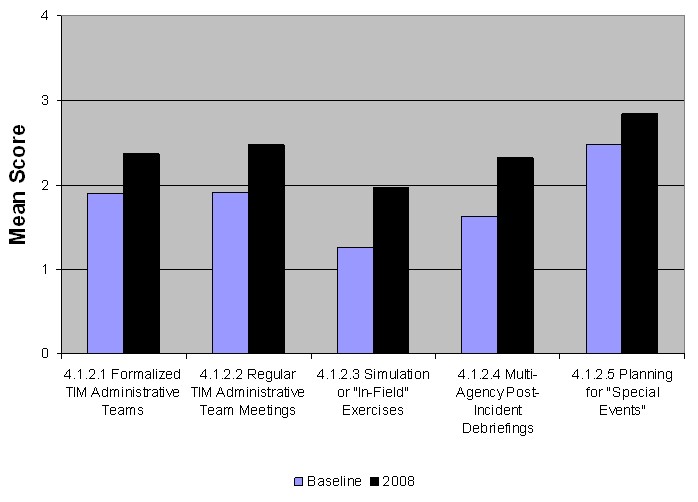
Figure 4. Traffic Incident Management Administrative Teams.
The scores in TIM Performance Measurement (4.1.3) have consistently been the lowest in the TIM SA, while simultaneously achieving the highest percentage increases over the Baseline (Figure 5). Of the four TIM performance measures questions, none has yet to achieve a mean score of 2 or higher. The comments point toward a lack of multi-agency performance measures; where performance is being measured, it is typically individual agencies tracking their own performance.
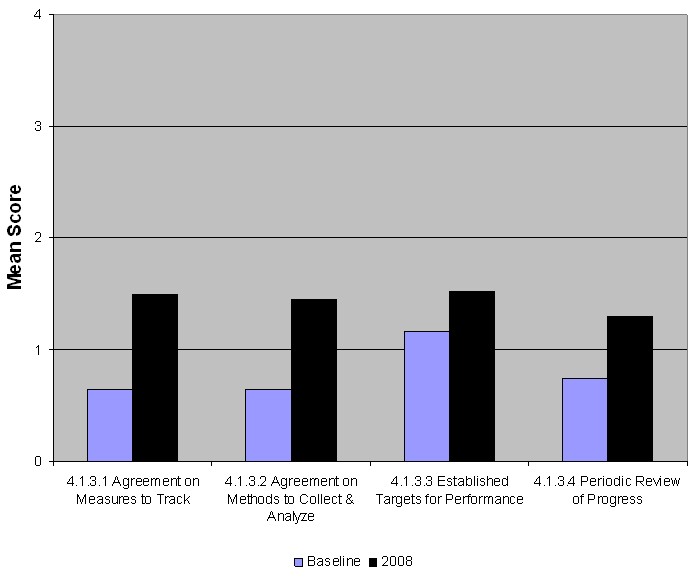
Figure 5. Traffic Incident Management Performance Measurement
Results - Operational Issues
Mean Score: 66.2% (26.5 of 40 points)
The questions in Operational Issues focus on tactical elements, grouped into the following three subsections:
- Procedures for Major Incidents.
- Responder and Motorist Safety.
- Response and Clearance Policies and Procedures.
Combined, the questions in Operational Issues scored the highest in the TIM SA, achieving a 66.2 percent in 2008, up 15 percent over the Baseline (Table 11). Among the three subsections, the questions in Procedures for Major Incidents scored the highest at 2.90.
| Year | Mean Score |
|---|---|
| Baseline | 57.6 |
| 2006 | 65.0 |
| 2007 | 66.0 |
| 2008 | 66.2 |
Figure 6 shows the change from the Baseline for each of the three subsections in Operational Issues.
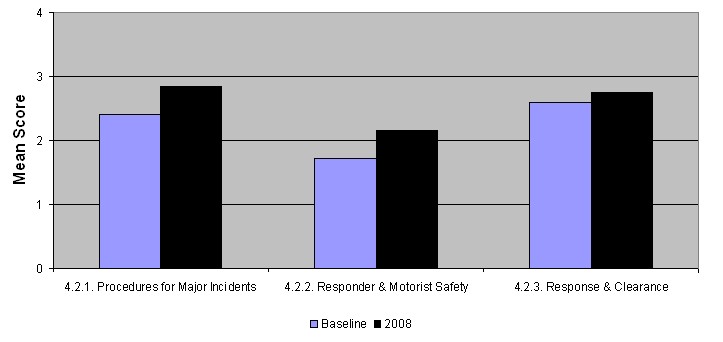
Figure 6. Tactical Operational Issues.
With one exception (4.2.2.4), the questions in Operational Issues each has a mean score higher than 2, with 36 percent of the questions scoring 2.75 or higher (Table 12). However, the questions in Operational Issues experienced decreases in mean scores, either from the Baseline (4.2.3.3) or from the 2007 scores.
Six questions (46 percent) achieved lower mean scores in 2008 than in 2007. While the decreases were not significant, the fact that scores are decreasing may indicate a leveling out of effort in Operational Issues or may be the result of an increase in the number of emerging programs completing the TIM SA, where lower scores overall are expected.
| Question Number |
Question | Mean Score Range = 0 to 4 | % of Assessments Scoring 3 or Higher | % Change in 2008 Mean Scores from Baseline |
||
|---|---|---|---|---|---|---|
| Baseline | 2008 | Baseline | 2008 | |||
| 4.2.1.1 | Have established criteria for what is a “major incident” – incident levels or codes? | 1.66 | 2.51 | 18 | 47 | 51.9 |
| 4.2.1.2 | Identify high-ranking agency members available on 24/7 basis to respond to a major incident (Major Incident Response Team)? | 2.90 | 3.16 | 74 | 78 | 9.0 |
| 4.2.1.3 | Have a pre-identified (approved) contact list of resources (including special equipment) for incident clearance and hazardous materials response? | 2.86 | 3.20 | 67% | 86 | 11.9 |
| 4.2.1.4 | Have the response equipment pre-staged for timely response? | 2.21 | 2.70 | 41 | 64 | 22.2 |
| 4.2.2.1 | Train all responders in traffic control procedures? | 1.97 | 2.39 | 28 | 46 | 21.3 |
| 4.2.2.2 | Utilize on-scene traffic control procedures for various levels of incidents in compliance with MUTCD? | 1.93 | 2.43 | 27 | 51 | 26.0 |
| 4.2.2.3 | Utilize traffic control procedures for the end of the incident traffic queue? | 1.56 | 2.11 | 17 | 30 | 35.4 |
| 4.2.2.4 | Have mutually understood equipment staging and emergency lighting procedures on-site to maximize traffic flow past an incident while providing responder safety? | 1.38 | 1.92 | 14 | 25 | 39.3 |
| 4.2.3.1 | Utilize the Incident Command System? | 2.55 | 2.92 | 58 | 78 | 14.6 |
| 4.2.3.2 | Have specific policies and procedures for fatal accident investigation that also address maintenance of traffic flow? | 2.53 | 2.61 | 55 | 55 | 3.1 |
| 4.2.3.3 | Have specific policies and procedures for hazardous materials response that also address maintenance of traffic flow? | 2.89 | 2.73 | 69 | 66 | -5.6 |
| 4.2.3.4 | Have quick clearance policies for major and minor incidents? | 2.02 | 2.52 | 35 | 58 | 24.9 |
| 4.2.3.5 | Have a pre-qualified list of available and contracted towing and recovery operators (to include operators' capabilities)? | 2.9 | 2.99 | 73 | 76 | 3.3 |
| 4.2.3.6. | Use motorist assist service patrols? | 2.73 | 2.87 | 67 | 76 | 5.0 |
The 2007 TIM SA National Analysis Report identified an issue with the use of pre-identified resources for incident clearance and hazardous materials response (4.2.1.3), which has continued in the 2008 TIM SAs. For the third year in a row, question 4.2.1.3 has the highest mean score of the 34 TIM SA questions. In 2008, the score increased to 3.20, with 86 percent of respondents scoring this question a 3 or higher (Figure 7).
However, question 4.2.3.3 asks respondents to rate the use of policies and procedures for hazardous materials (HAZMAT) response, which also address traffic flow. For the third year in a row, this question has seen a decrease in the mean score, down to 2.73, representing a 5.6 percent decrease from the Baseline score of 2.89.
Identifying or typing resources for hazardous materials response is only part of the equation; effectively deploying those resources is critical to safely and quickly clearing the incident scene and restoring traffic flow. A continued decline in the score for policies and procedures to do so is a significant concern.
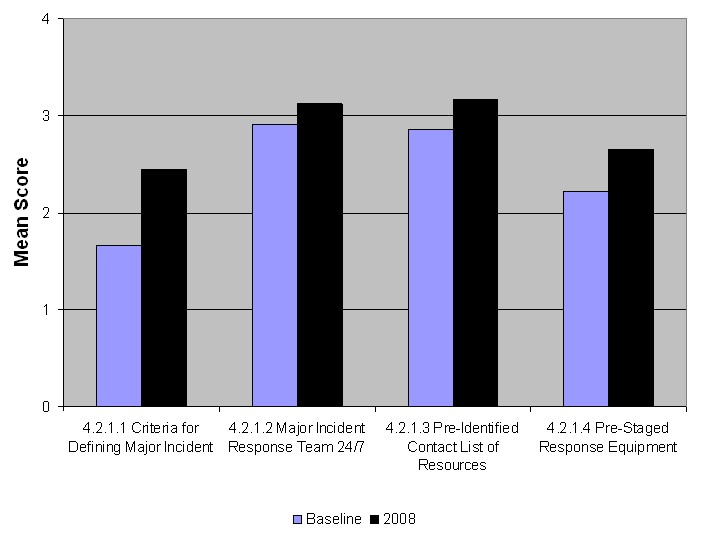
Figure 7. Procedures for Major Incidents.
Figure 8 shows the increases in scores from the Baseline for the four questions in Responder and Motorist Safety. It should be noted that among the five TIM SA questions with the lowest mean scores, four are in TIM Performance Measures and the other is in Responder and Motorist Safety. On-scene equipment staging procedures and emergency lighting protocol (4.2.2.4) achieved a mean score of 1.92 and only 25 percent of the respondents scored this question a 3 or higher. In addition to proper equipment staging and emergency lighting, responders are provided additional protection on-scene when drivers are required, through move-over laws, to move to an adjacent lane when passing the incident scene. However, the presence of move-over laws is not currently queried in the TIM SA. This key responder safety component will be a part of the revised TIM SA in 2009 and will provide an additional metric for evaluating responder safety.
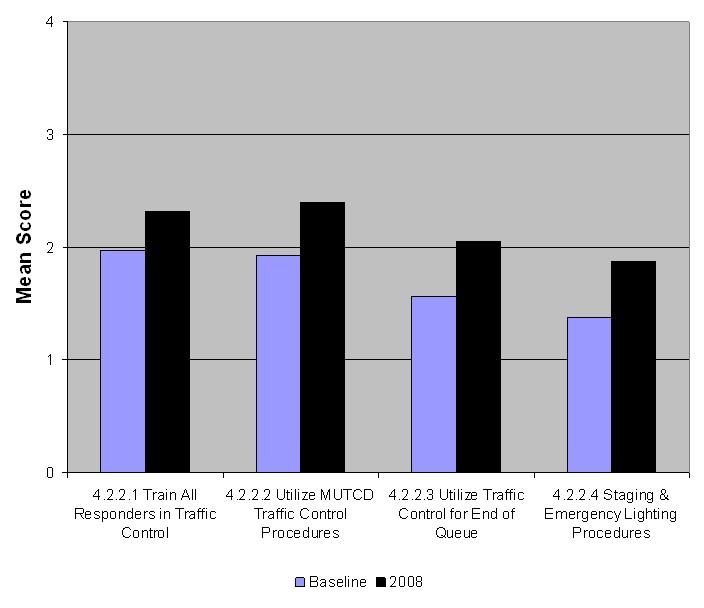
Figure 8. Responder and Motorist Safety
The 2006 and 2007 TIM SA National Analysis Reports documented increasing scores in the use of the Incident Command System (ICS), question 4.2.3.1 (Figure 9). In both reports, the scores increased over the previous year and the percentage of respondents scoring this question 3 or higher was 78 percent. However, in both the 2007 TIM SA National Analysis Report and the 2008 TIM SA National Evaluation Report, it was noted that the concern should be on the 22 percent of respondents who do not score this question above a 3.
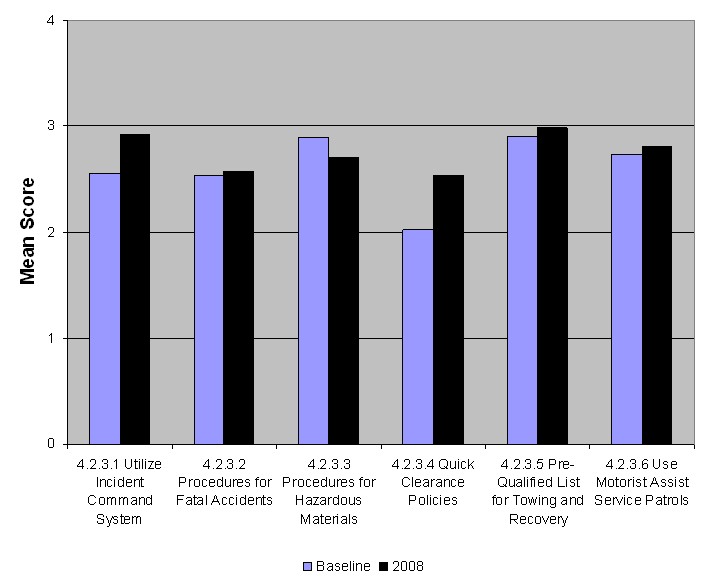
Figure 9. Response and Clearance Policies and Procedures.
The U.S. Department of Homeland Security National Incident Management System (NIMS) requirement is for all incident responders to be trained in ICS. A review of the comments submitted does indicate that a number of respondents have received training in ICS. However, a number of locations note that while responders are trained in ICS, it is not implemented at the incident scene.
Results – Communications and Technology Issues
Mean Score: 59.4% (17.8 of 30 points)
The questions in Communications and Technology Issues focus on the tools and technologies enabling improved incident detection, response, and clearance. The questions are grouped into the following subsections:
- Integrated Interagency Communications: These questions focus on how responders exchange incident information.
- Transportation Management Systems: These questions focus on the use of technology in incident detection and response.
- Traveler Information: These questions focus on providing motorists with accurate and timely incident information to influence traveler behavior.
The Communications and Technology Issues questions have experienced the largest increase over the Baseline, up 43.8 percent (Table 13). Of the three TIM SA sections, Communications and Technology Issues are seemingly the most resource dependent. With current economic conditions and budgets at all levels of government experiencing shortfalls, it would be reasonable to expect that the scores in this area either level off or in some cases decrease.
However, this is an area where the TIM nexus to national emergency response and preparedness goals is demonstrating the ability to advance TIM program performance and therefore increase TIM SA scores. The critical need for communications connectivity and interoperability between responders at all levels is driving Federal investments through programs such as the U.S. Department of Homeland Security Urban Area Security Initiative (UASI).
| Year | Mean Score |
|---|---|
| Baseline | 41.3 |
| 2006 | 57.1 |
| 2007 | 57.5 |
| 2008 | 59.4 |
Of the three subsections, Traveler Information (4.3.3) has realized the largest increase, up 60.8 percent over the Baseline (Figure 10).
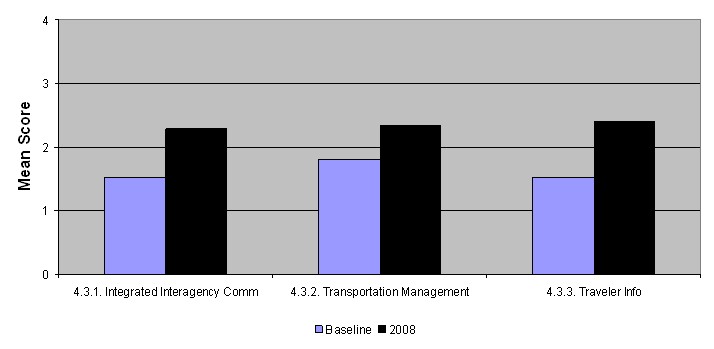
Figure 10. Communications and Technology Issues (Support).
Each of the questions in Communications and Technology Issues is listed in Table 14, with the Baseline mean score, the 2008 mean score, the percentage change, and the percent of assessments scoring each question a 3 or higher.
| Question Number |
Question | Mean Score Range = 0 to 4 | % of Assessments Scoring 3 or Higher | % Change in 2008 Mean Scores from Baseline |
||
|---|---|---|---|---|---|---|
| Baseline | 2008 | Baseline | 2008 | |||
| 4.3.1.1 | Have a two-way interagency voice communications system allowing for direct on-site communications between incident responders? | 1.61 | 2.45 | 17% | 49% | 52.2% |
| 4.3.1.2 | Provide data and video information transfer between agencies and applications (TMC-CAD integration)? | 1.43 | 2.17 | 10% | 43% | 51.6% |
| 4.3.2.1 | Use Traffic Management Center(s) to coordinate incident notification and response? | 1.98 | 2.63 | 41% | 62% | 32.6% |
| 4.3.2.2 | Have a developed technical infrastructure for surveillance and rapid detection of traffic incidents? | 1.88 | 2.50 | 27% | 58% | 33.2% |
| 4.3.2.3 | Have specific policies and procedures for traffic management during incident response (i.e. signal timing changes, opening/closing of HOV lanes/ramp metering)? | 1.55 | 1.92 | 18% | 32% | 24.2% |
| 4.3.3.1 | Have the ability to merge/integrate and interpret information from multiple sources? | 1.67 | 2.53 | 24% | 59% | 51.4% |
| 4.3.3.2 | Have a real-time motorist information system providing incident-specific information? | 1.9 | 2.82 | 27% | 74% | 48.5% |
| 4.3.3.3 | Provide motorists with travel time estimates for route segments? | 0.99 | 1.98 | 12% | 34% | 100.3% |
One of the two questions in this section to experience a decline in 2008 from 2007 was question 4.3.1.2 on Computer-Aided Dispatch Traffic Management Center (CAD-TMC) integration (Figure 11). Although the decline was minor (2.18 in 2007 to 2.17 in 2008), it is the second consecutive year that this score has declined. CAD-TMC integration is central to the FHWA TIM Performance Measures Focus States Initiative (TIM PM FSI) and set backs in this area will impact the ability of States to collect and analyze the data necessary to track the FSI-identified performance measures.
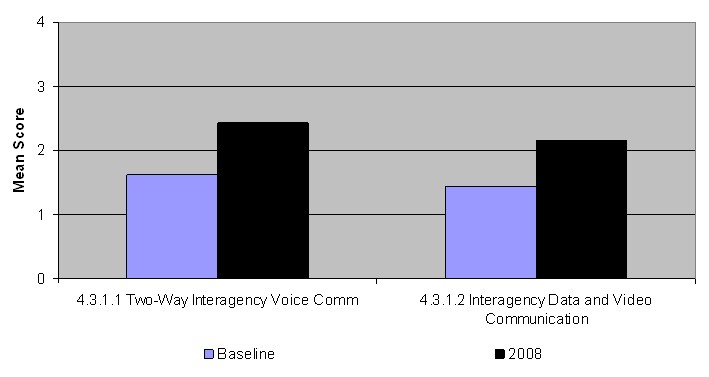
Figure 11. Integrated Interagency Communications.
Figure 12 shows the changes in scores from the Baseline for the three questions in Transportation Management Systems. Question 4.3.2.1 on the use of Traffic Management Centers (TMCs) to coordinate incident notification and response was the second question in Communications and Technology Issues to experience a decrease in mean score from 2007. A review of the comments submitted with this question indicate that there is a move toward the use of TMCs for coordinating incident notification and response, but presently, that function still primarily resides with public safety dispatchers/public safety answering points (PSAP).
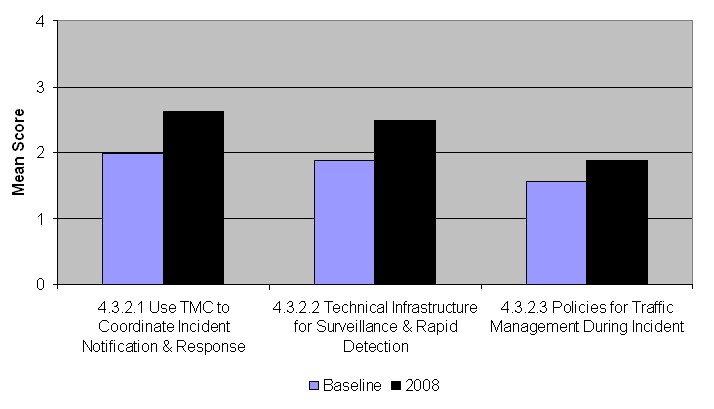
Figure 12. Transportation Management Systems.
Question 4.3.3.3 on providing motorists with travel time estimates experienced the third highest increase over the Baseline of all 34 TIM SA questions. With a mean score of 1.98, there has been over a 100 percent increase from the Baseline (Figure 13).
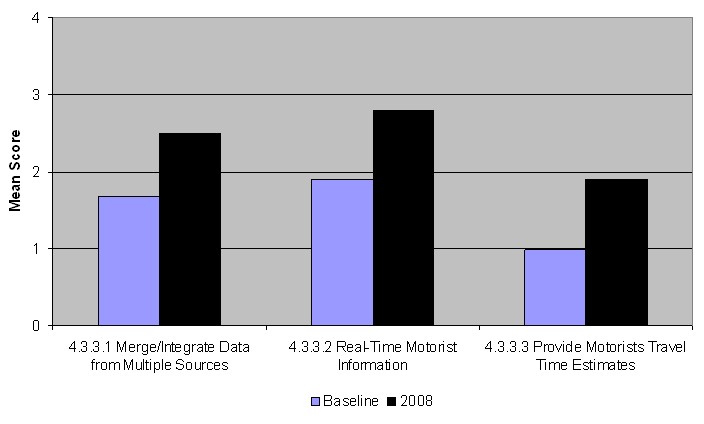
Figure 13. Traveler Information.
Opportunities for FHWA
A primary objective of the TIM SA is to identify those program areas where resources can be deployed to address TIM program gaps, both at the local level and nationally. As evidenced by the top five scoring questions (which maintained their respective rankings from 2007), Operational Issues are where many programs place their focus and where success is being achieved. However, as noted above, the questions in Operational Issues have also experienced some decline in average scores.
Motorist Assist Service Patrols
The use of motorist assist service patrols (4.2.3.6) is down over 3 percent from its high of 2.96 in 2006. In the 2008 TIM SA, nearly 10 percent of the assessments scored this question 0, indicating no activity toward establishment or use of motorist assist service patrols. Since 2006, seven new locations have submitted TIM SAs for inclusion in the national analysis, representing in most cases new or emerging TIM programs. However, there is not a one-to-one relationship between the new TIM SAs and the low scores on this question; among the locations scoring this question lower are those with more active TIM programs (as reflected by higher scores on other TIM SA questions).
A review of the comments submitted indicates that where service patrols do exist, a number of limitations on their full utilization also exist:
- Limited coverage, either geographically or by time of day.
- Core mission tied to maintenance and/or roadway construction support rather than motorist assist for TIM.
- Contracting of resources due to budget constraints.
The net result of these limitations is that law enforcement resources must be shifted from traffic enforcement and other law enforcement activities to more basic TIM functions.
The declining scores in motorist assist service patrols do indicate that guidance from FHWA on the establishment and use of motorist assist service patrols would be of benefit to programs at varying levels of program maturity, and represent an opportunity to advance the mean score back to its high of 2.96 and beyond. In addition to detailing how to establish and operate a service patrol, any guidance offered by FHWA should quantify the return on investment for service patrol personnel conducting TIM functions while law enforcement focuses on more traditional law enforcement activities.
Incident Command System
The disconnect between ICS training and ICS utilization at incident scenes continues. As has been noted in previous TIM SA National Analysis Reports, this may be indicative of a larger issue?the need to view TIM as a critical part of national preparedness and not simply a congestion mitigation strategy.
FHWA should be aware of this issue, and capitalize on the opportunity to highlight TIM as part of a national preparedness framework through its TIM guidance documents and TIM-related outreach programs.
HAZMAT Response Policies and Procedures
For several years, the TIM SA scores have documented a leveling off in effort relating to Operational Issues. In particular, the scores on HAZMAT incident response policies and procedures have been in decline.
FHWA has an opportunity to collect and disseminate best practices in HAZMAT response to reverse that trend, and to ensure that the HAZMAT resources, which are being successfully identified (question 4.2.1.3), are also effectively deployed.
CAD-TMC Integration
In the 2008 TIM SA National Evaluation Report (July 2008), it was noted that an additional decline in the mean score for CAD-TMC integration (4.3.1.2) would negatively impact success in TIM performance measures. A cornerstone of the FHWA TIM performance measures initiative is in collating data from multiple sources to track and analyze achievement of the identified TIM performance measures (incident clearance time, roadway clearance time, and reduction of secondary crashes). The mean score for CAD-TMC integration (4.3.1.2) did in fact experience a decline for the second consecutive year, down to 2.17 in 2008 from the high of 2.22 in 2006. Further, the percentage of assessments scoring this question 3 or higher (pointing to success) decreased from 46 percent in 2006 to 43 percent in 2008.
This decrease provides a timely opportunity to input into FHWA's current TIM roadmap, specifically the planned TIM Performance Measures Knowledge Management System. As the FHWA TIM Performance Measures Knowledge Management System is developed and implemented, a primary focus should be on the data and architecture issues surrounding CAD-TMC integration to provide more readily available best practices and lessons learned.
Peer-to-Peer Network
Promulgating the best practices and real-world experience of TIM programs across the country in developing, implementing, and maintaining TIM program components is perhaps the best tool for advancing TIM success. The 2008 TIM SA National Evaluation Report documented the power of the annual assessments for identifying leaders in each TIM program (Strategic, Tactical, and Support).
Commencing with the 2009 TIM SA, FHWA should inform respondents that the top performers in each TIM SA subsection will be identified and listed as peer-to-peer contacts for others wanting to increase their scores. The 2009 TIM SA National Analysis Report should then provide contact information for each of the top performers, and encourage collaboration among top performers and emerging programs to improve overall TIM performance and raise TIM SA scores accordingly.
Leveraging Other Programs
There are a number of concurrent efforts underway that can and should be leveraged to improve TIM performance, and therefore, increase TIM SA scores.
National Traffic Incident Management Coalition
The NTIMC, representing the broad range of TIM stakeholders, provides an opportunity to increase TIM SA scores. As one of the proposed action items in its draft strategic plan/work plan, the NTIMC leadership has identified linking the gap analysis provided by the annual TIM SA to NTIMC National Unified Goal (NUG) implementation activities. As provided in the following example, a recommended course of action for leveraging the NTIMC membership would be as follows:
- TIM SA results quantify program gap in HAZMAT response policies and procedures.
- FHWA Operations roadmap utilizes the findings to prioritize the collation and dissemination of HAZMAT response best practices.
- Resulting product is vetted through NTIMC membership before publication.
- Final product bearing NTIMC imprimatur distributed by FHWA through States and through NTIMC membership.
Another possible avenue for leveraging the NTIMC would be the proposed regional workshops that are listed in the NTIMC's draft work plan. The annual TIM SA results would be used to identify program gaps. The top performers in those specific program areas could be tapped as speakers at NTIMC-hosted regional workshops, providing real-world examples and details on how success can be achieved.
State Strategic Highway Safety Plans
The 2005 surface transportation reauthorization act, Safe, Accountable, Flexible, Efficient Transportation Equity Act: A Legacy for Users (SAFETEA-LU), required State DOTs to develop a Strategic Highway Safety Plan (SHSP). The SHSP is a statewide coordinated plan for reducing accidents and the resulting fatalities and injuries on all public roads. There are States that have listed TIM as a key emphasis area in their respective SHSP. However, in many other States, the connection between TIM and SHSP goals is not readily recognized.
The TIM SA revision, which will launch with the 2009 TIM SA, clarifies the relationship between TIM program components and SHSP program goals. This revision is intended to reflect in the TIM SA scores the success being achieved by the same stakeholder groups in the SHSP. Where other opportunities to strengthen the nexus between the two complementary programs exist, FHWA should capitalize on those opportunities.
The Revised TIM SA – 2009 and Beyond
The connectivity between TIM and SHSP is just one piece of the revised TIM SA. As noted earlier in this report, areas where TIM SA scores and accompanying comments have indicated confusion in the question's intent have been revised in an effort to eliminate confusion. For instance, question 4.2.3.4 currently asks about the use of quick clearance policies. In the revised TIM SA, the presence of quick clearance policies is queried in separate questions on authority removal laws, driver removal laws (steer it, clear it) and move over laws (for responder safety). This will allow for a more accurate gap analysis on three quick clearance policies (each with discrete goals), rather than grouping the three together in one question.
Other features of the revised TIM SA are:
- A revised scoring approach using Low, Medium and High.
- An online version of the TIM SA for ease of completion.
Summary
A total of 76 TIM SA were completed in 2008, with an average overall score of 59.6 percent (out of a possible 100 percent). Overall scores are up nearly 30 percent (29.9 percent) over the Baseline scores. The highest scores were achieved in Operational Issues (66.2 percent) and the largest percentage increase in scores from the Baseline was in Communications and Technology Issues.
Tables 15 and 16 show the highest and lowest mean scores, respectively. Both sets of questions, along with the largest change in mean score (Table 17) and smallest change in mean score (Table 18) present both challenges and opportunities for FHWA. Specifically, the 2008 TIM SA scores highlight a need for additional guidance in the following areas:
- Motorist Assist Service Patrols.
- Incident Command System.
- Hazardous Materials Response Policies and Procedures.
- CAD-TMC Integration.
The potential for peer exchange utilizing top TIM performers in each of the program areas (Strategic, Tactical, and Support) is proposed as a means for advancing TIM program success and ultimately TIM SA scores in those areas. Other programs that should be leveraged for TIM program success (and improving TIM SA scores) are the National Traffic Incident Management Coalition and the work being done by States in their State Highway Strategic Safety Plans.
| Mean Score Rank in 2008 / Baseline | Question Number | Question | 2008 Mean Score (n=76) | % Scoring 3 or Higher (2008) | % Change in 2008 /Baseline Mean Scores |
|---|---|---|---|---|---|
| 1/4 | 4.2.1.3 Operational Issues | Have a pre-identified (approved) contact list of resources (including special equipment) for incident clearance and hazardous materials response? | 3.2 | 86% | 11.90% |
| 2/1 | 4.2.1.2 Operational Issues | Identify high-ranking agency members available on 24/7 basis to respond to a major incident (Major Incident Response Team)? | 3.16 | 78% | 9.00% |
| 3/1 | 4.2.3.5 Operational Issues | Have a pre-qualified list of available and contracted towing and recovery operators (to include operators' capabilities)? | 2.99 | 76% | 3.30% |
| 4/6 | 4.2.3.1 Operational Issues | Utilize the Incident Command System? | 2.92 | 78% | 14.60% |
| 5/8 | 4.1.2.5 Program and Institutional Issues | Conduct planning for "special events?" | 2.87 | 54% | 16.20% |
| Mean Score Rank in 2008/ Baseline | Question Number | Question | 2008 Mean Score (n=76) | % Scoring3 or Higher (2008) | % Change in 2008/ Baseline Mean Scores |
|---|---|---|---|---|---|
| 34/32 | 4.1.3.4 Program and Institutional Issues | Conduct periodic review of whether or not progress is being made to achieve targets? | 1.36 | 19% | 83.80% |
| 33/33 | 4.1.3.2 Program and Institutional Issues | Have agreed upon methods to collect and analyze/track performance measures? | 1.46 | 12% | 127.60% |
| 32/34 | 4.1.3.1 Program and Institutional Issues | Have multi-agency agreements on what measures will be tracked and used to measure program performance? | 1.52 | 13% | 136.70% |
| 31/30 | 4.1.3.3 Program and Institutional Issues | Have established targets for performance (Response, Clearance)? | 1.57 | 13% | 35.60% |
| 30/27 | 4.2.2.4 Operational Issues | Have mutually understood equipment staging and emergency lighting procedures on-site to maximize traffic flow past an incident while providing responder safety? | 1.88 | 22% | 36.00% |
| Mean Score Rank in 2008/Baseline | Question Number | Question | 2008 Mean Score (n=76) | % Scoring 3 or Higher (2008) | % Change in 2008 Mean Scores from Baseline |
|---|---|---|---|---|---|
| 32/34 | 4.1.3.1 Program and Institutional Issues | Have multi-agency agreements on what measures will be tracked and used to measure program performance? | 1.52 | 13% | 136.70% |
| 33/33 | 4.1.3.2 Program and Institutional Issues | Have agreed upon methods to collect and analyze/track performance measures? | 1.46 | 12% | 127.60% |
| 26/31 | 4.3.3.3 Communication and Technology Issues | Provide motorists with travel time estimates for route segments? | 1.98 | 34% | 100.30% |
| 34/32 | 4.1.3.4 Program and Institutional Issues | Conduct periodic review of whether or not progress is being made to achieve targets? | 1.36 | 19% | 83.80% |
| 27/26 | 4.1.2.3 Program and Institutional Issues | Conduct training through simulation or "in-field" exercises? | 1.97 | 33% | 56.70% |
| Mean Score Rank in 2008/ Baseline | Question Number | Question | 2008 MeanScore (n=76) | % Scoring 3 or Higher (2008) | % Change in 2008 Mean Scores from Baseline |
|---|---|---|---|---|---|
| 8/3 | 4.2.3.3 Operational Issues | Have specific policies and procedures for hazardous materials response that also address maintenance of traffic flow? | 2.73 | 66% | -5.60% |
| 11/7 | 4.2.3.2 Operational Issues | Have specific policies and procedures for fatal accident investigation that also address maintenance of traffic flow? | 2.61 | 55% | 3.10% |
| 3/2 | 4.2.3.5 Operational Issues | Have a pre-qualified list of available and contracted towing and recovery operators (to include operators' capabilities)? | 2.99 | 76% | 3.30% |
| 6/5 | 4.2.3.6 Operational Issues | Use motorist assist service patrols? | 2.87 | 76% | 5.00% |
| 2/1 | 4.2.1.2 Operational Issues | Identify high-ranking agency members available on 24/7 basis to respond to a major incident (Major Incident Response Team)? | 3.16 | 78% | 9.00% |
Table 19 shows the urban areas completing the TIM SA each year since the initial assessments in 2003.
| State – Urban Area | 2003 | 2004 | 2005 | 2006 | 2007 | 2008 |
|---|---|---|---|---|---|---|
| AK | RA | RA | ||||
| AL – Birmingham | B | RA | RA | RA | RA | |
| AZ – Phoenix | B | RA | RA | RA | ||
| AZ – Tucson | B | RA | RA | RA | ||
| AR – Little Rock | B | RA | RA | RA | RA | |
| CA – Bakersfield | ||||||
| CA – Fresno | ||||||
| CA – Los Angeles | B | |||||
| CA – Sacramento | B | |||||
| CA – San Diego | b | RA | ||||
| CA – San Francisco | b | RA | ||||
| CO – Denver | B | RA | RA | RA | RA | |
| CT – Hartford | B | RA | RA | RA | RA | |
| DC – Washington | B | RA | RA | RA | RA | |
| FL – Ft. Lauderdale | B | RA | RA | RA | ||
| FL – Miami-Dade | B | RA | RA | RA | ||
| FL – Jacksonville | B | RA | RA | RA | ||
| FL – Orlando | B | RA | RA | RA | ||
| FL – Sarasota-Bradenton | RA | RA | ||||
| FL – St. Petersburg-Clearwater | B | RA | ||||
| FL – Tampa-Hillsborough | B | RA | RA | |||
| FL – West Palm Beach | B | RA | RA | RA | ||
| GA – Atlanta | B | RA | RA | RA | ||
| HI – Honolulu | B | RA | RA | RA | ||
| IL – Chicago | B | RA | RA | RA | RA | |
| IN – Indianapolis | B | RA | RA | RA | RA | |
| KY – Lexington | RA | RA | ||||
| KY – Louisville | B | RA | RA | RA | ||
| LA – Baton Rouge | B | RA | RA | RA | ||
| LA – New Orleans | B | RA | RA | RA | ||
| MD – Baltimore | B | RA | RA | RA | RA | |
| MD – Suburban Wash DC | B | RA | RA | RA | RA | |
| MA – Boston | B | RA | RA | RA | ||
| MA – Springfield | RA | RA | RA | |||
| ME – I-95 Corridor | RA | RA | ||||
| MI – Detroit | B | RA | RA | RA | RA | |
| MI – Grand Rapids | B | RA | RA | RA | RA | |
| MN – Minneapolis | ||||||
| MO – Kansas City | B | RA | RA | RA | RA | |
| MO – St. Louis | RA | RA | RA | RA | ||
| MS | RA | |||||
| NE – Omaha | B | RA | RA | RA | RA | |
| NV – Las Vegas | B | RA | RA | RA | RA | |
| NM – Albuquerque | B | RA | RA | RA | RA | |
| NY – Albany | B | RA | RA | RA | RA | |
| NY – Buffalo | B | RA | RA | RA | RA | |
| NY – New York | B | RA | RA | RA | RA | |
| NY – New York-North NJ | RA | |||||
| NY – Rochester | B | RA | RA | RA | RA | |
| NY – Syracuse | B | RA | RA | RA | RA | |
| NC – Charlotte | B | RA | RA | RA | RA | |
| NC – Greensboro-WS-HP | B | RA | RA | RA | RA | |
| NC – Raleigh-Durham | B | RA | RA | RA | RA | |
| OH – Cincinnati | B | RA | RA | RA | RA | |
| OH – Cleveland | B | RA | RA | RA | RA | |
| OH – Columbus | B | RA | RA | RA | RA | |
| OH – Dayton | B | RA | RA | RA | RA | |
| OH – Toledo | B | RA | RA | RA | RA | |
| OH – Youngstown | B | RA | RA | RA | RA | |
| OK – Oklahoma City | B | RA | RA | RA | ||
| OK – Tulsa | B | RA | RA | RA | ||
| OR – Portland | B | RA | RA | RA | RA | |
| PA – Allentown-Bethlehem | RA | RA | RA | |||
| PA – Harrisburg | RA | RA | RA | |||
| PA – Philadelphia | B | RA | RA | RA | RA | |
| PA – Pittsburgh | B | RA | RA | RA | RA | |
| PA – South New Jersey | RA | RA | ||||
| PA – Wilkes Barre-Scranton | RA | RA | RA | |||
| PR – San Juan | B | RA | RA | RA | RA | |
| RI – Providence | B | RA | RA | RA | ||
| SC – Greenville-Spartanburg | RA | RA | RA | RA | ||
| SD | RA | |||||
| TN – Chattanooga | RA | RA | ||||
| TN – Knoxville | B | RA | RA | RA | RA | |
| TN – Memphis | B | RA | RA | RA | RA | |
| TN – Nashville | B | RA | RA | RA | RA | |
| TX – Austin | B | RA | RA | RA | RA | |
| TX – Dallas-Ft. Worth | B | RA | RA | RA | RA | |
| TX – El Paso | B | RA | RA | RA | RA | |
| TX – McAllen (Pharr Dist) | B | RA | RA | RA | ||
| TX – Houston | B | RA | RA | RA | ||
| TX – San Antonio | B | RA | RA | RA | RA | |
| UT – Salt Lake City | B | RA | RA | RA | RA | |
| VA – Norfolk-Virginia Beach | B | RA | RA | RA | RA | |
| VA – No. VA-Sub. Wash DC | B | RA | RA | RA | RA | |
| VA – Richmond | B | RA | RA | RA | RA | |
| WA – Seattle | B | RA | RA | RA | RA | |
| WY | RA | RA | ||||
| WI – Milwaukee | B | RA | RA | RA | RA | RA |
B = Baseline. RA = Re-assessment. |
||||||