|
|
|
|
Transportation Asset Management is a strategic approach to managing transportation infrastructure. It includes a set of principles and practices for building, preserving and operating facilities more cost-effectively and with improved performance, delivering the best value for public tax dollar spent, and enhancing the credibility and accountability of the transportation agency. Fundamental elements of asset management include:
Specific applications in support of asset management to date have emphasized maintenance and replacement decisions for the most costly elements of transportation infrastructure - pavements and bridges. Relatively little work has been done on how to apply the principles of Transportation Asset Management to operational decisions, or to develop specific approaches to making tradeoffs between operations investments and capital infrastructure investments. Given the increasing emphasis on enhanced operational capabilities and deployment of Intelligent Transportation Systems (ITS) technology, there is a need to investigate and improve the state-of-the-practice with respect to operations asset management.
The FHWA Office of Transportation Management has undertaken the Investigation of Signal System Assets Management Methodology and Process Elements project, Task Order Number CA81F042. The purpose of this project is to obtain a better understanding of operations-level asset management by examining the specific case of signal systems. Key products will include:
The model signal systems asset management system will include the following three key aspects of signal system operations and management:
Therefore, the data collection effort was structured to explore each of these areas and to gain insights into how agencies balance investments in these three areas as they maintain and improve their signal systems.
This memo presents a synthesis of existing practice, based on collection of structured information from state and local agencies with signal system management responsibilities. One hundred twenty agencies were contacted and asked to fill out a data collection instrument placed on the web. The instrument was designed to collect basic information on the size and characteristics of each agency's signal system, and to provide an indication of the extent to which asset management principles (as described above) were being applied. Participation in the data collection was voluntary and 26 agencies responded during the fall and winter of 2003-2004. In-depth interviews with selected agencies will be used to supplement this information in order to provide input for development of the generic signal system asset management system model.
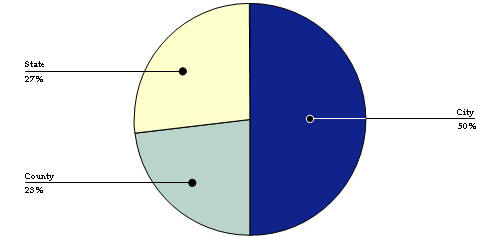
Of the 26 agencies that responded to the interview about half (52 percent) were city agencies with the remainder split between States and Counties. These results are summarized in Figure 1. The data collection targeted mid-sized agencies (with 200 to 1,000 signals), which have a sufficient degree of complexity in their operations to merit a structured approach to asset management, but not such a large scale so as to create unique requirements or allow for major efforts that are not representative of the majority of agencies.
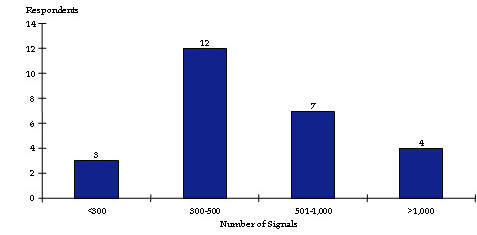
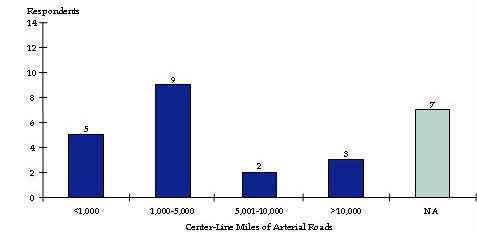
As shown in Figure 2, about half the respondents (12) reported jurisdiction over 300 to 500 signals while another seven reported having 501 to 1,000. Respondents were asked how many center-line miles of arterial road were under their jurisdiction. The majority of respondents (14) reported having less than 5,000 miles of center-line road, while five of the 14 had less than 1,000. Seven agencies did not respond. Responses are shown in Figure 3.
Staff levels for agencies were measured per hundred signalized intersections (SI). The average staffing reported was 0.32 staff/100 SI in operations management, 0.34 staff/100 SI in maintenance management, 0.50 staff/100 SI in operations staff and 1.45 staff/100 SI in maintenance staff. The majority of agencies had traffic engineers and electricians in house, while only half had electrical engineers, mechanical engineers or communications engineers on staff.
Agency budgets for signal systems are typically divided into the following three categories:
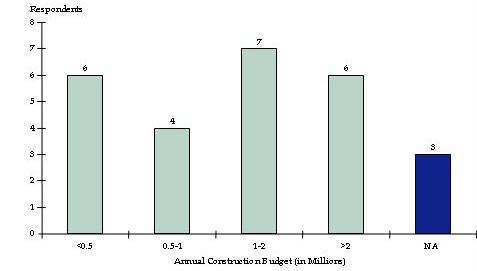
Figure 4 shows reported annual construction budgets. Responding agencies were split evenly between the categories with six reporting budgets of under $500,000 and six reporting budgets of over $2 million. The number of responding agencies in each annual construction budget category is presented in Table 1 according to agency size. As expected, larger systems tend to have larger construction budgets.
|
Number of Signals |
Less Than 0.5 | 0.5 to 1 | 1 to 2 | More Than 2 | NA |
|---|---|---|---|---|---|
| Less than 300 | 2 | 1 | 0 | 0 | 0 |
| 300 to 500 | 2 | 2 | 4 | 2 | 2 |
| 501 to 1,000 | 1 | 1 | 3 | 2 | 0 |
| More than 1,000 | 1 | 0 | 0 | 2 | 1 |
In Figure 5, a similar distribution is reported for maintenance budgets, with six agencies reporting budgets of under $500,000 and six reporting budgets of over $2 million. The number of responding agencies in each annual maintenance budget category is presented in Table 2 according to agency size. Agency size does not seem to have as much of a correlation with maintenance budgets.
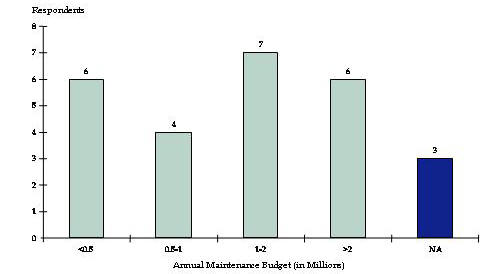
|
Number of Signals |
Less Than 0.5 | 0.5 to 1 | 1 to 2 | More Than 2 | NA |
|---|---|---|---|---|---|
| Less than 300 | 1 | 0 | 0 | 2 | 0 |
| 300 to 500 | 2 | 1 | 4 | 4 | 1 |
| 501 to 1,000 | 2 | 2 | 2 | 0 | 1 |
| More than 1,000 | 1 | 1 | 1 | 0 | 1 |
Operations budgets, as shown in Figure 6, tend to be lower, with nine agencies reporting budgets of under $500,000 and only three reporting over $2 million. Again, the number of responding agencies in each annual operations budget category is presented in Table 3 according to agency size.
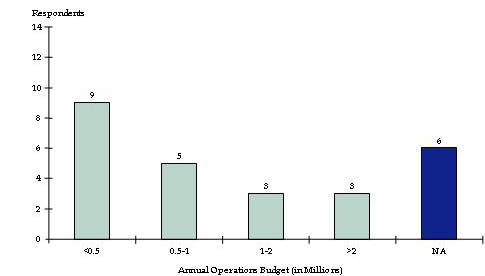
|
Number of Signals |
Less Than 0.5 | 0.5 to 1 | 1 to 2 | More Than 2 | NA |
|---|---|---|---|---|---|
| Less Than 300 | 1 | 0 | 0 | 2 | 0 |
| 300 to 500 | 4 | 3 | 2 | 0 | 3 |
| 501 to 1,000 | 3 | 1 | 1 | 1 | 1 |
| More Than 1,000 | 1 | 1 | 0 | 0 | 2 |
The use of software tools can provide an indication of the extent to which agencies are applying the asset management principles outlined at the start of this memo. Making informed decisions based on quality data depends on having a systematic approach to collecting, storing, analyzing and using information.
Respondents were asked which of the following types of software tools they use for signal system management. These tools collectively address physical, system and personnel aspects of signal systems asset management:
Figure 7 shows the percentage of respondents using each type of software tool. Signal optimization/simulation software is used by nearly all responding agencies, and a majority of agencies have implemented systems for inventory and maintenance management. This indicates that the starting point for effective management of physical assets is generally (but not universally) in place - software that allows agencies to track what they own. The relatively high level of use of maintenance management software provides an indication that tools are in use providing capabilities to manage these physical assets effectively, anticipate and plan for preventive maintenance needs and to monitor actual costs over time. Maintenance management software also allows agencies to better understand the personnel requirements associated with different types of work activities.
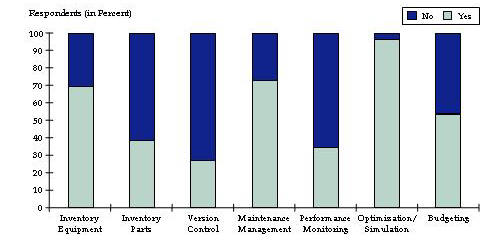
The consistent use of signal optimization/simulation software indicates that agencies are making use of analytical tools to optimize system performance, which is consistent with asset management practice (ensuring effective delivery of services). Greater use of performance monitoring tools (which are typically an integral part of signal management and control software) would strengthen asset management capabilities in the systems area by providing a feedback loop. Performance monitoring capabilities are likely to improve over time as agencies pursue upgrades to signal system technology.
Table 4 lists the types of software used under each category. A wide variety of software is used, ranging from standard MS Office products such as Access and Excel to highly specialized systems. There is a mix of "home grown" systems and commercial software. Several agencies are using software tools that incorporate functions from several of the different software categories in an integrated fashion. Packages such as Hansen, VHB's Infrastructure 2000, and CarteGraph provide inventory, parts tracking, maintenance management/work orders, cost-tracking, and budgeting capabilities. Performance monitoring tools cited are part of signals or broader ITS management and control software packages; some of these tools (e.g., Siemens i2tms) include links to signal timing optimization software.
| Name of Inventory Tracking Software for Field Equipment: |
|
Access Database - PYRAMIDS |
|
AFMS - In-house Oracle Database (Signals and Lighting) |
|
CarteGraph |
|
Custom SmartWare II DOS-based inventory databases, custom Windows-based object-oriented database ("MONOLITH"), and ESRI GIS mapping (shape files) |
|
Great Plains - Dynamics accounting software (Microsoft) |
|
i2tms - integrated traffic management system (Siemens) |
|
Infrastructure 2000 (Vanasse Hangen Brustlin) |
|
Maintenance Management System |
|
MS Access |
|
MS Excel |
|
MS Office |
|
Operations Management System (in-house operations budgeting and tracking software) |
|
Paradox |
|
RCMC (in house) |
| Name of Inventory Tracking Software for Spare Parts |
|
AFMS - In-house Oracle Database |
|
CarteGraph |
|
Great Plains - Dynamics |
|
Infrastructure 2000 Vanasse Hangen Brustlin |
|
MS Excel |
|
MS Office |
|
RCMC in-house |
| Name of Hardware/Software Version Control Software |
|
CarteGraph |
|
Computran UTCS Protocol 90 |
|
Infrastructure 2000 (Vanasse Hangen Brustlin) |
|
MS Office |
|
Translink |
|
WAPITI W4IKS, HCII rev 14/45A |
| Name of Maintenance/Work Order Management Software |
|
AFMS - In-house Oracle Database (Signals and Lighting) |
|
CarteGraph |
|
CASSWORKS |
|
FileMaker |
|
FoxPro and MS Access to a database |
|
Hansen Information Technologies |
|
Infrastructure 2000 Vanasse Hangen Brustlin |
|
Maintenance Management System |
|
MS Access |
|
MS Excel |
|
MS Word |
|
Paradox |
|
RCMC |
|
TNI/PDA - Allows for wireless Internet connectivity to fill out and submit electronic work orders |
| Name of System Performance Monitoring Software |
|
Computran UTCS Protocol 90 |
|
i2tms |
|
JHK2000 and Naztec |
|
MONARCH/SCOOT |
|
Multi-Arterial Signal System |
|
PYRAMIDS and TNI/PDA - Both allow controller notification of problems |
|
TransCore Series 2000 |
|
Name of Signal Timing Optimization/Simulation Software |
|
CORSIM |
|
HCM Cinema |
|
HCS 2000 |
|
NETSIM |
|
No-stop |
|
Paramics |
|
Passer II |
|
Signal2000 |
|
SimTraffic |
|
SYncgri TS-PP |
|
Synchro |
|
Synchro and SimTraffic |
|
SynchroPro |
|
TEPAC 2000 |
|
Transyt-7F |
|
TSIS |
|
TS-PPD |
| Name of Budgeting Software |
|
MS Excel |
|
Operations Management System |
|
FileMaker |
|
Banner |
|
RCMC |
|
Maintenance Management System |
|
SAP |
|
County's budget software |
|
ADVANTAGE TOOL |
|
Utah State Budgeting Software |
Table of Contents | List of Tables | List of Figures | Top of Page | Top of Section | HOME
Respondents were asked what types of data they maintain about major components, including signal heads, detectors, controllers, structures and communications equipment. The types of information listed on the data collection instrument included component characteristics, serial numbers, maintenance requirements, maintenance costs and history, repair and failure history and age/condition. The results are shown in Table 5.
|
Information |
Signal Heads | Detectors | Controllers | Structures | Communications Equipment |
|---|---|---|---|---|---|
| Characteristics of Components (equipment models, functions, etc.) | 46% | 46% | 62% | 35% | 50% |
| Serial Numbers of Components | 12% | 12% | 31% | 80% | 12% |
| Maintenance Requirements | 12% | 15% | 27% | 80% | 15% |
| Maintenance Costs/History | 42% | 38% | 46% | 35% | 38% |
| Repair/Failure History | 38% | 31% | 50% | 35% | 38% |
| Age/Conditions | 19% | 27% | 46% | 23% | 31% |
Most respondents reported keeping some type of information on one or more signal system components, with the largest number reporting that they maintain information on signal heads and controllers. However, there was significant variation across agencies with respect to the type of data they maintain. As illustrated in Table 5, only five elements (component/data type combinations) were maintained by 50 percent or more of the respondents.
The results indicate that while many agencies do have inventory and maintenance management systems, relatively few keep track of information such as failure rates, repair histories, maintenance costs and maintenance requirements that are needed to pursue a more proactive approach to management of physical assets. Without this type of information, it is difficult to develop effective preventive maintenance strategies. It is also difficult to build accurate predictive capabilities to demonstrate the likely impacts of different investment levels or packages of improvement options.
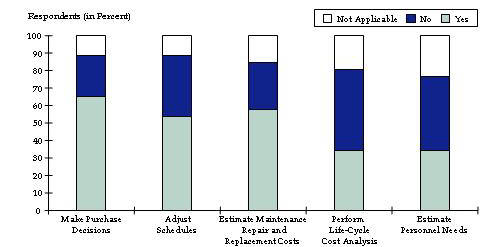
Respondents were asked whether they use the component information they maintain for a) equipment purchase decisions, b) adjusting preventive maintenance schedules, c) estimating maintenance, repair and replacement costs, d) analyzing life-cycle costs, and e) estimating personnel needs. As shown in Figure 8, one-third or more of the respondents said that they used the information for each of these areas. The most commonly cited uses of component information were for equipment purchase decisions and cost estimation. The least common use of the data was for life-cycle cost analysis (which would depend on a richer set of cost-tracking data than most agencies keep) and estimation of personnel needs (which would depend on using maintenance management/work tracking capabilities to analyze personnel requirements associated with preventive and responsive work on components).
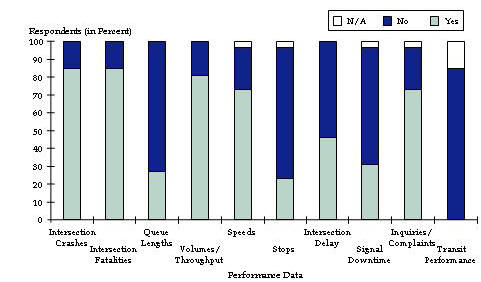
Investments in signal systems are made in order to provide safe and efficient movement of traffic. Therefore information about system performance - in terms of crashes, throughput, delays, stops, travel time/speed are important metrics for evaluating the effectiveness of signal system investments, and for providing valuable input needed for effective management and operation of signal systems.
Respondents were asked whether they collect system performance data, which items they collected and how. Results are shown in Figure 9 and Table 6. As shown in Figure 9, the most commonly collected performance data items were intersection crashes and fatalities (through established police reporting procedures and agency crash records systems) volumes/throughput and speeds (through automated and manual traffic counts, video monitors, special studies and signal system control/management software), and inquiries/complaints (through a variety of automated and manual tracking systems, some of which are integrated with maintenance management software). Just under half the respondents report collecting data on intersection delays; those that did used a variety of methods including traffic monitors, special studies, and simulation tools. Very few collected information on queue lengths, stops, and signal downtime. Agencies that did collect information on queue lengths and number of stops used a similar set of methods as those used for information delay. Sources of information on signal downtime included the signal system management software, work orders, and manual log books.
| Methods of Data Collection |
| Intersection Crashes |
|
Police/crash Reports |
|
Accident report system |
|
Statewide accident database |
| Intersection Fatalities |
|
Police/crash Reports |
|
Accident report system |
|
Statewide accident database |
| Queue Lengths |
|
Analysis model output |
|
Studies performed as needed |
|
Loop Detectors |
| Volumes/Throughput |
|
PETRA by JAMAR |
|
Mechanical and manual traffic counts |
|
24-hour, bi-directional |
|
Studies performed as needed |
|
From signal systems |
|
Loop detectors |
|
ADT and peak-period turning movement counts |
|
Video |
| Speeds |
|
Radar speed studies |
|
PC Travel by JAMAR |
|
Video |
|
Tube and manual speed studies |
|
Studies performed as needed |
|
From signal systems |
|
Loop detectors |
| Number of Stops |
|
PC Travel by JAMAR |
|
Analysis model outputs |
|
Studies performed as needed |
|
Driving/time runs |
| Intersection Delay |
|
Observation |
|
PETRA |
|
Analysis model output |
|
HCM/Synchro |
|
Studies performed as needed |
|
Loop detectors |
|
Calculated through TMC data collection devices |
| Signal Downtime |
|
Maintenance/work order records |
|
Technician's log book |
|
Studies performed as needed |
|
Computerized signal control system |
|
Central Software |
| Number of Constituent Inquiries/Complaints |
|
Manual and Action Center Request |
|
Complaint office |
|
In-house filing system (paper) |
|
Customer Service Response by Motorola |
|
Customer Contact System used by our front office |
|
SAP |
|
County Database |
|
MS Excel spreadsheet |
|
Hansen Information Technologies |
|
Cassworks |
|
Manually record all citizen complaints/requests in a database |
|
Log |
|
Maintenance/work order records |
| Transit Performance |
|
NA |
Figure 10 summarizes the reported uses of performance data for decision-making. The most common uses are 1) identifying needs for signal coordination; 2) identifying need for traffic control changes; and 3) identifying improvement needs. Over half the respondents also reported using performance data for real-time signal timing adjustment, periodic signal timing adjustment and planning equipment replacement.
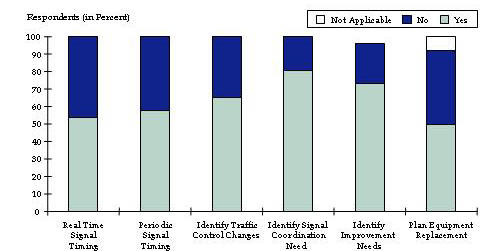
Table of Contents | List of Tables | List of Figures | Top of Page | Top of Section | HOME
Questions were asked about improvement priorities in order to understand the types of options and tradeoffs that respondents are considering in order to improve the performance of their signal systems. The signal systems asset management approach should provide methods for analyzing these options and tradeoffs.
Figure 11 summarizes respondents' priorities for signal improvements in the systems area. The highest priority types of improvements (cited by 40 percent or more of respondents) were adjustment/upgrade of existing signals, integration of signals within their own jurisdictions, improvement of system capabilities and establishing/upgrading a Traffic Management Center.
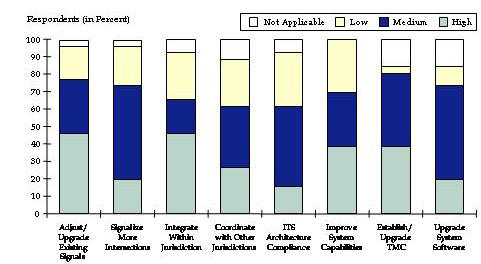
Figure 12 summarizes respondents' priorities for physical signal improvements. The highest ratings were given for replacement/repair of signal equipment, reduction in responsive repair costs and upgrade of communications.
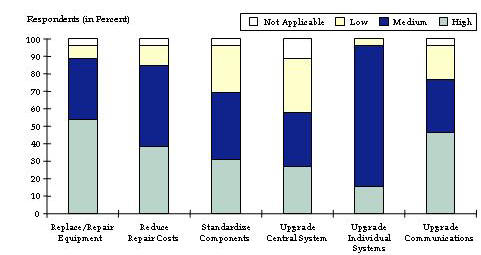
Figure 13 summarizes priorities in the personnel category. The highest priority was on increasing the number of operations and maintenance staff followed by improving the match between staff skills and work needs. The low rating for contractor responsiveness is a function of the fact that only a few of the responding agencies use contract services for operations or maintenance. Four agencies outsourced work to private contractors for repairs, two for maintenance and none for operations.
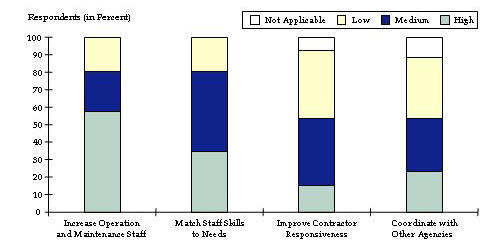
Looking across the three categories (physical, system and personnel), the highest overall priorities (over 50 percent of respondents gave a high rating) are for equipment repair/replacement and increasing staff.
Table of Contents | List of Tables | List of Figures | Top of Page | Top of Section | HOME
Respondents were asked to indicate the types of tradeoffs they considered in signal management decisions. These results are shown in Figure 14 and indicate that most of the agencies do consider investments in new technology as a way to free up staff time for other activities. Almost half of the agencies also reported that they have well-defined criteria or methods for deciding how to allocate available resources between maintaining existing physical signal infrastructure (e.g., equipment replacement) versus improving the capabilities of the system (e.g., upgrades to improve performance or system expansion).
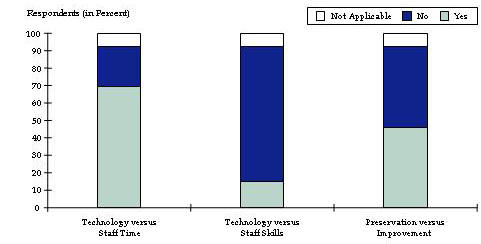
Table of Contents | List of Tables | List of Figures | Top of Page | Top of Section | HOME
Results indicate that agencies are tracking and managing the physical, systems and personnel components of their signal systems at varying levels of sophistication, as appropriate to the scale and complexity of their systems. Tools and techniques are in place to optimize system performance for the road user; most agencies track performance of intersections or groups of intersections with respect to safety and delay; and use this information to identify improvement needs. As agencies upgrade signal management technologies, new real-time capabilities for performance monitoring and control will come on-line which will allow further performance gains to be realized.
With respect to the physical aspect of signal systems, most agencies have basic inventory tracking and maintenance management systems, but relatively few maintain data on failure rates and historical repair costs that would be needed to make a case for doing more preventive (versus reactive) maintenance. This type of data would also be needed to develop predictive capabilities in support of performance-based budgeting approaches. Given the agencies' concerns with respect to budgetary and staff limitations and their desire to reduce repair costs, improved capabilities to both prioritize investments and to demonstrate what could be achieved with additional resources would be valuable.
Agencies are considering tradeoffs between technology and staff resources, and the application of asset management principles will increase the sophistication of this analysis. The detailed case studies conducted in the next phase of the project will help identify asset management tools and practices that will meet agency needs.
Based on the data collected, some preliminary conclusions can be drawn regarding the state-of-the-practice in relation to the asset management principles outlined at the start of this memo. These include:
Table of Contents | List of Tables | List of Figures | Top of Page | Top of Section | HOME