THE DEMAND-SIDE FRAMEWORK
this section outlines a framework for understanding demand-side strategies, their impact on traveler choices, and the varied settings where they are applied
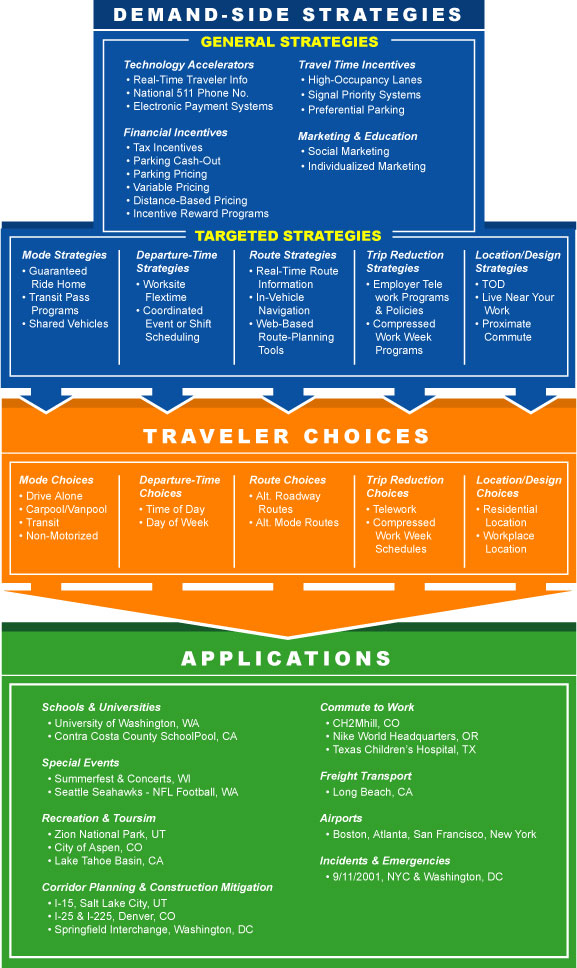
In order to better understand the scope of demand-side strategies, the following section presents a framework outlining three primary areas for discussion of demand-side strategies: the variety of available action strategies, the realm of targeted traveler choices, and the variety of program applications.
The basic framework for how these concepts work together is presented
in Figure 1.
Essentially, in considering demand management programs:
A variety of demand-side strategies are implemented in order to
impact the travel choices of individuals and organizations, in the context
of a wide array of application settings.
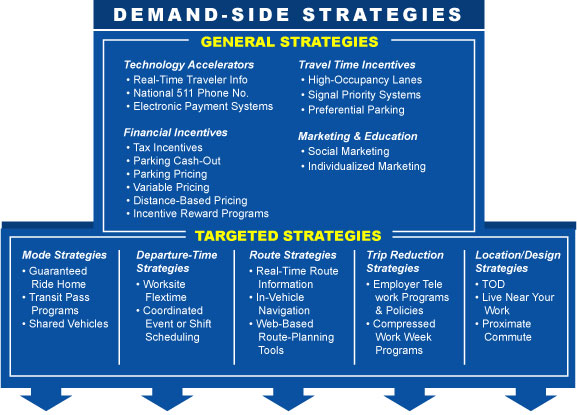
Further detail on each of these three areas is provided below, and illustrated
in Figure 2 on the following page.
Demand-Side Strategies. These are the actual strategies designed and implemented by organizations with a role to play in mitigating traffic congestion, including state/regional/local governments, employers, special event managers, and many others. Organizations frequently tailor packages of both general strategies and targeted strategies to facilitate the most appropriate blend of efficient traveler choices.
Traveler Choices. These are the key travel choices made by individuals and organizations that collectively impact the efficiency and performance of the transportation system. Elements include both day-to-day choices about travel mode, departure-time, and travel route, as well trip reduction choices (i.e., telework) and more fundamental residential and business location choices.
Application Settings. Demand-side strategies impacting traveler choices are tailored for a wide range of different application settings, each addressing different trip types or travel market segments. Examples are shown in Figure 2, along with some of the case studies included in this document.
FIGURE 1: THE THREE CORE ELEMENTS OF DEMAND-SIDE STRATEGIES
___
FIGURE 2: THE THREE CORE ELEMENTS OF DEMAND-SIDE STRATEGIES
___
DEMAND-SIDE STRATEGIES
this section describes the scope of programs and policies implemented by organizations to impact the demand for travel
These are the on-the-ground strategies designed and implemented by organizations with a role to play in mitigating traffic congestion, including state/regional/local governments, transportation management associations, non-profit transportation services providers, transit agencies, employers, special event managers, property managers, and many others. Action strategies can include “general” strategies that have a broad impact on a variety of travel choices. For example, financial incentives can be used to impact travel choices in a variety of ways. In addition to the general strategies available, there are also many “targeted” strategies that focus on a specific travel choice. For example, implementation of workplace “flextime” policies is a demand-side strategy specifically targeting travel departure-time choices. Organizations designing and implementing demand-side strategies frequently tailor appropriate packages of both general and targeted action strategies to facilitate the most appropriate blend of traveler choices.
General Strategies
“General” demand-side strategies impact the full range of traveler choices – from mode choices to departure-time choices and route choices. Ranging from infrastructure investments like high-occupancy vehicle lanes and preferential parking spaces, to more programmatic investments like tax-based incentives, these broad-based, general strategies often work in conjunction with the targeted strategies described below. The full range of general demand-side strategies are described in greater detail in the sections below, and are organized in four primary categories:
• Technology Accelerators
• Financial Incentives
• Travel Time Incentives
• Marketing & Education
Targeted Strategies
Often complementing the more broad-based, general demand-side strategies, an array of demand-side strategies are targeted to specific traveler choices – such as choices regarding travel mode or trip departure time. These targeted strategies are described in detail in the sections below, and are organized around the five primary categories of choices that affect overall transportation demand:
• Mode Strategies
• Route Strategies
• Departure-Time Strategies
• Trip Reduction Strategies
• Location/Design Strategies
General Strategies
General demand-side strategies impact the full range of traveler choices – from mode choices to departure-time choices and route choices.
Technology Accelerators
Advances in technology are quickly accelerating the ability of transportation organizations to implement effective demand-side strategies. Significant investments in intelligent transportation system (ITS) infrastructure throughout the country are yielding increasingly precise, real-time information about transportation conditions (i.e., current traffic congestion, transit vehicle locations and wait times, etc.), and increasingly user-friendly and robust pre-trip travel planning tools – all of which are making it easier for travelers to make smart transportation mode, route, and departure-time choices. Additionally, rapid advancements in broadband and wireless internet connectivity are making trip reduction strategies, like telework and e-commerce, viable for larger segments of society. While ITS hardware and software technologies will continue to improve – demand-side strategies play a critical role ensuring that advances in transportation information technology translate into more efficient mode, route, and departure-time choices by the users of the transportation system. By developing partnerships with employers, property developers and managers, residential districts, transportation providers and others, organizations that design demand-side programs can ensure full integration of technology accelerators and other complementary demand-side strategies (i.e., financial incentives, travel-time incentives, etc.). Specific technology applications accelerating the scope of demand-side strategies include:
• Real-Time Traveler Information
The expanded deployment of intelligent transportation system infrastructure and networks, such as road sensors and video cameras, means that accurate, real-time information about traffic congestion, parking availability, transit arrival times, and more are now available to more and more travelers around the country. Real-time traveler information can be provided through a wide variety of communications mediums, including: (1) websites, (2) telephone systems, (3) wireless devices (cell phones, pagers, PDAs, etc.), (4) information kiosks, (5) variable message signs on roadways, at transit stops, and in parking lots, and (6) in-vehicle navigation systems. In order to reach more people before they make travel decisions, transportation organizations are working with a variety of partners to integrate such real-time traveler information resources into corporate intranets at the workplace, building lobbies and elevators, and residential developments through “internet communities.”
By providing better information about current travel conditions, transportation agencies and their partners allow people to make travel mode, route and time choices that best match their individual travel needs. Real-time travel information evaluations show that – armed with real-time travel information – a significant number of travelers alter their original route, departure-time, and even mode choices, reducing the demand for already congested facilities and maximizing the use of underutilized alternatives.
FAST FACTS: According to a 2001-2002 survey of real-time travel information users, 68% of users in Pittsburgh and 86% of users in Philadelphia changed their original travel route, while 47% of users in Pittsburgh and 66% of users in Philadelphia changed their original time of travel as a result of the traffic information. The effect on mode choice was less noticeable, 6% in Pittsburgh and 2% in Philadelphia changed their mode of transportation based on the information provided. (Fekpe, 2003)
REAL-TIME TRANSIT INFORMATION – REHOBOTH BEACH, DE. Summertime parking and traffic problems in the beach town area around Rehoboth Beach, Delaware, are addressed with seasonal bus services including a park-and-ride Beach Bus. Electronic signs placed at the Rehoboth Park-n-Ride, the Rehoboth Boardwalk, and Dewey Beach’s Ruddertown complex, provide both scrolling text messages and AVL-based bus arrival time predictions (NextBus, 2002). In the season following installation, “ridership increased over 13 percent from the year before. No additional service hours or miles were operated…” (Hickox, 2002). This notable response pertains to a recreation and tourist oriented rider clientele, and the electronic sign placement may have had an advertising as well as informational effect. (TCRP, 2003)
REAL-TIME TRANSIT & PARKING INFORMATION – ACADIA NATIONAL PARK, ME. The Acadia National Park, in Maine, is visited by an increasing number of people each year, exceeding 2.5 million annually in 2002. In 2001-2002, a partnership between the U.S. Departments of Transportation and Interior, Acadia National Park, and the State of Maine, implemented several real-time traveler information systems to provide more timely and accurate information to visitors regarding the Acadia’s Island Explorer free shuttle bus service and on-site parking availability. Components included (1) real-time bus departure electronic message signs, (2) automated on-board “next-stop” announcements on each Island Explorer bus, and (3) real-time parking information made available by website, telephone, and parking status signs.
A visitor survey, conducted near the end of 2002, revealed the following shifts in transportation choices and preferences among park visitors:
• Real-time parking information impacted decisions visitors made about travel in the park. Of visitors using the parking information, 43% changed the time they visited a destination and 38% changed destinations based on the information.
• Visitors strongly believed in the benefits of the Island Explorer’s real-time bus departure signs and the on-board bus announcements. Over 80% found that these technologies made it easier to get around and 69-80% visitors believed they helped to save time.
• Visitors using the electronic bus departure signs and on-board announcements reported that the technologies helped them decide to use the Island Explorer bus (80% and 67%, respectively). 44% of the users of the real time parking information said it helped them decide to use the Island Explorer bus.
(Battelle, 2003)___


• National 511 Phone Number
During the 1990s, a variety of organizations established hundreds of travel information telephone numbers across the country to provide real-time and other transportation information. In 1999, the U.S. Department of Transportation petitioned the Federal Communications Commission for a three-digit dialing code to make it easier for consumers to access these travel information services – using the same, simple phone number nationwide. The FCC assigned the “511” number on July 21, 2000. In early 2004, 511 was available in over 20 states/regions, providing users access to advanced traveler information services.
DID YOU KNOW? By January 2004, the 511 system was available to almost 57 million Americans (19.4%), in over 20 states/regions. In January 2004, 1.8 million calls were placed to the 511 system, with an average length of 1 minute and 46 seconds (for a total of over 3.2 million minutes of call time in the month). (Resource511, 2004)
• Integrated Electronic Payment Systems
Electronic Payment Systems (EPS) allow travelers to pay for transportation services electronically. The advancement of EPS technologies is allowing more widespread – and more integrated – application of electronic payment options for transit, parking, roadway tolls, and other fee-based transportation services. Integrated EPS technologies – from the “smart card” fare payment systems with imbedded microprocessors in each card to the Radio Frequency Identification (RFID) systems at many toll plazas – are quickly reducing many of the barriers to seamless transportation across travel modes and between different transportation providers. EPS technology can allow for seamless payment, with a single fare payment media, across a variety of modes (bus, rail, ferry, etc.), and on a variety of transportation service providers within the same region. Transit agencies and other providers are also exploring adding retail purchase options to fare payment smart cards, allowing transit users convenient purchase of retail goods and services in and around transit stations and stops. In each case, technological advances are enabling more efficient and convenient travel choices.
DID YOU KNOW? Smart card electronic fare payment systems are now in use by transit agencies in over ten regions of the U.S., including Washington, DC; Atlanta, GA Los Angeles, CA; San Francisco, CA; Orlando, FL; Minneapolis, MN; and others. (APTA).
INTEGRATED ELECTRONIC FARE PAYMENT – WASHINGTON, DC. The Washington Metropolitan Transportation Authority’s (WMATA) SmarTrip program was the first public transportation system in the U.S. to adopt smart cards, launching a pilot program in 1999. In June, 2002, WMATA sold its 250,000th SmarTrip permanent rechargeable plastic smart card which holds up to $200.00 in fare value. One third of WMATA Metrorail riders use SmarTrip cards regularly. SmarTrip will be expanded to parking, bus transit, and other regional rail service over a total of 17 transit systems. (APTA, 2003)
___
Financial Measures
Transportation expenses are a major factor in the travel choices people
make everyday. In fact, for the average American household, transportation
costs represent 18 percent of total household expenditures (STPP, 2000).
As such, a wide range of demand-side strategies are oriented around
using financial incentives and targeted pricing systems to encourage
efficient travel choices.
• Tax Incentives
The Federal tax code allows employers to provide tax-free transit, vanpool, and parking benefits to their employees. The employer and employee save on taxes, since neither pays federal income or payroll taxes on these benefits. Called “qualified transportation fringe” benefits in the Internal Revenue Code, Section 132(f), these tax incentives are often referred to as “Commuter Choice tax benefits” or simply “commuter benefits.” For tax year 2004, transit and vanpool expenses up to $100 per month ($1,200 per year) and qualified parking expenses up to $195 per month ($2,340 per year) are tax-free. The monthly tax-free limits are subject to annual adjustments, indexed to inflation (see www.commuterchoice.com for continually up-to-date information). Providing commuter tax benefits to employees can save payroll taxes for employers. Because the value of the benefit paid to employees is considered a tax-free transportation fringe benefit and not wage or salary compensation, the cost of the benefit is eligible as a business expense and payroll taxes do not apply. There are three primary ways employers can structure the benefit:
Employer-Paid Transportation Benefits. Employers can pay for their employees to commute by transit or vanpool, up to a limit of $100/month (subject to annual change). With this arrangement, employees get up to $100 in a tax-free transportation benefit. Employers get a tax deduction for the expense and enjoy savings on payroll-related taxes. Employers have found that providing transportation benefits offers significant savings over offering the equivalent dollar value to employees in the form of a salary increase. Employers can also pay for the cost of parking for employees, up to a limit of $195/month (this limit is subject to annual change).
Employee-Paid, Pre-Tax Transportation Benefits. Employers can allow employees to set aside up to $100/month of pre-tax income to pay for transit or vanpooling (subject to annual change). Employers save money overall since the amount set aside is not subject to payroll taxes. Employees save money, too, since the amount of an employee’s salary set aside for transportation benefits is not subject to income or payroll taxes, up to the specified monthly limits.
Shared-Cost Transportation Benefits. Employers can share the cost of transit or vanpool costs with employees—and everyone can receive valuable tax savings. With this approach, employers can provide a portion of the cost of taking transit or vanpooling as a tax-free benefit and allow the employee to set aside pre-tax income to pay for the remaining amount of the benefit (up to the specified limits).
Q. Are additional tax incentive programs available to employers at the state level?
A. Yes, several states have tax incentive programs to encourage employer participation in providing commuter benefits to their employees. For example, the Maryland Commuter Tax credit provides a 50 percent tax credit, up to $30 per employee per month, for provision of transit passes, vanpool benefits, and reimbursement for carpooling expenses. Other states offering tax incentives to employers include: Georgia, Minnesota, Delaware, Connecticut, Oregon, New Jersey. See the following U.S. EPA document for more information: www.bwc.gov/pdf/fedtax.pdf

FAST FACTS: Although 86 percent of American workers feel that commuter assistance benefits — such as discount transit passes, ride sharing boards, or parking benefits — are beneficial and useful, only 17 percent have access to such assistance through their employers. Eighty-six percent of employees who do not have commuter assistance typically drive alone to work, compared with only 71 percent who do have access to commuter assistance. Surveyed employees who have commuter assistance are almost eight times more likely to use public transportation such as the train, subway or bus than those employees who do not have assistance (15 percent versus 2 percent). (Xylo, 2001)
• Parking Cash-Out
Employers can offer their employees the option to “cash out” of their existing parking space. For example, if Company A subsidizes parking for their employees at $60/month, a parking cash-out program would allow employees to choose from the following options: (1) keep the parking space worth $60/month, (2) give up the parking space and receive $60 extra each month in taxable salary, or (3) receive $60/month in tax-free transportation benefits to pay for transit or vanpooling. Cash-out programs often work best for employers that pay separately for parking and for organizations with parking shortages or demands to expand parking facilities.
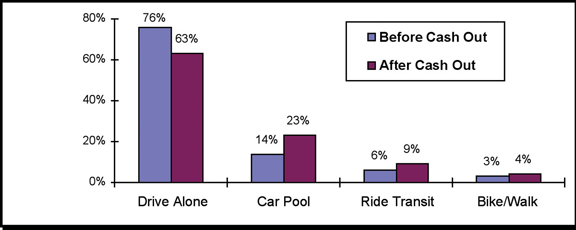
FAST FACTS: A 1997 study of eight parking cash out programs in California found that total vehicle trips declined by 17% after a parking cash out option was introduced at various urban and suburban worksites, as shown in Figure 3 below. (Shoup, 1997)
FIGURE 3: CASHING OUT IMPACTS ON COMMUTE MODE (SHOUP, 1997)
• Parking Pricing
Parking pricing entails charging vehicles directly for use of a parking space, and is among the most powerful demand-side strategies. There is a cost (whether in land value, construction cost, maintenance cost, etc.) for all parking spaces. The question is whether these costs are subsidized by developers, property owners, property managers, or others – or whether, and how, these costs are charged directly, in full or in part, to those using the spaces. Well-crafted parking pricing strategies can impact the use of alternative travel modes, in particular where high-quality transit services are available. Variable parking pricing programs (see below for more detail on variable pricing), where parking prices are higher during more congested hours of the day or along more congested routes, assist in managing demand and encouraged the use of less-congested travel times and travel routes. Within particular parking lots, parking managers can discount certain parking spaces (preferably in priority locations, such as next to a building entrance) for use by those arriving in multi-occupant vehicles.
FAST FACTS: Over 95 percent of commuters park for free at work in the US, and almost all of them drive alone (91 percent of total commuters). For 2002, this yielded an estimated commuter parking subsidy for off-street parking paid by the employer and/or developer of $36 billion. (Shoup, 2003)
• Variable Pricing
Variable pricing changes the price structure of toll roads, bridges, parking lots, and other congested transportation facilities in order to provide incentives for using the facilities in uncongested times or by different modes. On variable priced toll roads, toll rates are structured such that higher prices are assessed based upon time of day concurrent with typical or even actual periods of congestion. Despite the nature of the program, tollway users will experience higher charges during the peak periods and lesser charges during off-peak or shoulder periods. The effect of variable pricing on toll facilities is to: 1) help divert some traffic from the peak period to the shoulders of the peak period, and, 2) provide a cost-based encouragement for the use of transportation options (such as transit and ridesharing). Shifts to either off-peak periods or other transportation options will likely reduce the overall congestion on the facility, and, reduce the need for additional capacity on the toll facilities.
VARIABLE-PRICED TOLLS – LEE COUNTY, FL. Lee County is using variable-priced tolls to mitigate congestion on two county bridges by spreading traffic away from the peak period “rush hour.” In the “shoulders of the peak period” (6:30 – 7:00 am, 9:00 – 11:00 am, 2:00 – 4:00 pm, and 6:30 – 7:00 pm), patrons received a 50% discount on the bridge toll if they utilize the bridge’s electronic toll collection system. According to a 1999 telephone survey, half of respondents indicated they always or sometimes considered the toll discounts prior to making a trip across the bridges. As a result of the program, use of the bridges increased in the off-peak times and decreased during the peak periods. Analysis indicated that the travelers who modified their travel plans were more likely to be retired or working part-time. The survey results indicated that commuters were less likely to modify their schedules as a result of variable pricing, and that the program appears to have a greater impact on shopping trips. (Burris, 2000)
___
FAST FACTS: Over forty-five projects in fifteen states have investigated and, in some cases, begun implementation of pricing programs. In Hudson County, NY, variable pricing on existing toll bridges increased transit usage and reduced peak-period traffic by 7 percent. On the New Jersey Turnpike, up to 15 percent of peak-period traffic was reduced by variable pricing. Variable tolls on the State Route 91 facility has increased three-or-more person carpools. (FHWA, 2004)
• Distance-Based Pricing
Distance-based pricing involves shifting automobile expenses that are often fixed monthly or annual costs, such as automobile insurance or vehicle registration, to expenses that vary according to how much the vehicle is driven. Distance-based pricing strategies are designed to directly tie more types of automobile expenses (i.e., in addition to fuel expenses) to the number of miles driven. Distance-based pricing programs may include (1) pay-as-you-drive automobile insurance, (2) mileage-based vehicle registration fees, and (3) mileage-based vehicle purchase taxes.
DID YOU KNOW? Progressive Insurance became the first insurance company in the United States to offer mileage-based vehicle insurance when it initiated service in Texas in 1999. Not only does Progressive charge per mile, but the company also uses a Global Positioning Satellite (GPS) system to charge motorists more when they drive under higher risk conditions. In 2004, GMAC Insurance and OnStar teamed up to offer mileage-based insurance discounts to OnStar subscribers in four states. Under the new program, vehicle owners with active OnStar accounts may be able to save from 5 to 40 percent on their car insurance, depending upon where they fall within seven mileage categories. (OnStar, 2004)
• Incentive Rewards Programs
Reward-based incentive programs use financial and recognition rewards to encourage travelers to try and to maintain efficient transportation choices. There are a wide variety of ways incentive reward programs are structured: (1) direct cash or gift certificate rewards offered to travelers for efficient travel choices, either on a regular basis or through periodic prize giveaways, (2) points-based systems for use of efficient travel choices, much like airline frequent flier programs, (3) extra time off of work, or similar workplace-based rewards, and (4) recognition of travelers or sponsoring organizations in newspaper ads, award ceremonies, etc. Reward-based incentive programs are sponsored by organizations at many different levels, from single-site employers to federal agencies. For example, the Best Workplaces for CommutersSM program, established by the U.S. Environmental Protection Agency (EPA) and the U.S. Department of Transportation (DOT), publicly recognizes employers whose commuter benefits reach a National Standard of Excellence. EPA and DOT also recognize entities other than employers, such as business parks, downtown districts, or shopping malls, which provide and administer to each of the district’s employees a commuter benefits program that meets the National Standard of Excellence. For more information, visit: www.bwc.gov.
INCENTIVE PROGRAMS – NIKE. Nike, a footwear manufacturer headquartered in suburban Portland, has an extensive commuting program that includes two types of carpooling incentives. First, carpools have reserved parking areas until 10 AM. Second, carpoolers are eligible, along with all other non-single occupant vehicle commuters, for monthly and quarterly prize drawings. Prizes range from gift certificates in increments of $25, $50, of $100 for company store or local retailers to $400 for mountain bike purchase or “getaway” weekends. Nike’s SOV rate in 1992 was 98%. Since moving WHQ and implementing the Nike Buck and TRAC programs, Nike’s SOV rate has reduced to 78%. 10% of employees carpool, 2% bike, 5% use bus and rail and 5% use flextime.
___
Travel Time Incentives
Increases in congestion levels around the country are creating longer
and longer travel times. The average driver in the country’s 75
largest cities experienced about 26 hours of travel delay due to congested
driving conditions in 2001. In addition to an overall increase in average
travel times, travel time “reliability” has also decreased,
with crashes, vehicle breakdowns, weather, special events, construction
and maintenance accounting for about 50 percent of all delay on the
roads in 2001 (TTI, 2003). As such, a variety of demand-side strategies
are oriented around providing travel time incentives to encourage efficient
travel choices. These demand-side travel time incentives address both
overall travel time savings and improved travel time reliability.
• High-Occupancy Vehicle (HOV) Lanes
HOV lanes are exclusive roadways or lanes designated for high-occupancy vehicles, such as buses, vanpools, and carpools. The facilities may operate as HOV lanes full time or only during the peak periods. HOV lanes typically require minimum vehicle occupancy of two or more persons. However, in some locations, occupancy requirements have been increased to prevent congestion on the HOV lane. Support facilities, such as park and ride lots and transit centers with direct access to the HOV lane, are important system elements to increase facility use. HOV lanes may also be used to provide bypass lanes on entrance ramps with ramp meter signals. Keys to the success of lanes include location (areas of high congestion do better); enforcement; interagency coordination; synergy with parking policy, trip reduction ordinances, and transit and ridesharing programs; public and policy-maker support; and education and marketing. A related concept, high-occupancy toll lanes, or HOT lanes, allow single-occupant vehicles to utilize HOV lanes for a fee. HOT lanes can expand the range of travel choices available to all users and even help articulate the perceived “value” of HOV lanes to transit, vanpool, or carpool travelers able to use the same lanes at free or reduced rates. Revenues generated through fees paid by single-occupant vehicles on HOT lanes can also bolster on-going funding for transit and ridesharing services along a HOT/HOV route.
FAST FACTS: There are more than 2,500 lane-miles of HOV facilities in the U.S. and Canada. This is expected to double within the next 25 years. One of the first HOV lanes, the I-10 HOV lane in southern California, known as the “El Monte Busway”, was opened in 1973 as a dedicated busway and later opened to carpools of three or more people. In 2002, the single El Monte HOV lane carried more people than three regular general purpose lanes during peak periods, and, saved users an average of 20 minutes over the eleven mile distance. On average in southern California, HOV lane users saved more than half a minute per mile compared to the general purpose lanes. (CA DOT - District 7, 2003)
BUS SIGNAL PRIORITY SYSTEMS – INTERNATIONAL EXPERIENCE. “Transit signal priority (TSP) installations in England and France have shown a 6 to 42% reduction in transit travel time, with only 0.3 to 2.5% increases in auto travel time. In North America, Toronto, Edmonton, Charlotte, Portland, Chicago, and Los Angeles, among others, have installations in place. In Toronto, for example, average transit signal delay reductions of between 15 and 49% using TSP has justified expansion to over 300 signalized intersections (15% of total) along four bus and five streetcar routes, all in mixed traffic. Other TSP deployments include a 2-mile stretch in Cicero, IL on Cermak Road that is the site of an Illinois Department of Transportation demonstration using wire loops at 10 signalized intersections. Chicago Transit Authority and suburban PACE buses, using transponders and absolute TSP, realized an 8-minute trip time versus 12 minutes before TSP (a 33% reduction). In Los Angeles, two projects demonstrated application of TSP in conjunction with service restructuring (Metro Rapid) at approximately 100 signals along of each corridor (14-16 miles). Results indicated an average 8% decrease in overall bus running time, and a 35% reduction in bus delay at signalized intersections.” (ITS America, 2002)
___
• Transit / HOV Signal Priority Systems & Queue Jumps
Queues at either arterial intersections and/or ramp meters (signals that manage access to freeways from arterials) can significantly lengthen travel times for all travelers. When compounded with the need to make stops, signal delays often result in unacceptably long travel times for potential bus riders, carpools, and vanpools. Many metropolitan areas have implemented signal priority systems and queue jumps as one means of addressing signal delay for multi-occupancy vehicles, providing a significant improvement to travel time and/or travel time reliability for transit users, vanpoolers, or carpoolers. These demand-side strategies provide a travel time incentive for the use of high-occupancy travel modes – or the use of underutilized travel routes/times.
FAST FACTS: The Minnesota Department of Transportation conducted a study to evaluate the effectiveness of its extensive ramp metering system, including shutting the system down. The study showed that ramp metering decreased total travel time by 24% in heavy congestion and 46% in typical traffic. Without HOV bypass lanes, ramp metering imposes a delay on buses and carpools. With HOV bypass lanes, overall travel time delay can be reduced by up to 62% in heavy congestion due to 1) reduction of freeway traffic due to ramp metering, and, 2) no travel time delay on the ramps. (MN DOT, 2002)• Preferential Parking
This strategy reserves priority parking spaces within a parking lot for those arriving by carpool or vanpool, or even those arriving during less-congested times of the day. “Preferred” parking could include (1) covered parking that protects people and cars from the weather, (2) an assigned parking space near the building entrance, (3) a level-one spot in a multistory parking garage, or (4) priority position on a parking space waiting list. Although designating preferred parking areas is most effective where parking demand meets or exceeds supply, many travelers with abundant parking still enjoy parking closer to the building or in a designated parking space.FAST FACTS: The City of Aspen, Colorado, provides a variety of demand-side transportation strategies to preserve the physical environment and to control future traffic impacts on the community. In order to encourage carpooling, vehicles with more than three people entering the downtown area can stop at a kiosk and receive a Carpool Parking Permit that allows that vehicle to park in a designated area free of charge all day. In 2001, approximately 16,000 daily permits were issued. Coupled with the high-occupancy vehicle lanes, the distribution of these permits is one of the most successful incentives to rideshare.
Marketing & Education
A critical element of successful demand-side strategies is often a well-designed
and executed marketing and education program. Even in communities where
high-quality transportation mode, route and time choices are currently
available, travelers who remain unaware that these choices exist, or
unconvinced that these choices are viable and/or reliable, even modest
shifts in travel behavior and transportation efficiency are unlikely.
Transportation marketing programs, at their most basic level, are designed
to do one of three things: (1) increase awareness of available transportation
choices, (2) encourage travelers to try new, more efficient travel choices
for the first time, or (3) increase or maintain the frequency that people
utilize more efficient travel modes, routes or times. Educational programs
are designed to make travelers more aware of available transportation
choices, and more aware of the specific facts related to travel choices
– such as travel costs for different travel modes, travel times
at different departure times, etc. Several specific strategies are emerging
at the forefront of demand-side marketing and education strategies:
• Social Marketing
Social marketing campaigns are increasingly being used by organizations around the country to encourage voluntary, socially-beneficial behavior change. “Social marketing is the use of marketing principles and techniques to influence a target audience to voluntarily accept, reject, modify, or abandon a behavior for the benefit of individuals, groups, or society as a whole” (Kotler, 2002). Using techniques similar to marketing commercial goods and services, various organizations have used social marketing techniques to encourage environmentally-friendly landscaping techniques, increase the use of seat belts and child safety seats, promote safe bicycling and the use of bike helmets, and champion enhanced exercise and physical activity. Similar approaches are increasingly being used to encourage voluntary changes in travel behavior, from reducing the number of trips made by single-occupant automobile to encouraging travel at off-peak travel times.
FAST FACTS: In 1993, North Carolina launched the “Click It or Ticket” campaign to increase seat belt use throughout the state. A social marketing campaign touted the benefits of seat belt use in conjunction with communicating a $25 fine for violations (fine revenues went to local schools). Before the campaign, only 65% of North Carolinians used seat belts. By 2000, seat belt use had jumped to 84%, among the highest rates in the nation. Highway fatalities and injuries were cut by 14%, and statewide, auto insurance rates fell. The U.S. Department of Transportation called the campaign a “model for the nation,” and it has since been replicated by states across the country. (Kotler, 2002)• Individualized Marketing
Individualized marketing – sometimes referred to as dialogue marketing – focuses marketing efforts and financial resources on a targeted group of individuals or households, working on a one-to-one level to provide tailored information about available transportation choices and small incentives to encourage individuals to try new options. In April 2004, the Federal Transit Administration (FTA) selected four communities for a pilot individualized transit marketing project: Bellingham, WA; Cleveland, OH; Sacramento, CA; Triangle Park, NC. “The FTA’s pilot project is based on personalized, individual marketing of potential commuters who might consider using public transit, but need more information. Transit agencies in the pilot communities first identify a neighborhood (approximately 600 households) with existing transit service and those residents are contacted in writing to determine if they are interested in learning more about travel options. Interested residents are then contacted by phone to determine if they would like information on transit, bicycling or walking. The outreach continues until residents have enough information to ensure their comfort level with trying different modes of transportation. In a few cases, bus operators make ‘home visits’ to personally discuss public transportation routes and options with residents.” (FTA, 2004)
FAST FACTS: A UITP (International Public Transportation Association) project conducted in Europe, as well as larger scale individualized marketing programs in Australia, resulted in significant increases in transit ridership. The pilot project in Europe resulted in a 10 percent reduction in car usage in the targeted area, while the large-scale individualized marketing efforts in Australia yielded up to 14 percent reductions. The first U.S. pilot project in Portland, Oregon, reduced car travel by 8 percent in the first area selected for the pilot, and resulted in a 27 percent increase in travel by carpool, vanpool, transit, bicycling and walking in that same area. (FTA, 2004; Australian TravelSmart, www.dpi.wa.gov.au/travelsmart/)
Targeted Strategies
Often complementing the more broad-based, general demand-side strategies,
an array of demand-side strategies are targeted to specific traveler
choices – such as choices regarding travel mode or trip departure
time. These targeted strategies are described in detail in the section
below, and are organized around the five primary categories of choices
that affect overall transportation demand.
• Mode Strategies
• Route Strategies
• Departure-Time Strategies
• Trip-Reduction Strategies
• Location / Design Strategies
Mode Strategies
The following demand-side strategies specifically target the choices
of travel mode, from driving alone to bicycling to using transit:
• Guaranteed Ride Home
Guaranteed Ride Home (GRH) programs, sometimes called emergency ride home programs, provide those who do not drive into work, or other supported destination, with a free ride home in cases of emergencies, unplanned overtime, or other unexpected issues. Rides are often provided by taxi, but GRH can also be supported through rental cars, company fleet vehicles, or other alternatives. Often sponsored by local/regional governments, or by employers, GRH programs provide a back-up travel option to prevent travelers using alternative travel modes from being stranded at their destination.FAST FACTS: In a 2003, survey the Artery Business Committee Transportation Management Association in Boston found that seven percent of commuters who used to drive alone switched to transit once they found out that there was a GRH service available. Metropolitan Washington’s Council of Governments (MWCOG) GRH program is listed as a transportation control measure in the area’s state implementation plan (SIP). MWCOG estimates that by 2005, its GRH program will eliminate 0.76 tons per day of NOX, at a cost of $8,800 per ton of NOX reduced. (Todreas, 2004)
• Transit Pass Programs
Transit pass programs provide subsidized or free passes to travelers for the use on community transit and/or regional rail, bus, ferry or shuttle transit services. Free transit passes provide an incentive for “first time” users to try using transit and simplify the fare payment process.
FAST FACTS: When employees in downtown Ann Arbor, Michigan were provided a discounted or free transit pass (depending on the level of employer involvement), the estimated effect was a 9.2% increase in daily bus trips and a 3.5% daily decrease in the number of private vehicles coming into downtown between 2000 and 2001. (White, 2002)
• Shared Vehicles
Shared vehicles provide a flexible option to travelers who rely primarily on non-motorized and public transit travel, yet at times require a vehicle for special trips, such as grocery shopping or trips to rural areas, or to get from the transit station to their final destination. Shared vehicle concepts include:
• Car Sharing: Member based programs offer 24 hour access to a fleet of vehicles (cars, vans, trucks) within a city or neighborhood. Vehicles are reserved and used for just a few hours or up to a week. Most programs offer vehicles at an hourly and mileage based rate, with prices including gas, insurance, parking and maintenance. Several vehicles are generally located at convenient locations throughout the city.
• Station Cars: Similar to the car sharing concept; small, low emission vehicles are available at transit stations, helping people get from the train to their final destination, used daily for the commute or on an as needed basis.
FAST FACTS: According to researchers at the University of California at Berkeley tracking City CarShare, a San Francisco Bay area car-sharing organization, 30 percent of users have sold one or more of their privately owned vehicles and City CarShare is saving 13,000 miles of vehicle travel, 720 gallons of gasoline, and 20,000 pounds of carbon dioxide emissions in the Bay area. (City CarShare, 2004)
Departure-Time Strategies
The following demand-side strategies specifically target trip departure-time
choices:
• Worksite Flextime
Worksite flextime allows employees to set their own arrival and departure time to/from work – within established time boundaries agreed to by their employer. This strategy can influence travel in several ways. In congested areas, it may encourage employees to avoid the most congested travel times, reducing the demand on roadway and/or transit systems during peak-demand periods. Furthermore, flextime programs often provide employees with the schedule flexibility sometimes needed to coordinate carpools and vanpools.
FAST FACTS: From a Federal Transit Administration report on the potential impacts of flextime programs on peak-period traffic demand: “At Bishop Ranch in California, flextime policies [were] successful in shifting employee arrival times to earlier periods. A survey of 14,800 employees between 1988 and 1990 showed the percent of employees starting work before 7:00 a.m. increased from eight to 17 percent, and the percent starting work after 9:00 a.m. increased from one to 9 percent. Departure peaking also has been reduced. The percentage of workers leaving before 4:00 p.m. increased from 12 to 17 percent. The employer flextime programs were instituted as part of a broad demand management program for the area, as well as a local trip reduction ordinance encouraging reduction of peak hour vehicle trips.” (FTA, 1992)
• Coordinated Event or Shift Scheduling
Scheduling the coordination and staggering of traffic to reduce the number of vehicles arriving and leaving a site at one time. This can apply to event venues, specific worksites or office parks with severe traffic congestion.
FAST FACTS: Near downtown Milwaukee, Summerfest, an annual, eleven-day outdoor music festival, attracts approximately 100,000 patrons per day and over 1 million annually. Since parking on-site is limited near the venue, alternative means of providing transportation and informing festival visitors with traffic, alternative route and parking information were essential. Local ridership data for Year 2000 showed that approximately 25% of the total attendance used bus transportation.
Route Strategies
Travelers making day-to-day decisions regarding available travel routes
generally use a combination of information resources to determine the
quickest, or most reliable, route option. Many commuters listen to television
and radio reports of traffic conditions. Others explore real-time, web-based
travel-speed maps. Some simply pursue alternate routes when their normal
route is unusually congested. The role of demand-side route strategies
is to get the most accurate, timely information on travel conditions
to people before they end up on congested facilities – allowing
them to select less-congested routes and avoid “adding to the
problem” by using already congested routes. Demand-side route
strategies can apply to roadway, transit and other travel route alternatives.
• Real-Time Travel Route Information
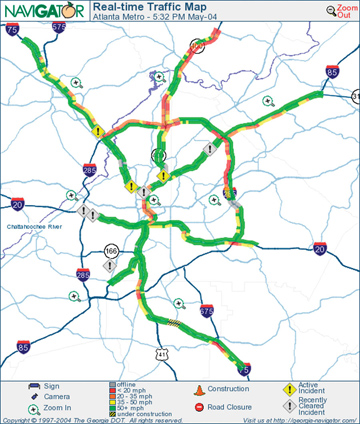
More and more areas around the country are launching real-time travel route information resources for area travelers. Using web-based maps, en route variable message signs, wireless updates to mobile devices, and other communications mediums – travelers are better able to make the most efficient route choice, and better able to make that choice before they end on a congested roadway or transit facility. Real-time, web-based traffic maps, like the Georgia Navigator system shown in Figure 4, often use a color-coded system to display travel speeds, warning indicators to show current incident locations, and hotlinks to connect users to live camera images of existing traffic conditions (where available). Organizations implementing comprehensive demand-side strategies are working with employers, property developers and managers, and others to integrate these real-time tools into corporate intranets, lobby kiosks, and others medium – in order to ensure that people can access this information conveniently.
FIGURE 4: GEORGIA NAVIGATOR REAL-TIME TRAFFIC MAP. www.georgia-navigator.com
DID YOU KNOW? The Utah Department of Transportation’s CommuterLink, a real-time, web-based traveler information system that was operational for the 2002 Salt Lake Winter Olympics, is based on the Georgia Department of Transportation’s Navigator system – which was used during the 1996 Summer Olympic Games.
• In-Vehicle Navigation Systems
In-vehicle navigation systems are currently available in a variety of automobiles currently on the market for sale, lease and rent. These systems generally provide drivers with route guidance, vehicle position, and regional points of interest information. Historically, in-vehicle systems have relied on static data about travel times for each road segment to calculate the shortest travel time from where the vehicle is located to a point the driver inputs as the destination. As the collection and dissemination of real-time travel information – and the availability and affordability of regional broadband wireless networks – both improve, in-vehicle navigation systems will be able to provide drivers of private automobiles and transit vehicles real-time route guidance. Such guidance will encourage travelers to take advantage of underutilized travel routes and avoid non-recurring congestion caused by incidents and other emergencies.
FAST FACTS: Telecommunications companies are launching region-wide, broadband wireless services in cities around the country. The expansion of region-wide broadband wireless will expand the capacity to deliver real-time traffic data and other information to vehicles moving throughout a region. Telecommunications companies initiated service in Washington, DC, and San Diego, CA, in 2003. Service will expand to other major metropolitan areas throughout 2004 and 2005. (Baig, 2004)• Web-Based Route-Planning Tools
A variety of companies provide web-based travel route planning tools for roadway trips, and an increasing number of transit agencies are offering similar services for transit riders. These tools allow users to enter trip start and end locations (along with desired departure times or en route services, in some instances), and process recommended travel routes and forecast travel times. As these tools evolve, multi-modal travel route planning and the capacity for using real-time travel information to suggest less-congested alternate routes or modes is likely to emerge.
Trip Reduction Strategies
The following demand-side strategies are designed to reduce the need
for some trips altogether:
• Employer Telework Programs & Policies
Employers establish telework programs and policies at the worksite in a wide variety of ways – from structured, formally-implemented telework programs and policies to more informal telework arrangements established between individual employees and their direct supervisors. In many areas, transportation organizations – from metropolitan planning organizations to transportation management associations – have well-established telework support programs to assist employers in setting up appropriate telework systems and policies.FAST FACTS: In a 2001-2002 employee survey, AT&T found that “AT&T teleworkers again reported that they gain about an extra hour of productive time each day at home, adding up to at least an estimated $65M in business benefit each year... Teleworkers appear to get more accomplished not only because of time saved by not commuting - that is, increased productivity on a per teleworker or per workday basis - but also because of increased productivity per unit hour. The ability to focus and manage time is critical for knowledge workers, and little distractions in the office add up to big costs in productive time.” (Roitz, 2002)
• Employer Compressed Work Week Programs & Policies
Employers in a variety of setting establish compressed work week programs, offering employees the option to work the same number of work hours in fewer days per week, or per pay period. Development of compressed work week programs and policies involves a variety of partners, including company management and human resources staff, employee labor unions, and regional transportation organizations.
FAST FACTS: A 1991 study of compressed work week programs in Ventura County, CA, reports that the program was associated with a decline in single-occupant vehicle trips to work, from 82 percent to 77 percent. (Freas, 1991)
Location / Design Strategies
The location of land uses in a community – from homes, to businesses,
to retail establishments –directly impacts transportation demand.
Over time, as cities evolve, changes in land use development patterns
lead to changes in trip-making patterns. In some areas, urban growth
has led to increases in trip lengths and growth in the average number
of vehicle trips per day. In other areas, a variety of land use location
and design strategies have led to reductions in trip lengths and vehicle
trip generation – contributing to congestion mitigation advances
(R.H. Pratt Consultant, 2003). Communities, businesses, and individuals
make land use location and design decisions based on a wide range of
economic, social, environmental, and other factors. Transportation accessibility
is also a factor in many of these decisions, and a variety of location/design
demand-side strategies are available. Several specific programs are
described below. A more extensive discussion of the impacts of land
use and site design strategies on travel patterns is available from
the Transportation Research Board: Traveler Response to Transportation
System Changes: Chapter 15 Land Use and Site Design (R.H. Pratt Consultant,
2003).
• Live Near Transit Mortgage Incentives
Live near transit programs offer mortgage incentives to encourage residential location near transit facilities. The programs recognize that household transportation expenses can be lower for residences well served by public transportation, and allow homebuyers to use these transportation savings as additional borrower income in qualifying for a home mortgage. For example, Fannie Mae sponsors the Smart Commute InitiativeTM in pilot cities across the country. In several of the pilot cities, the Smart Commute Initiative involves partnerships with regional planning organizations, transit agencies, and private companies to provide complementary services supporting the use of public transportation (i.e., discounted transit passes, shared-car membership programs, etc.). Fannie Mae also supports the Location Efficient Mortgage® program in four pilot cities nationally.
WASHINGTON REGIONAL SMART COMMUTE INITIATIVE. In Washington, DC, the Smart Commute Initiative offers mortgage incentives to households locating within one-quarter mile of a public bus stop or one-half mile of a public rail station. Through the program, participating lenders will add a portion of the potential transportation savings to borrowers’ qualifying income - an addition of $200 per month for one wage-earner households and $250 per month for two wage-earner households (a potential increase in home-buying power for a typical purchaser of a median-priced home of approximately $10,000). Participants also receive discounts on transit passes and lifetime membership in the Flexcar shared-car program. (www.mwcog.org/planning/smart_commute/index.html)
___
• Live Near Work Incentive Programs
Live near work programs provide incentives for employees to live near their place of employment. Examples include down payment assistance, location efficient mortgages and rent subsidies. By providing housing close to employment, this program can lower the costs of commuting, lessen the pressure on infrastructure, and generate more pedestrian traffic in business districts.DID YOU KNOW? In 1997 Maryland’s General Assembly adopted a series of growth management programs, one of which was the Live Near Your Work Program. The City of Baltimore pioneered the program and continues to partner with area “Live Near Your Work Employers” to provide $2,000 cash grants to home buyers for down payment and/or settlement expenses. (www.livebaltimore.com/homebuy/lnyw.html)
• Proximate Commute
This program involves voluntary, coordinated relocation of eligible employees who work for multi-site employers to the work branch locations closest to their home, reducing commute distances. Rather than having employees commute to distant locations, their employers help them arrange job swaps and transfers to company sites closer to home. In the mid-1990s, the Washington State Department of Transportation worked with Key Bank on a proximate commute demonstration project. A total of 500 Key Bank employees – from 30 individual branches in three counties – were found to be eligible for the program. An initial review found that 83% of the employees lived closer to an average of 10 different branches than the branch where they were presently employed. 85 of the 500 employees enrolled in the program. The result was a 65% reduction in miles traveled. (Giery, 2003)
FAST FACTS: In 2002, Boeing undertook a pilot project to itemize the jobs and home addresses of 10,000 of its non-union workers to determine if some could transfer to a plant closer to home. Preliminary research showed that 53 percent, or 42,475, of its workers share a job description with a plant that is closer to their residence. Boeing found that if those employees could be moved, it would reduce commute-related travel by 168 million miles annually, equating to 8 million gallons of gas and 5,000 tons of emissions each year. (Seattle Post-Intelligencer, 2002)
• Transit-Oriented & Pedestrian-Oriented Design, Mixed-Use
A wide range of urban form and design strategies can enhance opportunities for the use of public transit, ridesharing, bicycling, and walking. Focusing a mix of land uses – such as employment, housing, restaurants, services (banking, day care, etc.), retail, and more – in well-designed, pedestrian-friendly developments and/or near transit connections can reduce the demand for vehicle travel and reduce trip distances. A 2002 study in California demonstrated that transit-oriented developments (TODs) can yield 20 to 40 percent higher ridership at an individual transit station for both work and non-work trips, and can increase overall regional transit ridership by up to 5 percent. (Parsons Brinckerhoff).
FAST FACTS: An assessment of the impact of different degrees of land use mix on travel patterns in 57 suburban activity centers found that centers with some on-site housing had 3 to 5% more transit, bike and walk commute trips. Additionally, for each additional 10% of commercial/retail floor space in the activity center, transit and ridesharing increased by 3%.