
Managing Travel for Planned Special Events
Chapter Five. Event Operations
Planning
Page 3 of 4
Feasibility Study 
Overview
The structure and approach of a planned special event feasibility study resembles a Traffic Impact Study required for planned developments, as illustrated in Figure 5-5. The figure shows the sequential steps in preparing a feasibility study for a planned special event.
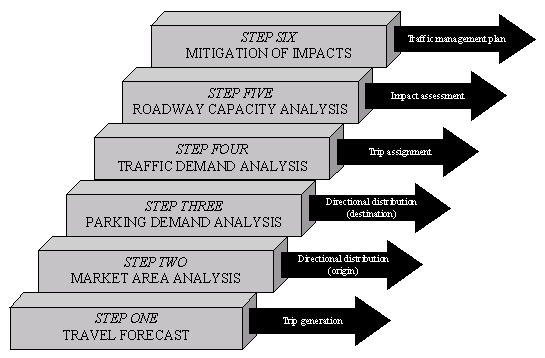
Figure 5-5. Feasibility Study Analysis Steps
Table 5-10 provides an overview of the first five feasibility study components. The accuracy of one analysis influences that of another. Achieving predictability, a goal of managing travel for planned special events, represents the focus of a feasibility study effort.
| Component | Analysis | Result | Application |
|---|---|---|---|
| Travel forecast |
|
|
|
| Travel forecast |
|
|
|
| Travel forecast |
|
|
|
| Market area analysis |
|
|
|
| Parking demand analysis |
|
|
|
| Parking demand analysis |
|
|
|
| Traffic demand analysis |
|
|
|
| Traffic demand analysis |
|
|
|
| Roadway capacity analysis |
|
|
|
| Roadway capacity analysis |
|
|
|
The feasibility study gauges the impact a proposed event has on traffic and parking operations in the vicinity of the venue. It determines if a particular planned special event will cause travel problems, where and when the problems will occur, and the magnitude of each identified problem using various MOEs. Initially, the study is conducted without roadway capacity improvements or initiatives to reduce travel demand. Once the feasibility study identifies event travel problems, practitioners can take steps to mitigate transportation system deficiencies. These results define the scope of the traffic management plan required to successfully manage travel for a planned special event.
Data Requirements
Feasibility study input data requirements reflect measures of the three core factors that determine the impact of the event: travel demand, road/site capacity, and event operation. Table 5-11 summarizes various types of input data to consider in a feasibility study. This includes transportation system infrastructure, background traffic, and area data and information. With the assistance of other event planning team stakeholders most data types are accessible.
| Factor | Input Data | Description |
|---|---|---|
| Travel Demand |
|
|
| Travel Demand |
|
|
| Travel Demand |
|
|
| Travel Demand |
|
|
| Road/Site Capacity |
|
|
| Road/Site Capacity |
|
|
| Road/Site Capacity |
|
|
| Event Operation |
|
|
| Event Operation |
|
|
| Event Operation |
|
|
Travel demand data is used to develop the event travel forecast and to determine the event area of impact. Background traffic data describes the scope of available roadway and parking capacity for event patron traffic. Information regarding the venue area assists in identifying possible event patron trip origins. For example, a venue located in a downtown area may attract a significant number of patrons arriving from work, thus possibly reducing the number of transit or vehicular trips generated. Events having a regional or greater scope may involve a significant number of patrons staying at area hotels. To increase travel forecast accuracy and meet the goal of achieving predictability, practitioners should research appropriate historical data.
The identification and quantification of site and transportation system capacity involves performing a full inventory of the transportation system infrastructure serving the event venue. This includes obtaining data on roadway geometrics and associated regulations (e.g., speed limits and travel restrictions). An inventory of freeway facilities should include the capacity of such freeway components as ramp junctions and weaving sections. In addition, street traffic control devices and signal timing plans must be identified and saturation flow rates determined.
Event operation characteristics impact both travel demand and available capacity. The knowledge of certain event logistics, combined with available historical data, can help predict the rate of event patron arrivals and departures over time. Practitioners, in tandem with the event organizer, must also identify the scope of road closures and parking area needed just to stage the event (e.g., parade/race route, hospitality areas, etc.). This does not include the roadway capacity and parking needed to accommodate event patron traffic.
Travel Forecast
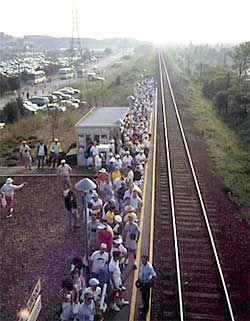
Figure 5-6. Commuter Rail Modal Split
Travel forecast analysis involves estimating: (1) modal split, (2) event traffic generation, and (3) traffic arrival rate. Event planning team stakeholders that typically collaborate on this analysis include a traffic operations agency, traffic engineering consultant, transit agency, and event organizer. The event organizer supplies key input data regarding event operation. The transit agency assists in estimating modal split. The traffic operations agency or traffic engineering consultant performs the analysis, and either stakeholder may research historical traffic and parking data or maintain a data archive related to operations for similar planned special events.
Modal Split
Under the scope of a feasibility study, modal split concerns identifying the existing modes of travel event patrons will use to access the event venue site. Common travel modes include personal automobile, public transit, and walking. Public transit refers to scheduled bus transit or commuter rail. Transit agencies may assist in determining a base transit split, without service incentives or promotion, for patrons traveling to/from the event.
Illustrated in Figure 5-6, some patrons of the 1986 and 1995 U.S. Golf Open in rural Southampton, NY found the Long Island Rail Road commuter rail service an efficient and convenient mode of travel to/from Shinnecock Hills Country Club. To assure consideration of appropriate roadway mitigation, transportation operations planners analyzed a range of modal split percentages in the feasibility study to account for various scenarios. Commuter rail or other people mover systems exist in several metropolitan areas across the Nation and usually provide regular service to city stadium and arena venues. Transit availability includes scheduled express and charter bus service operating from other cities, suburban park and ride lots, and city neighborhoods.
Table 5-12 lists surveyed modal splits for discrete/recurring events at a permanent venue in San Francisco, New York, and San Diego. The baseball stadium venues in San Francisco and New York, located within a metropolitan area, have excellent scheduled transit service, including commuter rail. Stadiums located in suburban areas, such as Qualcomm Stadium in San Diego, and rural areas generally have a high percentage of automobile trips.
| Event | Attendance | Auto | Transit | Walking | Other |
|---|---|---|---|---|---|
| San Francisco Giants weekday baseball game – August 2000(14) | 38,000 – 41,000 (capacity 41,000) |
48% | 41% | 8% | 3% |
| San Francisco Giants weeknight baseball game – August 2000(14) | 38,000 – 41,000 (capacity 41,000) |
50% | 37% | 7% | 6% |
| San Francisco Giants weekend baseball game – August 2000(14) | 38,000 – 41,000 (capacity 41,000) |
58% | 34% | 5% | 4% |
| New York Mets weeknight baseball game – June 1997(15) | 18,000 (capacity 56,500) |
59% | 41% | ||
| San Diego Padres weekday baseball game – April/May 1998(16) | Unknown | 85% | 12% | 3% | |
| San Diego Padres weeknight baseball game – April/May 1998(16) | Unknown | 95% | 5% | ||
| San Diego Padres weekend evening baseball game – April/May 1998 (16) | Unknown | 85% | 12% | 3% |
Travel time, travel convenience, parking accessibility and cost weighs significantly on an event patron's decision to drive or utilize an alternate mode of travel. This likely represents another contributor to the high transit split in the San Francisco example, where Pacific Bell Park resides adjacent to the downtown area. Other modes of travel include bicycle and taxi.
Walking trips deserve consideration in modal split estimates for planned special events occurring at downtown venues. Practitioners must consider the proximity of employment centers, residential developments, and hotels to a planned special event venue before dismissing walking as a viable travel mode. Venues located on university campuses typically draw a measurable percentage of walking trips. Surveys for college football games have reported as many as 10 to 25 percent of event patrons arriving by foot.(17)
Practitioners can best obtain measured data on planned special event modal split through conducting a survey of event patrons. Appendix D contains an Internet-based event patron evaluation survey for those attending the 2003 Fair Saint Louis festival. In addition to querying event patrons on mode of travel, obtaining origin location information (e.g., zip code) assists event planning team stakeholders configure transit schedules or express and charter bus services for future similar events.
Event Traffic Generation
Unlike other traffic generators such as commercial developments, planned special event practitioners typically have advance knowledge of event attendance and, in turn, can develop traffic generation estimates via vehicle occupancy factors. On the other hand, traffic generation rates, based on event traffic volume or parking occupancy data, may not be appropriate for transfer and application from one special event to another. Too many variables exist with regard to event category, event logistics, event popularity, weather, and parking characteristics. Event operations and other external variables affect any application of historical data to future events.
Table 5-13 outlines a two-step process for forecasting event traffic generation. Input data includes a modal split estimate since the traffic generation forecast aims to estimate the number of event-generated trips by personal automobile. In the absence of a daily attendance estimate, practitioners can use percentage of venue capacity as a base. However, many continuous events or street use events do not have a pre-specified venue capacity. Continuous events, such as fairs and festivals, often run for two or more days. Attendance generally fluctuates greatly from day to day, with Saturday operations yielding the highest daily attendance. A study of two-day (Saturday/Sunday) festivals in West Virginia indicated 58 percent of the total festival attendance was on Saturday.(18) The same study noted the following total event attendance distribution for three-day festivals: 20 percent on Friday, 50 percent on Saturday, and 30 percent on Sunday. It should be recognized that daily attendance reflects scheduled headline entertainment or other main festival events.
| Component | Detail |
|---|---|
| Input Data |
|
| Method | Step 1. (Daily Attendance) x (Percent Automobile Trips) = Person Trips Via Automobile Step 2. (Person Trips) / (Vehicle Occupancy Factor) = Vehicle Trips |
| Result |
|
Vehicle occupancy factors can serve as the basis for estimating event-generated traffic. Table 5-14 lists average vehicle occupancy factors for select discrete/recurring events at a permanent venue and continuous events. A discrete/recurring event at a permanent venue that occurs on the weekend will likely have a higher vehicle occupancy factor due to families and groups of tailgaters. A vehicle occupancy factor of 2.5 persons per vehicle represents a common assumption, however for forecasting purposes, practitioners should consider a range of factors from 2.2 to 2.8 depending on local conditions.(15)
| Event | Attendance | Average Vehicle Occupancy |
|---|---|---|
| San Francisco Giants baseball games – August 2000 (14) | 38,000 – 41,000 (capacity 41,000) | 2.8 persons per automobile |
| Anaheim Angels weeknight baseball game – July 1997(15) | 18,197 (capacity 37,000) | 2.6 persons per automobile |
| Cleveland Indians Saturday baseball game – July 1997(15) | 43,070 (capacity 43,368) | 2.64 persons per automobile |
| New York Mets weeknight baseball game – June 1997 (15) | 18,000 (capacity 56,500) | 2.31 persons per automobile |
| San Diego Padres weekday baseball game – April/May 1998(16) | Unknown | 2.3 persons per automobile |
| San Diego Padres weeknight baseball game – April/May 1998(16) | Unknown | 2.5 persons per automobile |
| San Diego Padres weekend evening baseball game – April/May 1998(16) | Unknown | 3.0–3.1 persons per automobile |
| Denver Broncos football games – 1998/2001(19) | 76,000 | 3.0 persons per automobile on-site; 2.3 persons per automobile off-site |
| Event | Attendance | Average Vehicle Occupancy |
|---|---|---|
| 1997 Stonewall Jackson Heritage Arts & Crafts Jubilee – West Virginia(18) | 45,000 to 50,000 (four-day total) | 2.46 persons per automobile |
| 1997 West Virginia Honey Festival(18) | 6,000 (two-day total) | 2.15 persons per automobile |
| 1997 West Virginia Wine & Jazz Festival(18) | 3,500 (two-day total) | 2.42 persons per automobile |
| 22nd Mountain Heritage Arts & Crafts Festival – West Virginia(18) | 25,000 (three-day total) | 2.30 persons per automobile |
Traffic Arrival and Departure Rate
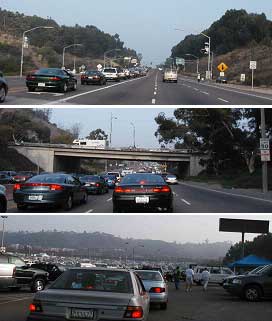
Figure 5-7. Event Patron Departure from a Discrete/Recurring Event at a Permanent Venue
In order to estimate peak traffic volumes generated by an event, practitioners must estimate the time and scope of peak traffic flow during event ingress and egress. Traffic arrival and departure rate indicates the peak period (e.g., hour or 15 minute) of event-generated traffic. The rate is used to determine the following key parameters for input into the traffic demand analysis: (1) peak period time and (2) percent of total event-generated traffic within the peak period. Event operation characteristics that influence traffic arrival and departure rates include:
- Event time and duration – e.g., specific start time, abrupt end time, continuous operation.
- Event time of occurrence – e.g., day/night, weekday/weekend.
- Audience accommodation – e.g., reserved seating, general admission.
- Event type – e.g., sports/concert, fair/festival, parade/race.
This section focuses on estimating the traffic arrival rate. The temporal share of event patron arrivals vary considerably by event type and requires prediction by practitioners. Traffic arriving to an event can potentially cause greater impacts to background traffic mobility than event departure traffic. This is attributed to arrival traffic typically traveling from high-capacity roadway facilities (e.g., freeways and arterials) to low-capacity facilities (e.g., venue access roads). Roadway congestion that occurs during event ingress may create queue spillbacks to freeways and major streets, thus impacting background traffic.
Drivers departing an event venue site generally have little or no choice of exit routes. Roadway capacity constraints include freeway entrance ramps and turning movements to arterials and other major collector roadways. Departing traffic queues are usually constrained to the venue access roadway and spillback into the parking areas. Figure 5-7 shows traffic operations, following a football game at Qualcomm Stadium in San Diego, CA, at: (1) a freeway entrance ramp, (2) a venue access road upstream of a freeway, and (3) an on-site venue parking area.
Table 5-15 indicates traffic arrival rates and time of peak arrival for select discrete/recurring events at a permanent venue and continuous events. Time of arrival depends on audience accommodation (e.g., general admission or reserved seating) and/or the nature of pre-event activities. Such activities include tailgating or practices. Figure 5-8 illustrates NASCAR pre-race preparations that attract a significant number of event patrons well before the event start.
| Event | Attendance | Event Start | Site Open | Peak Traffic Flow Occurrence |
|---|---|---|---|---|
| 2001 NASCAR Kansas 400(20) | 100,000+ | 12:00 P.M. | 6:00 A.M. | 8:00 A.M. |
| Anaheim Angels weeknight baseball game – July 1997(15) | 18,197 (capacity 37,000) | Evening | 2+ hours before first pitch | 1 hour before first pitch (82% of arrivals – 29% peak 15 minutes) |
| Cleveland Indians Saturday baseball game – July 1997(15) | 43,070 (capacity 43,368) | Afternoon | 2+ hours before first pitch | 1 hour before first pitch (67% of arrivals – 19% peak 15 minutes) |
| New York Mets weeknight baseball game – June 1997(15) | 18,000 (capacity 56,500) | Evening | 2+ hours before first pitch | 1 hour before first pitch (62% of arrivals – 16% peak 15 minutes) |
| Event | Attendance | Event Start | Site Open | Peak Traffic Flow Occurrence |
|---|---|---|---|---|
| Louisiana World Exposition in New Orleans – weekday August 1984(21) | 35,700 | 10:00 A.M. | — | 31% of event patrons arrived by 11:00 A.M. |
| Louisiana World Exposition in New Orleans – Saturday in August 1984(21) | Unknown | 10:00 A.M. | — | 29% of event patrons arrived by 11:00 A.M. |
As illustrated in Table 5-15, the traffic arrival rate for sporting games and concerts peaks within one hour of the event start. Due to high traffic arrival concentration, practitioners may consider estimating a peak 15-minute traffic arrival rate and associated peak hour factor for roadway capacity analysis. With regard to continuous events, peak traffic arrival rate generally occurs immediately prior to the event start. Since event patrons do not place a high priority on meeting a continuous event start time, the concentration of continuous event arrivals is relatively low compared to other event categories. The peak level of event-generated traffic demand may occur during the middle of a continuous event operating period when both event arrival and departure traffic traverse the roadway system as patrons come and go from the event.
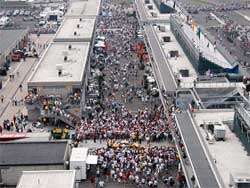
Figure 5-8. Pre-Event Activity
Practitioners may use event patron travel surveys in addition to historical event-generated traffic volume and/or parking occupancy counts to estimate the traffic arrival rate and peak time of occurrence. It should be noted that weather conditions, particularly for continuous events and street use events, may significantly skew data. Thus, practitioners must exercise great care when developing future event estimates from historical data.
Market Area Analysis
A market area analysis identifies the origin and destination of trips to and from a planned special event. The analysis focuses on developing a regional directional distribution of event patron trips to/from an event site via personal automobile. The site refers to the collective parking areas serving the venue. A regional directional distribution specifies: (1) the freeway and arterial corridors serving the venue site and (2) the percent split and volume of event-generated automobile trips traversing each corridor. Appendix E contains a regional directional distribution prepared for the NASCAR Kansas 400 race.(20)
Table 5-16 summarizes three analysis methods used to define a planned special event market area.
| Method | Description |
|---|---|
| Travel time analysis |
|
| Distance analysis |
|
| Origin location analysis |
|
Travel Time and Distance Analysis
Practitioners can apply a travel time analysis or distance analysis to estimate the market area for any planned special event. Continuous events or street use events that do not offer advance ticket sales typically require a market analysis based on travel time or distance and referencing area population distribution.
Figure 5-9 illustrates an example travel time analysis for a downtown Chicago lakefront fireworks display. A geographic information system or other mapping software tool can create travel time zones, as shown in the figure, based on user-defined thresholds. Multiple travel time zones allow users to perform a weighted analysis of population distribution. Practitioners should categorize area population within each travel time zone by zip code or, for a 15 minute threshold or less, by census tract. Most geographic information systems and computer mapping tools generate spreadsheets identifying all spatial population categories within each travel time zone. Using the spreadsheet, practitioners can assign a freeway or arterial corridor, serving the event venue site, to each defined population category. The population distribution among roadway system corridors constitutes the regional directional distribution for the planned special event. Practitioners can also incorporate Census socioeconomic data into an analysis as necessary.
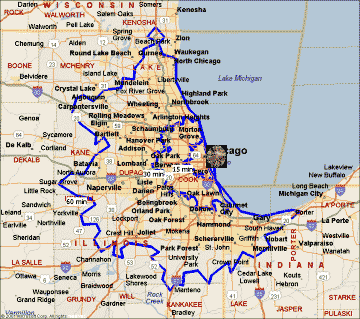
Figure 5-9. Example Travel Time Analysis
The described travel time analysis methodology applies to a distance analysis as well. Instead of travel time thresholds, users define distance thresholds. Practitioners should exercise care in developing a planned special event market area by travel time or absolute distance to the event venue site:
- In the case of continuous events or street use events, the market area must incorporate only the community or region the event is staged for.
- Discrete/recurring events at a permanent venue, such as professional/major college sporting events or major concerts, warrant an expanded market area.
- A travel time or distance analysis for these events should not reflect a sensitivity to travel time or distance at the city/suburb level. In other words, an event patron located in a city suburb typically does not factor travel time into a decision to attend a professional or major college sporting event at a downtown venue.
Origin Location Analysis
An origin location analysis represents the most accurate method for developing an event-specific regional directional distribution. This analysis utilizes a statistically significant database of event patron travel origins. Input data includes advance or season ticket holder place of residence (e.g., place or zip code) or place of trip origin obtained through a past/similar event travel survey. An event economic impact study also indicates the cities or regions patrons will arrive from. A discrete/recurring event at a permanent venue requires ticket sales, and event organizers initiate ticket sales weeks and even months in advance of the event. But, event organizers or ticket sales companies may consider customer information confidential or proprietary.
An event patron travel survey (see Appendix D) proves effective in determining the exact origin of a patron trip to a planned special event. For instance, weekday events may attract a significant percentage of non-home-based trips as event patrons arrive from work. A survey of patrons attending weeknight baseball games at Pacific Bell Park in San Francisco indicates 28 percent of patrons come from work.(14) An event patron travel survey captures this critical information. Event patron departures from the event venue site typically involve home as a destination.
Practitioners performing an origin location analysis determine a geographical distribution of event patron origins. In turn, this distribution defines the freeway and arterial corridors that event patrons will use to access the event venue site in addition to a traffic distribution. An origin location analysis applies to all planned special events.
Parking Demand Analysis
A parking demand analysis functions to determine the amount of required parking for event patrons in the vicinity of the event venue. A parking occupancy study drives the overall analysis and determination of event parking areas. This study indicates the level of parking spaces occupied, relative to lot capacity, at intermittent time intervals. It also specifies an estimate of peak parking demand, a figure particularly useful for managing continuous events where parking space turnover occurs throughout the event day.
Figure 5-10 presents a parking demand analysis process used to determine the adequacy of event venue (on-site) parking and the identification of appropriate off-site parking areas. The flowchart denotes an analysis conducted for a one-time interval. Practitioners should perform an iterative parking demand analysis, over hourly time periods as necessary, if considering parking areas characterized by high background parking turnover.
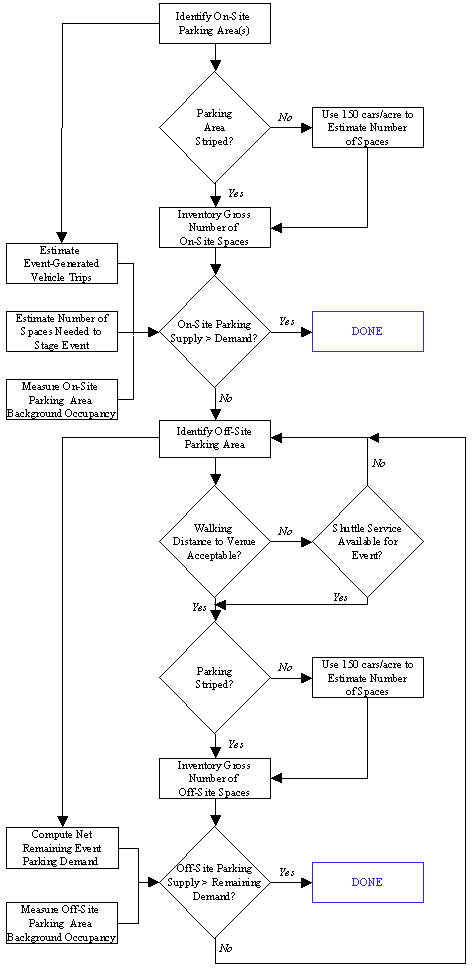
Figure 5-10. Parking Demand Analysis Process D
Examination of on-site parking areas must account for spaces lost to the event sponsors, bus staging, limousine and taxi staging, media parking, event employee parking, and event participant parking. Net parking supply incorporates event staging needs and any background traffic that can legally use the parking area during event hours of operation. In order to conceptually measure parking supply within a non-striped area, assume 150 cars per acre as a rule of thumb.(22) The travel forecast analysis yields an estimate of parking demand by quantifying the anticipated number of event-generated automobile trips. Aside from continuous events, practitioners should perform a parking demand analysis that accounts for maximum event-generated parking demand.
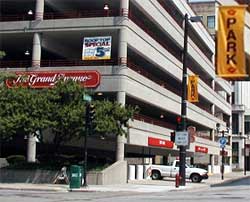
Figure 5-11. Designated Event Off-Site Parking Area
In evaluating parking supply versus demand, consider as a rule of thumb that 90 to 95 percent lot occupancy represents a full parking area.(23) This especially applies under scenarios where event patrons must self-park. When a parking area reaches a near-capacity occupancy level, drivers experience difficulty locating an empty parking space and must circulate through the lot again or seek another parking area. Continuous events and street use events often utilize self-park areas.
Overflow parking areas comprise both on-street parking and public/private off-street parking areas, located off-site but in the immediate vicinity of the event venue. Figure 5-11 shows a designated off-street parking area, as noted by a light post banner, for the Summerfest music festival in downtown Milwaukee, WI. Identification of off-site parking areas depends on walking distance to the event venue. For example, a 15-minute walking time threshold allows consideration of off-street parking areas within 3,600 feet of an event venue, assuming a pedestrian walking speed of 4 feet per second. Parking areas located further from the venue would require a continuous shuttle service.
Table 5-17 shows a parking occupancy summary for a regional/multi-venue event in downtown Denver, CO. The spreadsheet format conveniently organizes and presents occupancy estimates by time of day and day of week. A parking demand analysis for a regional/multi-venue event presents special challenges. Practitioners must determine the hourly parking requirements for each facility separately. Parking areas in this case function under shared parking operation, servicing variable demand rates from different planned special events over the course of a day.
| Spaces | Thursday | Friday | Saturday | Sunday |
|---|---|---|---|---|
| Total Spaces | 42,605 | 42,605 | 35,380 | 35,380 |
| Available Spaces | 10,651 | 10,651 | 30,073 | 30,073 |
| % Occupancy w/Event Overflow Parking Downtown and Using Coors Field* | Thursday | Friday | Saturday | Sunday |
|---|---|---|---|---|
| 10:00 | 75% | 73% | 7% | 14% |
| 11:00 | 80% | 79% | 17% | 41% |
| 12:00 | 93% | 84% | 38% | 57% |
| 1:00 | 94% | 84% | 51% | 68% |
| 2:00 | 94% | 84% | 55% | 83% |
| 3:00 | 94% | 78% | 52% | 92% |
| 4:00 | 90% | 73% | 59% | 75% |
*Events included are Rockies game on Thursday and TOC/GP Fri-Sun |
||||
Traffic Demand Analysis
A traffic demand analysis determines: (1) a local area directional distribution and (2) the overall assignment of event-generated traffic. This analysis references results obtained through the travel forecast, market area analysis, and parking demand analysis.
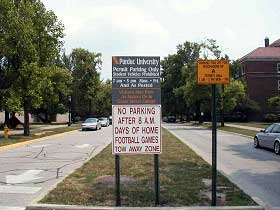
Figure 5-12. Local Area Planned Special Event Parking Restriction
The local area directional distribution indicates freeway ramps and intersections, including turning movements, traversed by event-generated traffic arriving to or departing from a planned special event. The regional directional distribution, as determined in the market area analysis, quantifies the percentage of event patron trips (e.g., origins) by regional freeway and arterial corridor, and the planned special event parking areas, as determined in the parking demand analysis, represent sink nodes or location of trip destination. Traffic assignment includes event-generated automobile traffic, express buses, charter buses, limousines, and other vehicles transporting event patrons, participants, and event employees. Practitioners performing traffic demand analyses should possess a personal knowledge of the roadway system surrounding an event venue in addition to existing traffic conditions.
A parking demand analysis assesses event parking sufficiency. The analysis does not define local traffic patterns to/from individual parking areas. Practitioners, instead, must gauge the utility associated with drivers choosing individual parking areas. The key components comprising this utility include driving time, parking cost, and walking time.(24) The attractiveness of each lot varies by freeway or arterial corridor serving the event site, yet event patrons will accept a moderate increase in overall driving/walking time in exchange for a substantial parking cost savings. The event planning team and traffic management team must recognize such driver behavior and formulate the appropriate traffic flow routes and develop traffic management strategies to manage site access and circulation effectively. Figure 5-12 illustrates one strategy, instituting on-street parking restrictions on the day-of-event. Pre-trip and en-route traveler information also influences driver choice regarding parking selection.
Traffic demand analysis includes developing composite background and event-generated traffic projections for all roadway system facilities serving the event venue. Composite traffic volumes expressed as an hourly (or sub-hourly) rate meet roadway capacity analysis input requirements. These rates identify the peak hour capacity analysis periods during event patron arrival and/or departure. Practitioners must adjust background traffic volumes to account for displaced and diverted traffic due to road closures required to stage the planned special event. These road closures alter traffic patterns to/from commercial trip generators, residential areas, and places of worship. Displaced background traffic assignment involves identifying the shortest path alternate route that has excess capacity.
As a preliminary step to assess the need to perform a detailed roadway capacity analysis, draw a circular screen line (e.g., 0.5 to 1 mile radius) around the event venue site. Note each roadway segment intercepted by the screen line, and estimate the segment's capacity in each direction of travel. Create a chart of hourly composite traffic volumes for each identified segment, and assess capacity deficiencies in both directions of travel. Figure 5-13 shows a preliminary road segment capacity analysis conducted as part of a feasibility study for a regional/multi-venue event in Denver, CO.
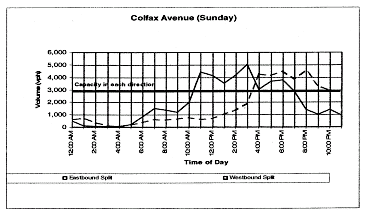
Figure 5-13. Example Preliminary Road Segment Capacity Analysis(23)
Roadway Capacity Analysis
A roadway capacity analysis uses traffic demand analysis results to measure the impact of a proposed planned special event on roadway system operations. At the feasibility study level, a roadway capacity analysis references existing roadway facility operations and capacity (e.g., no reverse flow operation or other capacity enhancements). The analysis assumes pedestrian access management strategies will minimize pedestrian/vehicular conflicts, and parking area access points provide sufficient service flow rates through proper design. Regardless of capacity analysis outcome, pedestrian accommodation and parking management represent key considerations in a planned special event traffic management plan.
Roadway capacity analysis involves freeway segments, freeway junctions such as ramps and weaving areas, street segments, signalized intersections, and unsignalized intersections. To evaluate these facilities, practitioners can employ one of two approaches: (1) analyze section and point capacity or (2) analyze network operations.
- The first approach pertains to applying Highway Capacity Manual (HCM) recommended capacity analysis methodologies to discrete locations in the study area. Practitioners determine roadway sections, freeway junctions, or intersections for analysis, then apply an appropriate HCM methodology to identify movement capacity constraints and measure operations level of service.
- The latter approach concerns utilizing a computer traffic simulation model to identify bottleneck locations, or hot spots, and associated saturation flow rates. Practitioners scope the size and detail of the simulation model network, and the model works to reveal operational deficiencies.
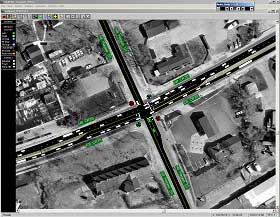
Figure 5-14. CORSIM Simulation Animation
Computer traffic simulation models provide seamless analysis of traffic operations across a network of roadway segments and intersections. This proves particularly useful in analyzing a corridor of closely spaced traffic signals where signal coordination and vehicle spillback from adjacent intersections sharply impact traffic operations. Numerous macroscopic and microscopic simulation models exist, including the CORSIM microscopic computer traffic simulation model developed and supported by FHWA. CORSIM can interface component freeway (FRESIM) and arterial (NETSIM) simulation models. For example, it has the capability of showing a freeway entrance ramp bottleneck and the resulting queue spillback on adjacent streets (or vice versa). As shown in Figure 5-14, CORSIM also affords practitioners and event planning team stakeholders the opportunity to view an animation of simulated traffic operations.
Mitigation of Impacts
Mitigating anticipated planned special event impacts on travel represents the ultimate goal of conducting a feasibility study. The mitigation of congestion and potential safety impacts identified through a feasibility study requires development of a traffic management plan and complementing travel demand management strategies. In turn, practitioners can utilize the tools and techniques used to determine feasibility study results in order to evaluate various mitigation strategies and determine if the selected strategies adequately mitigate identified transportation system deficiencies.
Table 5-18 lists numerous tools for mitigating planned special event impacts on local roadway and regional transportation system operations. In meeting the overall travel management goal of achieving efficiency, these tools target utilizing the excess capacity of the roadway system, parking facilities, and transit. Through travel demand management, event planning team stakeholders develop attractive incentives and use innovative communication mechanisms to influence event patron decision-making and, ultimately, traffic demand. Chapters 6 and 7 detail impact mitigation strategies and tactics.
| Category | Example Tools |
|---|---|
| Freeway traffic control |
|
| Street traffic control |
|
| Intersection traffic control |
|
| Traffic incident management |
|
| Category | Example Tools |
|---|---|
| Traffic surveillance |
|
| En-route traveler information |
|
| Category | Example Tools |
|---|---|
| Transit incentives |
|
| High occupancy vehicle incentives |
|
| Event patron incentives |
|
| Bicyclist accommodation |
|
| Local travel demand management |
|
| Pre-trip traveler information |
|
Planned Special Events Traffic Management | Privacy Policy