National Work Zone Awareness Week
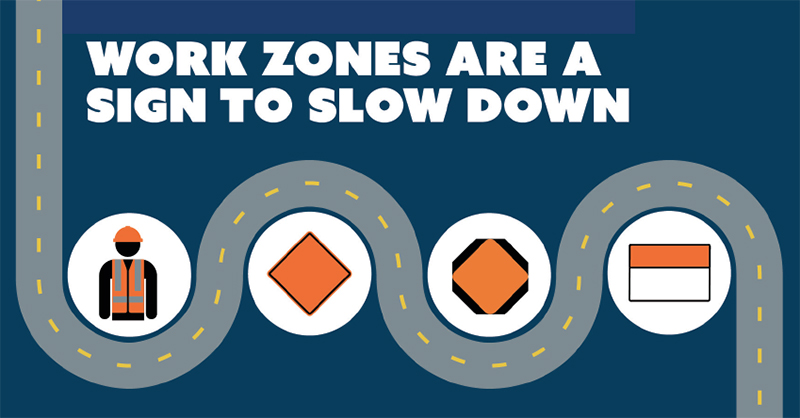
Work Zones are a Sign to Slow Down
Printable Version [PDF, 380 KB]
Contact Information: Operations Feedback at OperationsFeedback@dot.gov
U.S. Department of Transportation
Federal Highway Administration
Office of Operations
1200 New Jersey Avenue, SE
Washington, DC 20590
March 2022
FHWA-HOP-22-050
April 11–15, 2022
Source: Federal Highway Administration
Every spring, Federal Highway Administration (FHWA) and its partners sponsor National Work Zone Awareness Week (NWZAW), to bring attention to motorist and worker safety and mobility issues in and around work zones. As roadways are built, maintained, and upgraded with the latest safety features, it is also essential that roadway construction and maintenance zones are safe for workers. FHWA has supported work zone safety efforts across the country for decades and, thanks to the Biden-Harris Administration’s Bipartisan Infrastructure Law, states and local communities now have significant resources to maintain and rebuild safe roads and bridges and improve safety for all road users.
NWZAW is the perfect time to look back at our safety history for an eye on how we can save lives. Work zones contribute to the overall national crash statistics that we all want to see decrease. Unfortunately, the rate of fatalities from all causes nationally has not substantially improved over the last ten years and continued to increase in 20201, including a 21% increase in work zone fatalities involving persons on foot and bicyclists.5 Since 2015, the annual number of fatalities overall has exceeded 35,000, with millions more injured each year.2
With work zones being a sign to slow down, please keep the following tips in mind:
- Plan Ahead. Before traveling, look up the latest traffic conditions on the route you plan to take. Information on active work zones is available from many agency and private-sector websites, apps, and on social media to help you plan your trip, and possibly avoid work zones altogether.
- Minimize Distractions. Be aware of your surroundings, avoid changing radio stations, and put your phone away when driving through a work zone. Work zones can change daily, so anticipate new traffic patterns and look out for other drivers and road users.
Pay Attention. In 2020, 170 persons on foot and bicyclists lost their lives in work zone crashes.
- Look Out for Workers. In 2020, 117 workers died in highway work zones.3
- Check Your Speed. Obey posted work zone speed limits, look out for stopped or slow traffic, and maintain a safe following distance from the vehicle in front of you to reduce the risk of crashes with other vehicles and with highway workers.
- Be Careful Around Large Vehicles. Large vehicles can be harder to maneuver and slower to respond, so avoid making sudden lane changes in front of trucks or buses and look out for construction vehicles.
- Be Prepared for Sudden Stops. Work zones sometime cause congestion, delays, and traffic queues. Be alert and watch for sudden stops. In 2020, 20 percent of all fatal work zone crashes involved rear-end collisions.4
Slow down. Speed was a contributing factor in over 37 percent of 2020 fatal work zone crashes, increasing from 32 percent the year prior.
- Read the Signs. Signs provide guidance to road users of traffic laws or regulations within the work zones. Remember that signs, cones, barrels, and flaggers are there to help maneuver you safely through the work zone.
Work Zone Crashes Occur on All Types of Roadways. Collector road crashes increased from 6 percent in 2019 to 8 percent in 2020.
- Do Your Part. Everyone is responsible for doing all we can to work together and ensure we all stay safe.
Visit the FHWA Work Zone Management website at www.fhwa.dot.gov/workzones and the National Work Zone Safety Information Clearinghouse website at www.workzonesafety.org for access to resources, guidance, and training.
TOTAL WORK ZONE TRAFFIC FATALITIES5
Based on National Highway Traffic Safety Administration (NHTSA) Fatality Analysis Reporting System (FARS) data by person type.
| 2019 | 2020 | |
|---|---|---|
| 845 | 857 | |
| Drivers and passengers |
690 | 680 |
| Persons on foot and bicyclists |
141 | 170 |
| Others |
14 | 7 |
TOTAL WORK ZONE FATAL TRAFFIC CRASHES6
Based on NHTSA FARS data by type of roadway.
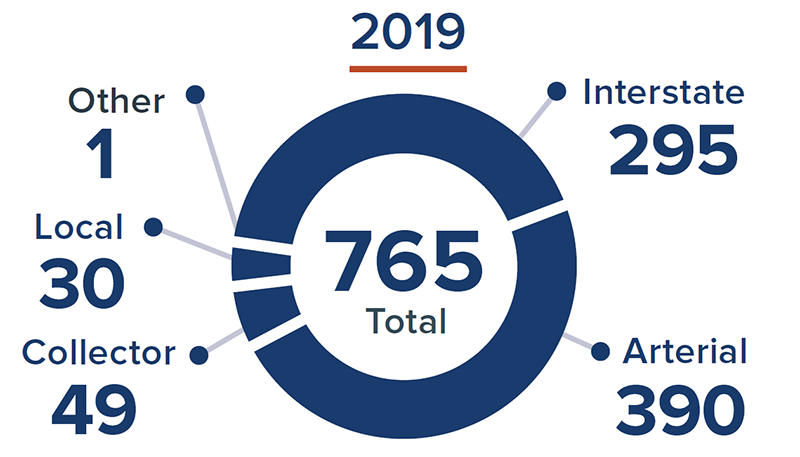
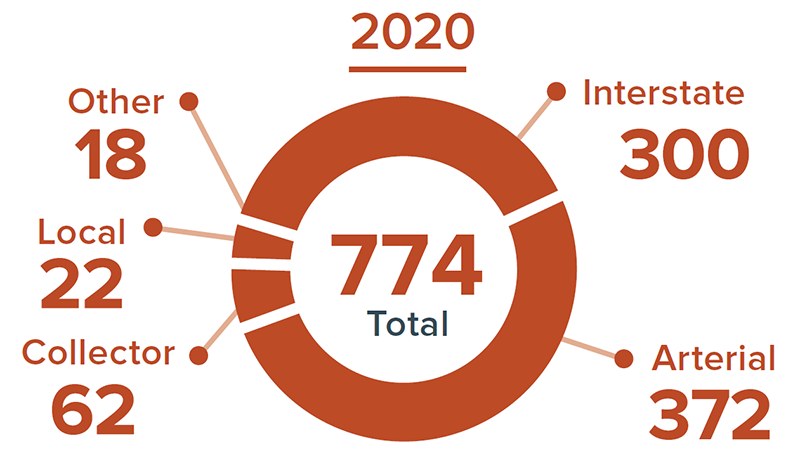
The following types of fatal work zone crashes changed significantly from 2019 to 2020:
| 2019 | 2020 | |
|---|---|---|
Involving a Rear-End Collision |
184 24% |
156 20% |
Involving a Commercial Motor Vehicle (CMV) |
252 33% |
208 27% |
Where Speeding Was a Factor |
242 32% |
287 37% |
HIGHWAY WORKER OCCUPATIONAL FATALITIES IN ROAD CONSTRUCTION SITES7
Based on Bureau of Labor Statistics data.
| 2019 | 2020 |
|---|---|
| 135 | 117 |
Trends: From 2019 to 2020, work zone fatalities increased by 1.4 percent, while overall roadway fatalities increased by 6.6 percent.8 Although there were decreases in the percentages of fatal work zone crashes involving rear-end collisions as well as those involving a CMV, these were offset by an increase in fatal work zone crashes that involved speeding. Persons on foot and bicyclists also saw a significant increase (21 percent) in work zone fatalities in 2020 relative to 2019.9
1, 2United States Department of Transportation, https://www.transportation.gov/NRSS/SafetyProblem. [ Return to Note 1 ] [ Return to Note 2 ]
32020 Census of Fatal Occupational Injuries, U.S. Department of Labor, Bureau of Labor Statistics, in cooperation with States, New York City, the District of Columbia, and Federal agencies. [ Return to Note 3 ]
4FARS 2020 Annual Report File, NHTSA. FARS data shown here are from the 50 States, the District of Columbia, and Puerto Rico. [ Return to Note 4 ]
5, 6, 9FARS 2019 Final File and 2020 Annual Report File, NHTSA. FARS data shown here are from the 50 States, the District of Columbia, and Puerto Rico. [ Return to First Note 5 ] [ Return to Note 6 ] [ Return to Note 9 ]
72019 and 2020 Census of Fatal Occupational Injuries, U.S. Department of Labor, Bureau of Labor Statistics, in cooperation with States, New York City, the District of Columbia, and Federal agencies. [ Return to Note 7 ]
8FARS 2020 Traffic Fatality Data, NHTSA. FARS data shown here are from the 50 States, the District of Columbia, and Puerto Rico. [ Return to Note 8 ]
Note: Figures are subject to revision, as values reported in the National Highway Traffic Safety Administration (NHTSA) Fatality Analysis Reporting System (FARS) may be updated intermittently. Values shown here reflect what is reported by NHTSA as of March 2022.