Executive SummaryThe Federal Highway Administration (FHWA) developed the Traffic Incident Management Capability Maturity Self-Assessment (TIM CM SA) in 2002 to evaluate the state of practice in traffic incident management (TIM) programs in the United States. State and local TIM program managers use the TIM CM SA to benchmark and evaluate the success of their TIM programs and help identify opportunities to improve their programs. In 2020, the TIM CM SA underwent major revisions to reduce the number of questions from 55 to 41, and to make the 2015 TIM CM SA scores the new baseline against which progress will be measured here and in the future. Prior to 2015, FHWA used the assessments completed in 2003, 2004, and 2005 (78 total) to determine baseline scores. The TIM CM SA underwent major revisions in 2007, 2011, and 2015. Two factors drive the new 2015 baseline: (1) TIM CM SA scoring guidance, which was instituted in 2015 to remove subjectivity in how participants score their programs, and (2) advancement of state of practice in TIM programs since the original assessments in 2003, as well as updated assessment questions. Benchmarking against 2015 scores is a more reliable measure of TIM program progress. In 2020, a total of 99 locations completed a TIM CM SA for the national analysis, up from 94 in 2019. This included six new locations that submitted a TIM CM SA for the first time. The 41 scored questions in the TIM CM SA were grouped into three sections: Strategic, Tactical, and Support. Table 1 shows the average score for each TIM CM SA section from the new 2015 baseline and 2020, along with the percent change from the baseline.
Note: The numbers in this table demonstrate general patterns, and have been rounded for ease of communication.
The 2020 TIM CM SA mean scores were calculated by population for the top 40 metropolitan areas, and the top 75 metropolitan areas. All other submittals were included in the mean score for non-top 75 metropolitan areas. The overall mean 2020 score was 70.0 percent (out of 100 percent), a 9.3 percent increase over the 2015 baseline. Mean scores were higher in larger metropolitan areas than in smaller areas:
The TIM CM SA is intended to represent the consensus opinion of TIM stakeholders completing an annual assessment in each TIM program area (city/region/State). Starting with the 2017 TIM CM SA, an optional question was added to identify which TIM stakeholders (by stakeholder type, not by a specific name or agency) had been involved in completing the annual assessment. Despite limited in-person meetings in 2020 to complete the TIM CM SA, 77 percent of the TIM CM SA submissions included input from two or more stakeholder groups. Additionally, participation by six stakeholder groups increased in 2020:
Figure 1 shows the percentage involvement of TIM stakeholder groups in completing the 2020 TIM CM SA. Stakeholders in the “Other” group are safety service patrol providers, local/regional governments, public works departments, consultants, port and turnpike authorities, transit, and universities. Appendix A lists all 41 TIM CM SA questions, their respective 2015 baseline and 2020 scores, and percentage of programs scoring a 3 or higher on each question.1 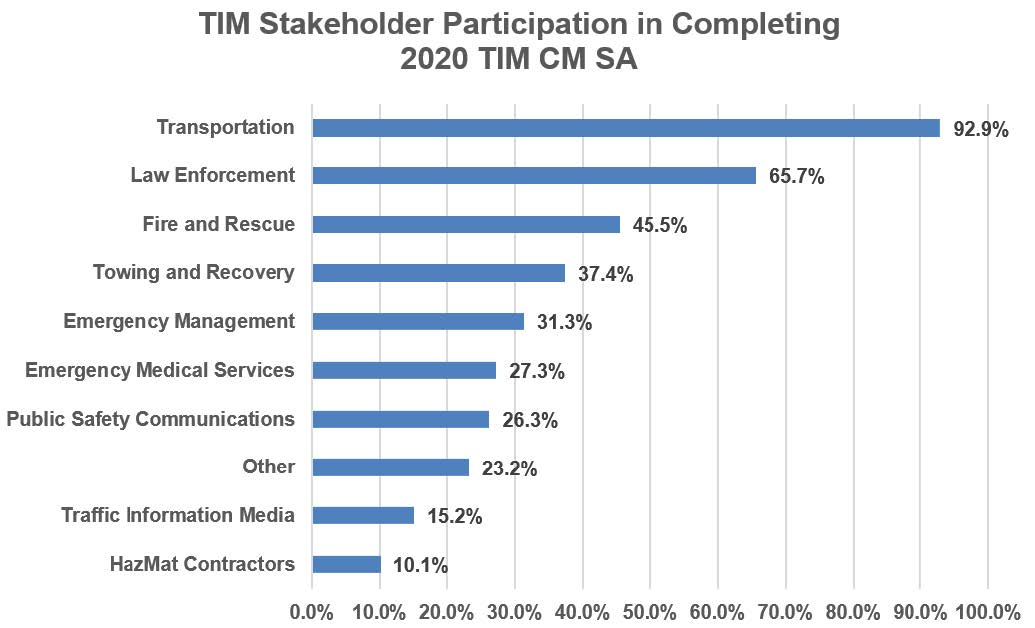
% = percent. HazMat = hazardous material. TIM = traffic incident management. TIM CM SA = Traffic Incident Management Capability Maturity Self-Assessment. Source: FHWA Figure 1. Graph. 2020 Traffic Incident Management Capability Maturity Self-Assessment stakeholder participation. 1 Scores of 3 and 4 indicate the highest levels of progress for a particular question. [ Return to note 1. ] | ||||||||||||||||||||||||||||||||||||||
|
United States Department of Transportation - Federal Highway Administration |
||