| Skip to Content |
|
Integrated Modeling for Road Condition Prediction Phase 3 Project ReportChapter 5. Analysis, Conclusions, and Recommendations for Further StudyThe Integrated Modeling for Road Condition Prediction (IMRCP) demonstration in the Kansas City area has generated a significant body of operations data and experience. This section summarizes lessons learned and deployment considerations, describes some potential applications for IMRCP, draws conclusions from the demonstration, and recommends topics for further study. Lessons LearnedAccessing and maintaining data services needed to feed IMRCP are significant challenges. Weather forecast data are voluminous but manageable due to the well-documented National Oceanic and Atmospheric Administration (NOAA) and National Weather Service (NWS) interfaces. These apply nationally and can be reused in any IMRCP deployment within the continental United States. Even so, NOAA has changed some interfaces during the course of this project that required recoding some data collections components. Collection of weather data from NOAA sources is not easily configured by non-information technology (IT) or non-meteorological staff. Access to traffic data is problematic. Real-time access to agency data is preferred but may be difficult to maintain. Advanced transportation management system (ATMS) software is not typically focused on sustained data provision beyond the transportation management center (TMC), and those data feeds are generally less important to an agency than its own internal operations users. In addition, historical data archives needed for training the traffic models may not be in the same data formats or be as accessible as the real-time data. Third-party and commercial data (e.g., from probes) may not be any more accurate, and may not be available in real time for IMRCP integration (depending on contracts with agencies and their terms of service). Many of these concerns would be mitigated by an IMRCP deployment within a transportation agency's own TMC, where tighter configuration control over system metadata and fewer potential network access issues. Hydrological data may be available, but not necessarily through a transportation agency. NOAA/NWS has made great strides in this area during the course of this project and has advanced data availability from its own hydrological networks and those of partner agencies. Data for small streams are less available, but increasingly important for more extreme severe weather systems. Hydrological data are also still difficult to relate to the transportation network. Flood stages are generally identified with particular stations, and do not necessarily relate to geodetic references enabling reference to nearby roadways. Geographical and time references of data are essential to data integration across such disparately sourced data sets. While weather data are well referenced in space and time, that is not necessarily the case with traffic data, which are more typically associated with a road network link. IMRCP needs to know the applicable location of the sensed traffic data rather than the location of the sensor, mast, or cabinet. In this context, using sensor identifiers (ID) is difficult to manage. Even within a particular system context, IDs may vary in time for a fixed set of assets—for example, in assigning a new one, or moving/revising an old one. Managing IDs across applications or systems is more difficult since each component may prefer or need its own IDs for a common set of objects. Time references for data have issues with determining their extents, meaning to the range of times over which the values are valid. When does the value become relevant or age out? Sometimes references assume an equally spaced series of data values (for example, in traffic detection) whereas others create new data points only when the value changes (for example, in the hydrological data feeds). Both models suffer from difficulty in handling gaps in the series of time-based observations. IMRCP traffic forecasts demonstrated their capability and value, particularly in filling the field of near real-time views and very short-term predictions (fewer than 30 minutes [min]). The accuracy and reliability of the predictions are, nonetheless, somewhat limited by data availability. Accuracy and reliability affect the confidence with which operators and other users view the predictions, and their applications, in weather-responsive management strategies (WRMS). The solution likely has multiple facets, some of which are not directly under the control of the IMRCP models or deployments. Improving the maintenance, calibration, and reliability of agency fixed traffic detectors to provide a "ground truth" view would greatly improve model accuracy. Sections of the roadway network with sparse traffic data would benefit from using real-time probe data to supplement the fixed detectors. Adding traffic data quality checking to isolate detectors that may be out of calibration would improve the reliability of the forecast models. Based on the project experience, operators are very focused on the here and now, monitoring known problem areas and incidents. They do not necessarily have the time or means to address the overall network conditions or to ask what might be about to happen. As such, it may be hard for operators in such environments to appreciate the potential of a traffic forecast, particularly when it requires monitoring yet another application or screen in a TMC. There seems to be a strong preference for having outputs integrated into existing TMC interfaces. Maintenance personnel are focused almost exclusively on the weather forecasts. Traffic is not a first-order consideration in treatment plans, other than generally identifying priority routes. They may be unclear on how IMRCP fits with other road weather tools like maintenance decision support systems (MDSS). They generally want a long view of weather conditions commensurate with the duration of a storm, which may need forecasts 24–48 hours (h) in advance. That time horizon is inconsistent with the 2-h window available with the traffic forecasting tools used in this demonstration deployment. IMRCP, as deployed for this demonstration, has not been able to demonstrate the feedback of treatment and observed conditions into the forecast models. This is primarily an issue of having insufficient winter maintenance reporting in the study area (although the Missouri Department of Transportation [MODOT] is now addressing that opportunity) and would also require road condition model updates to accommodate the treatment data. It has not been an issue in the Kansas City deployment due to the type and extent of winter weather conditions encountered during the demonstration interval, but it would be a bigger issue in hard winter areas where snow and ice are on roads for an extended multi-storm period. Success in IMRCP applications will depend, to some extent, on building awareness of WRMS and their benefits. This may be the exception rather than the rule among agencies that would be candidates for IMRCP deployments. That awareness greatly facilitates discussions of the potential value and application of IMRCP in operations. This phase 3 deployment was unable to identify or implement any specific strategies. Although the current IMRCP deployment provides extensive data resources, it is difficult to evaluate the forecast results. This is partially just the volume and temporal/spatial complexity of the data sets, but also identifies a need for more robust forecast performance measures. Once those are identified, they could facilitate inline performance monitoring as events move from initial conditions through the forecast periods. This would further support a performance dashboard for the roadway network and the IMRCP system itself. Deployment ConsiderationsAn emphasis in phase 3 was to investigate the potential for interested agencies to develop their own deployments of an IMRCP system. This section summarizes the relevant considerations in a localized IMRCP deployment. A description of deployment needs and processes is detailed in the non-binding user manual, Integrated Modeling for Road Condition Prediction Installation and Administration Guide.10 Any agency intending to deploy a predictive capability, such as IMRCP, should have a collective institutional interest in the opportunity. The upper-management levels will need to have a vision of the potential of predictive analytics to prepare for and support its implementation. Technical champions will be needed to provide expertise and direction in its intended applications. And invested users will be essential in application of the system to operations strategies. Deployments without these institutional stakeholders will be challenged to develop and support sustained effective operations. Building and deploying an IMRCP instance is detailed in the non-binding user manual, Installation and Administration Guide.11 The IMRCP system and its components and documentation have been developed under U.S. Department of Transportation (USDOT) sponsorship and are available to interested parties on the Intelligent Transportation Systems (ITS) CodeHub.12 Software components are open-source licensed, except for some TrEPS components that are available for download as executables. Other server components used in the phase 3 IMRCP demonstration have also used open-source software. The database server is an open-source MariaDB Server, and Apache Tomcat® 8 software is used for the application/web server. Other commercial databases and web servers could be used if administratively required for a particular environment. Java™ Runtime Environment 1.8 should also be installed on the server. In practice, deploying an IMRCP system generally requires setting and configuring the server environment and the application components, identifying and configuring the data access components needed for model localization, configuring the models to use the localized data, and monitoring and maintaining the system. Although the computational components have been designed to accommodate some irregularities in data access and quality, the distributed nature of the system data sources and services requires consistent monitoring to assure a high quality of service. Much of the data presented to users through the IMRCP interfaces are associated with the road network of the study area. The definition of the area to be modeled needs to consider the potential applications, extent of the network, availability of data from traffic monitoring and control systems, and effort needed to acquire the data and model the network. For example, creating the road network for the IMRCP study area is a critical and potentially time-consuming process. As described earlier, the Kansas City metro deployment in phase 3 modeled almost 6,000 road network links. The link data, though generally available from agency and third-party systems, have to be configured for the specific traffic and road condition models to be used in the deployment. The phase 3 demonstration did not completely automate that process, and significant manual quality checking of the underlying data was needed to assure consistency across two traffic models and the road weather model. IMRCP uses many local data sources specific to the study area. Ease of access to and quality of data available for the area are important considerations that may not, themselves, determine the relative value of a deployment, but nonetheless affect the deployment's applications and utility. Relative to the demonstration deployment, the study area uses data from traffic detectors maintained by the KC Scout TMC, but the traffic model calibration found that data availability from some detectors for calibration was not reliable enough to use in training and operating the system. System metadata (such as the location of the traffic sensors on the network links) presented similar challenges with availability and precision. The accuracy of IMRCP predictions is directly related not just to the physical model of the road network, weather, and hydrology, but also to the operations and event data within the modeled region. TMC operators and ATMS software generally excel at identification and management of incidents and ITS traffic controls. Work zone management and winter maintenance operations may not, however, be integrated with those ATMS systems. Operational awareness of special events may be similarly limited. This is especially challenging in an area like the Kansas City study area, which has multiple State and local operating agencies. Identifying and entering data for work zones in the area, beyond those directly provided by the automated ATMS data feed, involved going to two State and multiple county/municipal data sources for work zone locations and schedules, with an IMRCP system manager entering the work zone data manually. Potential ApplicationsIMRCP and its predictive analytics have potential benefits and applications across transportation management and operations. At a high level, IMRCP may offer agencies operational awareness, informed planning and response, and improved safety and mobility. IMRCP can offer TMC staff, winter maintenance staff, and other decision makers improved insight and overall awareness of the effect of impending weather on traffic. Agencies can monitor condition information, such as traffic, pavement state, pavement and air temperatures, precipitation, wind, and flooding, that is more typically distributed across multiple systems. With the enhanced operational awareness and predictive analytics, agencies can better plan and make strategic decisions. For example, the capability of viewing future impacts may prompt the agency to issue news releases or social media alerts, update the staffing plans for incident responders or snowplow drivers, change work zone plans, arrange for alternate traffic routes, enact traffic controls (e.g., variable speed limits [VSL], variable message signs, ramp metering, road closure gates), or activate other response scenario plans. Agencies can use IMRCP and the collected data to analyze past events, determine lessons learned, measure performance, and guide future strategic decisions. These IMRCP benefits to transportation agency operations may be further extended in complementing other tools using similar data sets. As shown in figure 14, IMRCP extends user awareness of traffic and road conditions from the past into the present and future, beyond the capabilities of typical TMC tools and road weather information systems (RWIS) like the Weather Data Environment (WxDE). IMRCP shares road weather data and forecasts with MDSS while adding the traffic forecast perspective, but it does not provide the direct winter maintenance recommendations of an MDSS. 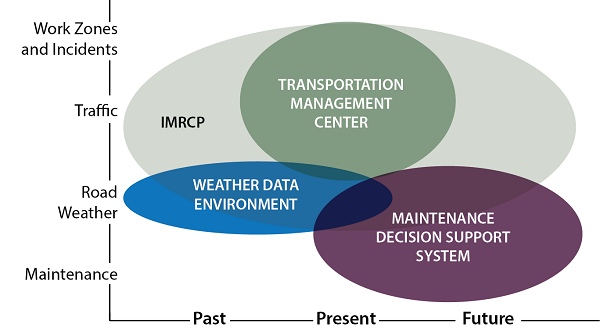
Image shows IMRCP includes road weather, traffic, and work zones and incidents in the past, present, and future. Transportation Management Center shows road weather, traffic, and work zones and incidents in the present. Weather data environment shows road weather in the past and present. Maintenance Decision Support System shows maintenance in the present and future. All of these tools overlap with eachother in some capacity.
Figure 14. Illustration. Integrated Modeling for Road Condition Prediction relationship to other weather-responsive management strategy tools. Pavement State PredictionIt may be beneficial for operators to view pavement state predictions as a weather event approaches, especially if the event will occur immediately prior to or during peak traffic hours. Predictions that indicate wet or icy roads may enable operators to better prepare for such events by focusing attention on those particular segments of the road network. Operations staff can provide more timely and accurate traveler information for travelers dealing with the inclement conditions. Maintenance staff otherwise without access to an MDSS may still be able to anticipate and make more informed plans for anti-icing and snow removal operations. Figure 15 illustrates conditions as a winter storm was arriving from the west of the Kansas City area prior to morning rush hour. An operator can see on the Pavement State and Precip Type layers on the map that pavements are largely dry on the eastern part of the metro, but subject to mixed precipitation on the western part. To view pavement state predictions for the rush hour, the operator moves the time function ahead to 7 a.m. The forecast conditions in figure 16 indicate that the mixed precipitation is expected to continue with spotty wet, snowy, and icy pavement conditions all across the metro. 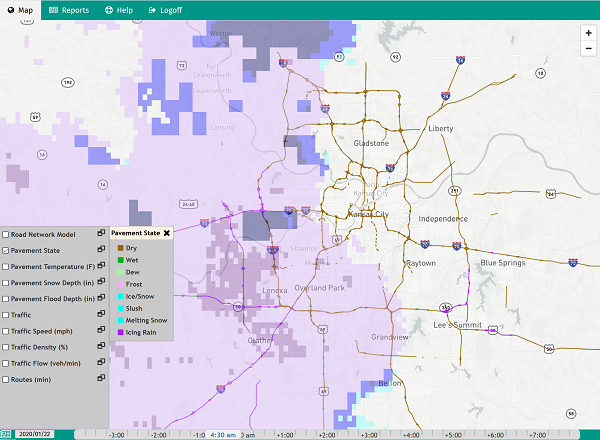
Figure 15. Screenshot. Pavement state example — 4:30 a.m., January 22, 2020. 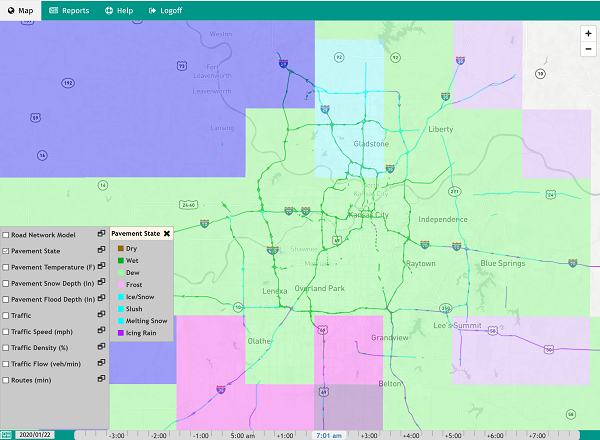
Image shows Kansas City and surrounding area. Northwest and southwest of the city is shaded purple, indicating pavement state is icing rain. North of the city is shaded light blue, incidating the pavement state is slush. South and east of the city is shaded pink, indicating the pavement state is frost. The rest of the area is shaded light green, indicating that the pavement state is dew.
Figure 16. Screenshot. Pavement state prediction example — 7 a.m., January 22, 2020. Travel Time PredictionsOperators and travelers may find the route travel times produced by IMRCP useful for monitoring congestion and commute times. During inclement weather events, users can use the IMRCP predictions to adjust the departure time for their daily commutes.13 As illustrated in figure 17, a user who lives near Interstate 435 (I–435) and Quivira and works at an office near the interchange between I–435 and Interstate 470 (I–470) could check to see the extent to which a passing winter storm will affect the usual morning commute. The user would find the routes layer from the road data layer tab on the map interface. This layer shows routes with available travel times displayed on the map. At 6 a.m., the travel time is still within reason, even with snow coming down (the blue shading across the map). 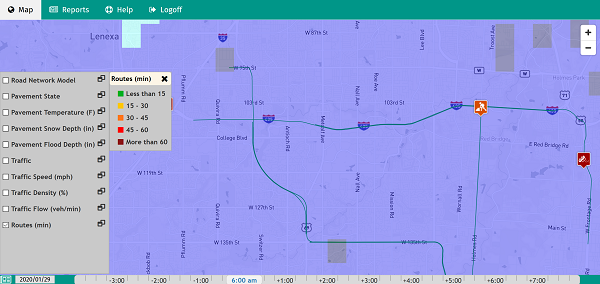
Image shows I-435 corridor southeast of Lenexa. I-435, Route 69, West 135th Street, Holmes Road, and Route 50 / West Frontega Road are all green, indicating that the routes are less than 15 minute travel time. The entire map is shaded blue, which indicates snowing.
Figure 17. Screenshot. Route travel time early in a winter storm. As these things go, waiting for the normal 7 a.m. commute time might have its consequences. On the one hand, the snow might be over by then. On the other, traffic is likely to be much worse. Moving the slider on the time scale 1 h into the future shows predicted conditions consistent with that expectation (figure 18). Even though the snow is forecast to be decreasing, travel time for that route increases from fewer than 15 min to as much as a half hour. Predicted travel times could be incorporated into traveler information messages to encourage leaving earlier or later than normal to avoid and lessen the impact of weather events on travel times. 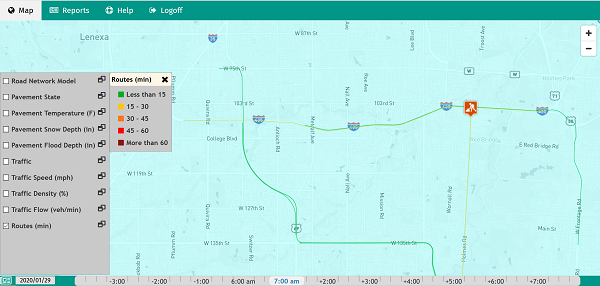
Image shows I-435 corridor southeast of Lenexa. The eastern section of I-435, Route 69, West 135th Street, and Route 50 / West Frontega Road are all green, indicating that the routes are less than 15 minute travel time. The western section if I-435 and Holmes Road are yellow, indicating the routes are 15 to 30 minute travel time. The entire map is shaded light blue, which indicates light snow.
Figure 18. Screenshot. Route travel time prediction for a winter storm. Flooding EventsThe IMRCP system may be able to monitor hydrological data during flooding events for potential impacts on transportation infrastructure. The Kansas City demonstration study area was chosen, in part, because of its urban small-stream, flash-flood challenges. Transportation system operators and emergency services personnel can use the IMRCP system to view predictions for flooded roads or to look back at the behaviors of a hydrological event. As a historical example, the small-stream flooding of July 27, 2017, proved to be a challenging hydrological event for the Kansas City study area. Several roads in the study area experienced flooding and closures. The NWS warning captured by IMRCP on July 27, 2017, at 6 a.m. in figure 19 is indicated graphically on the map in figure 20. The NWS alerts layer has been selected and the pavement flood depth layer displays the roads that registered as flooded based on the NWS inundation models. The overlays are darker in some areas as an indication of multiple watches and warnings overlaid on one another. Flood forecast depths, to the extent that they are available from NOAA/NWS, would be captured and viewable on the map. Closures for inundated roadways are included in the IMRCP traffic forecast models. Providing hydrological data in an interface with traffic and weather data provides an integrated predictive perspective for transportation operations. Although these events are historically infrequent, recent industry interest in transportation resiliency suggests that they will become more of a concern to transportation operations in the near future. Providing an integrated view of conditions would enable operators to provide more specific and complete traveler information, or to anticipate and dispatch driver assistance and maintenance crews. 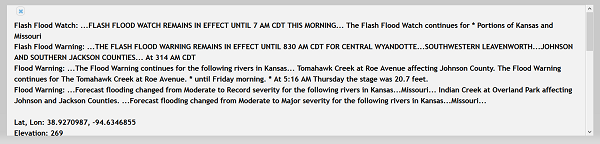
Warning Reads: FLash Flood Watch: FLASH FLOOD WATCH REMAINS IN EFFECT UNTIL 7 AM CDT THIS MORNING. The Flash Flood Watch continues for portions of Kansas and Missouri. Flash Flood Warning: THE FLASH FLOOD WARNING REMAINS IN EFFECT UNTIL 830 AM CDT FOR CENTRAL WYANDOTTE, SOUTHWESTERN LEAVENWORTH, JOHNSON AND SOUTHERN JACKSON COUNTIES, At 324 AM CDT. Flood Warning: The Flood Warning continues for the following rivers in Kansas: Tomahawk Creek at Roe Avenue affecting Johnson County. The Flood Warning continues for The Tomahawk Creek at Roe Avenue until Friday morning. At 5:16 AM Thursday the stage was 20.7 feet. Flood Warning: The Forecast flooding changed from Moderate to Record severity for the following rivers in Kansas: Missouri, Indian Creek at Overland Park affecting Johnson and Jackson Counties. Forecast flooding changed from Moderate to Major severity for the following rivers in Kansas: Missouri. Lat, Lon: 38.9270987, -94.6346855. Elevation: 269.
Figure 19. Screenshot. Hydrological event alert for July 27, 2017. 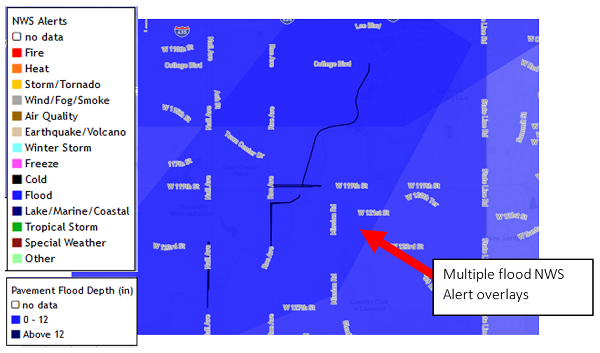
is completely covered in blue, with a few roads shaded in black. The blue shading on the map indicates flooding, with pavement flood depth at 0 to 12 inches. The black shading indicates pavement flood depth over 12 inches. The map shows multiple flood NWS alert overlays.
Figure 20. Screenshot. Local hydrological event map for July 27, 2017. ConclusionsThe objectives for IMRCP phase 3 development and deployment have been met. The enhancements made to expand the regional view and traffic modeling capabilities have been integrated successfully into the system. The deployment provides real-time predictions of traffic and road conditions over the entire KC metro area, which incorporate data on atmospheric and road weather conditions, traffic, incidents, hydrological conditions, work zones, winter maintenance operations, and special events, when such data are available. The predictions are available to system users, operators, and maintainers in user-friendly maps and reports. The underlying IMRCP system provides a scalable framework for deployment in other areas, is extensible to other types and sources of data, and can support additional application-specific user interfaces as needed. Accurate and complete traffic and weather models depend on available and accurate data to drive the models. Incorporating available data may furthermore depend on available and accurate metadata that describe the data sources and their qualification. Traffic data sources for phase 3, for example, were challenged by scarcity (not enough data in some parts of the roadway network), reliability (data intermittently unavailable), and uncertainty in metadata (precise location of the measured data relative to the roadway). Taken together, these limitations may constrain the accuracy of model outputs and their utility in practical applications. As was noted in the phase 2 report, atmospheric weather forecast models are mature and reliable for large-scale events, but are less accurate for very near-term needs at road network link levels. Current atmospheric forecast products from the NWS used in this demonstration provide 1-h temporal resolution and 3-kilometer (km), or greater, spatial resolution. This temporal resolution, in particular, leads to operational uncertainty as to when weather fronts might have an impact on particular links. Higher-resolution forecast models could improve the accuracy of forecasts for key points on the road network. IMRCP phase 3 has used two very different traffic models to provide predictions for the study area road network. The Traffic Estimation and Prediction System (TrEPS) dynamic traffic assignment (DTA) approach is intended to predict flows and traffic conditions on all facilities in a network, including arterials. In many networks, such as this phase 3 study area, detectors are present only on freeways, with limited deployment on major arterials. By contrast, the machine learning and time series techniques used in the demonstration machine learning-based prediction (MLP) model are based on local approaches to speed prediction. The TrEPS approach was motivated by the need to support development of intelligent traffic management solutions that consider flows not only on freeways, but also on the surrounding arterials. Accordingly, the TrEPS approach has a structural representation (simulation) of the flow patterns through the network, and provides predictions of flow (volumes), density (or occupancy), and speeds that are consistent with these values. Accordingly, the approach is predicated first on getting the flows (the demand) right across the entire network and predicting the associated congestion through a traffic model. IMRCP phase 3 has further resulted in two methodological improvements to the TrEPS approach by implementing an adaptive flow model on those links that have detectors, and a method to adjust the overall network demand in response to weather events, based on the detector data. Machine learning techniques and time series models, such as those used in the MLP, have generally been successful in predicting speeds over the near term. They will tend to do quite well when there is a sufficiently rich data archive to support training the models. These methods are relatively simple to implement and offer a lot of flexibility, as they do not require a full network representation or modeling the flow patterns through the different parts of the network. As such, they can be deployed and scaled effectively, from a computational standpoint, to all links in a network with sufficient sensor data. IMRCP phase 3 demonstrated the strong potential of machine learning methods for speed prediction on freeway links with and near existing detectors. Discussions with KC Scout TMC personnel indicated that the potential of the predictive information was not being fully realized. There was, instead, a reliance on the real-time model data as a primary gauge for traffic and road conditions. This is consistent with previous experiences whereby predictions alone are not sufficient in a real-time setting to affect operator actions. An awareness of the potential operational improvements associated with WRMS would facilitate, and may be a prerequisite for, seeing potential value of the integrated road condition predictions. Where that understanding is in place, system operators and maintainers will likely be more open to recommendations for what to do on the basis of these predictions—for example, recommendations on speed advisories under predicted weather events, or routes under incidents or construction. Research has shown the effectiveness of interventions predicated on predicted conditions rather than simply reacting to prevailing ones. Going forward, the value of the kind of predictions that IMRCP is capable of producing lies in developing applications that build upon these predictions to recommend weather-responsive transportation management strategies. Recommendations for Further Study, Development, and ApplicationThe lessons learned, deployment experiences, potential applications, and conclusions from the IMRCP phase 3 deployment have identified both gaps and barriers to further deployments. Gaps discussed in this report are primarily technical, but barriers may be limited acceptance with operators and maintainers, ease of deployment, or operational benefits. The research team's recommendations for further study are intended to close gaps, reduce barriers, and develop new opportunities for applying predictive capabilities in solving transportation operations challenges. Developing the physical road network model has required significant resources in IMRCP phase 2 and phase 3. A significant barrier to deployment would be lowered by considering automation of the road network modeling process in support of road condition and traffic forecasting. The Kansas City area deployment did not have a significant number of reliable local road weather observations from which to initiate forecasts. A future deployment should make more effective use of weather observations from mobile and fixed-road weather sources to improve the road condition model fidelity. Significant gaps in traffic detection stations on the road network have created challenges for calibration of the traffic models. Adding traffic probe data sources would improve the basis for both traffic model calibration and prediction. Traffic model configuration and calibration have required significant resources in phase 2 and phase 3. Barriers to future deployment could be considerably reduced by at least partial automation of traffic model configuration and calibration. Management of road network, traffic detection, hydrological station, and road condition sensor metadata was challenging throughout the project. Standardizing metadata management and providing an IMRCP system management interface would reduce barriers to deployment and improve prediction accuracy. Traffic data quality was found to be highly variable across the demonstration deployment network and through its duration. Implementing traffic data quality checking could significantly reduce modeling errors and improve model reliability and accuracy. The spatial accuracy of road condition predictions is hampered by the relatively coarse atmospheric forecast grids. That limitation can be addressed, and predictions improved, by developing or acquiring higher-resolution weather forecasts to feed the road weather condition models. As noted among the lessons learned, hydrological stations tend to provide stream levels relative to local flood stages, which may or may not be correlated with local roadways. A more complete integration of hydrological forecasts with road conditions and closures would acquire or develop inundation models for any risk-prone areas to be included in the deployment region. Although it was not the primary focus of the phase 3 demonstration deployment, supporting winter maintenance strategies was identified as a potential IMRCP application by KC Scout staff. Those applications would suggest providing winter maintenance modeling and tools more in line with current agency practice. A first potential enhancement would be to extend weather and road condition forecasts to encompass more typical storm durations (24–48 h). Integrating winter maintenance and road treatment data into the road condition modeling would improve forecast model fidelity for longer events with maintenance interactions. The MLP traffic model developed in phase 3 showed significant promise as an extensible and efficient means of providing traffic speed predictions. It was nonetheless limited in this text deployment by the range and availability of data to train and calibrate the model. Its accuracy and applicability to this and other networks could be extended to a broader range of road and weather conditions. The extension of MLP to predict other traffic parameters, such as traffic volume and density, is possible with additional data sources. These data sources include ubiquitous travel time data from private sector providers, such as INRIX and HERE, crowdsourced probe vehicle trajectory data, and continuous count station volumes and information on annual average daily traffic from conventional sources. MLP can also be used, in combination with simulation, to provide predictions of traffic under various traffic and weather management strategies. The volume and complexity of the data sets used and generated by the IMRCP system create challenges in data analysis and reduction. Developing WRMS-oriented performance measures and a dashboard for IMRCP predictive capabilities would reduce barriers to acceptance and deployment and potentially enhance its operational impact by focusing operator and analyst attention on key performance indicators, locations, and notifications. IMRCP phase 2 and phase 3 have focused on the development and evaluation of integrated predictive methods. Providing actionable WRMS recommendations from the system based on predicted conditions would remove a potential barrier to deployment and enhance its potential impact in an operational setting. Future IMRCP deployments may want to prioritize opportunities to cooperate with agencies that would be willing to more fully integrate the IMRCP models with their TMC systems and operations. These opportunities would then identify specific weather-responsive management goals and strategies to be considered in their operations. Traffic, weather, hydrological, work zone, and other operations data sources would then be identified and acquired to support those particular goals and strategies. Models and interfaces could then be tailored to support implementation in those settings and with those users. 10 USDOT, Integrated Modeling for Road Condition Prediction Installation and Administration Guide, FHWA-JPO-18-746 (October 2019). [ Return to note 10. ] 11 USDOT, Integrated Modeling for Road Condition Prediction Installation and Administration Guide. [ Return to note 11. ] 12 “Explore ITS CodeHub,” USDOT Intelligent Transportation Systems Joint Program Office (ITS–JPO), accessed June 8, 2020, https://its.dot.gov/code/. [ Return to note 12. ] 13 Travel time predictions are available for only a limited set of routes in the demonstration Kansas City deployment. [ Return to note 13. ] |
|
United States Department of Transportation - Federal Highway Administration |
||