Implementation of Analysis, Modeling, and Simulation Tools for Road Weather Connected Vehicle Applications (Flyer)Printable version [PDF 732 KB]Contact Information: Operations Feedback at OperationsFeedback@dot.gov  FHWA-HOP-20-059 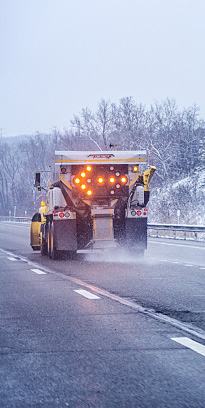
Source: Getty Images IntroductionWeather-responsive management strategies (WRMS) help transportation agencies manage and operate their system in challenging road weather conditions. Antiicing, plow routing, variable speed limits (VSL), and variable message signs (VMS) are examples of WRMS. Effective WRMS require sufficient information on traffic and weather conditions and development of infrastructure and systems to support implementing the chosen strategies. Federal Highway Administration’s (FHWA) Road Weather Management Program (RWMP) has worked to advance WRMS in programs directed at fixed sensor and connected vehicle (CV) data collection, strategy development, decision support systems, and agency implementation support. In addition, analysis, modeling, and simulation (AMS) tools have been used by FHWA and agencies to assess the effectiveness of these data sets, strategies, and methods in improving the operational response. This project evaluated existing AMS tools and researched agencies that use or plan to use CV data for WRMS and want to evaluate their existing and enhanced practices. Site recommendations depended on the availability of CV data, WRMS in use, and calibrated AMS tools for those sites. Agencies and sites considered for this effort were currently implementing weather-responsive management strategies, collecting CV or mobile data, and using or interested in using an AMS tool for evaluation. AMS tools must also be applicable to the particular strategies and fully implementable on the agency’s transportation network. Using these considerations, the RWMP partnered with Wyoming Department of Transportation (DOT), University of Wyoming, and City of Chicago DOT. This flyer summarizes these case studies and results.1 Wyoming Case StudyPartners: Wyoming DOT and University of Wyoming LocationThe study network is a portion of the Wyoming CV Pilot corridor on I–80. To improve driver safety along the corridor, the Wyoming connected vehicle pilot (CVP) uses dedicated short-range communication-based (DSRC) applications that leverage vehicle-to-vehicle (V2V) and vehicle-to-infrastructure (V2I) connectivity to support a flexible range of services, such as advisories, roadside alerts, and dynamic travel guidance, for freight and passenger travel. 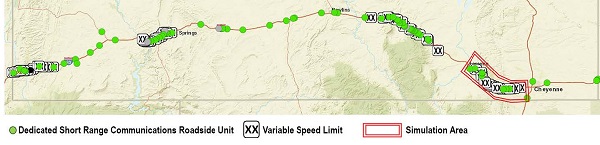
Source: Wyoming Department of Transportation Map shows an east-west highway with dedicated short-range communications roadside units along the road and variable speed limits postd where more roadside units exist. THe simulation area is indicated at the eastern portion of the highway, just west of Cheyenne.
WRMS EvaluatedThe Wyoming case study evaluates three CV-enabled WRMS, including traveler information messages (TIM), CV-based VSL, and snowplow pre-positioning along the 402-mile I–80 corridor through the southern part of the State. AMS ToolsThe three WRMS are evaluated using a framework consisting of a Vissim® Network module, a Simulation Manager module, and an application programming interface (API) module that determines driver behavior under the CV application scenarios. Vissim Network is the underlying transportation network used for testing a large variety of CV algorithms. The Simulation Manager allows users to easily adjust control parameter values crucial for the implementation of CV applications in Vissim. Vissim passes the current state of a vehicle and its surrounding traffic to the API module, which computes and determines the succeeding behavior of the vehicle as specified by an algorithm, and then passes the updated state of the vehicle back to Vissim. Results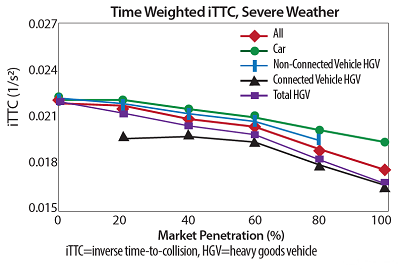
Source: FHWA Graph shows Time Weighted iTTC, Severe Weather. All, Car, Non-Connected Vehicle HGV, Connected Vehicle HGV, and Total HGV are all indicated by iTTC on the Y-axis and market penetration on the x-axis. For all lines, as market penetration grows, iTTC decreases.
The study demonstrated in the simulations that CV-based WRMS applications can improve traffic safety performance, as measured by inverse time-to-collision (iTTC). The effectiveness is most dramatic under severe weather conditions. TIM can help improve the safety performance of the traffic system by reducing the risk of collisions and the occurrence of pile-up crashes near the lane-closure event zones. VSL can provide suitable speed limit advisories under different weather scenarios to keep vehicles and the entire traffic flow, including non-CVs, driving at safe speeds. Snowplow pre-positioning is an effective strategy for winter surface maintenance that helps to improve operation efficiency, reduce collision risks, and increase the mobility efficiency of the traffic system. As shown in Figure 2, across all three applications, connected trucks, even at relatively low CV market penetration rates, are able to smooth the entire traffic stream, including unconnected trucks and cars, and therefore improve safety under different CV market penetration rates and weather conditions. Next Steps / Agency PerspectiveThe developed tool can be used in the future to generate an initial set of transportation management center (TMC) playbook strategies for tactical and strategic decision making under different weather or traffic scenarios. The AMS model can be continuously improved as more data become available. Calibrating driver behavior parameter sets for different categories of weather conditions is essential for evaluating additional WRMS applications and even real-time implementation of the AMS tool in the TMC. These improvements and calibrations can be similarly beneficial in assessing maintenance operations strategies. Chicago Case StudyPartner: City of Chicago DOT Location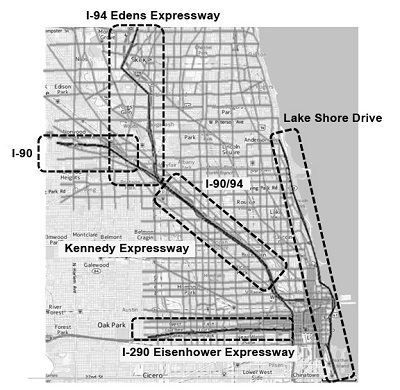
Original Map: 2017 Google Maps. Map overlay: FHWA. Map shows Chicago and testbed locations. Starting in the north, locations are I-94 Edens Expressway, I-90 in the northwest, Lakeshore Drive along the eastern bounds of the city, I-90/94 Kennedy Expressway in the middle of the city, and I-290 Eisenhower Expressway in the south part of the city.
The Chicago testbed network spans the Chicago Loop, O’Hare airport, and Evanston, Illinois, and includes the Kennedy Expressway on I–90, Edens Expressway on I–94, Dwight D. Eisenhower Expressway on I–290, and Lakeshore Drive along Lake Michigan. WRMS EvaluatedThe Chicago case study assesses the potential of using CV data for estimation and prediction to support optimizing snowplow routing to reduce impacts on traffic flow. AMS ToolsThe snowplow routing optimization application was assessed using the DYNASMART AMS capabilities with additional modules developed to estimate and predict conditions and capacities of road sections affected by snow accumulation. The network traffic states are estimated and predicted by processing data from simulated CVs operating throughout the network. The Snowplow Command module then uses the information to generate snowplow routes to minimize the weather impact on traffic. Performance of weather-related strategies was quantitatively evaluated with measurements of traffic speed and flow on the network. The performance measures were compared to the results under the two scenarios of 1) doing nothing and 2) executing a predetermined plan extracted from global positioning system (GPS) data for simulated snowplow routes. ResultsThe study demonstrated the value and effectiveness of CV data to accurately estimate traffic conditions at CV market penetration rates as low as 5 percent—enabling dynamic predictive interventions to improve flow conditions under snow conditions. Results support the potential benefit of two different types of CV technology in WRMS practice. The traffic estimation results verify that data from passenger vehicles with connectivity can be a great source of timely disaggregated information on traffic conditions even with low market penetration rates. Also, local agencies can monitor the current WRMS performance by tracking connected vehicles, estimate road surface condition with the executed service plan, and generate real-time service plans for remaining road sections by utilizing incoming information to maximize the WRMS performance. Next Steps / Agency PerspectiveChicago DOT was interested in the potential of CV data for the large portions of the arterial and street network for which fixed road sensors have not been deployed. Trajectory data from connected vehicles presently available through third parties may provide a near-term opportunity to leverage CV data for traffic management. The agency was also interested in the potential role of a unified data platform to provide a collaborative environment that brings together WRMS functions that may be presently addressed by different entities or organizations. SEVERE CAPACITY REDUCTION 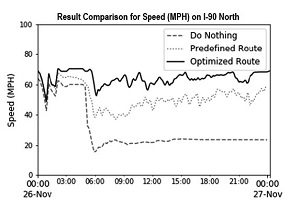
4a. Graph. Traffic speed results on I–90 North with severe capacity reduction scenario. Graph shows Result Comparison for Speed (MPH) on I-90 North. Speed in MPH is shown on y-axis and time on x-axis. Lines show do nothing, predefined route, and optimized route. While all lines start around 70 mph at midnight, do noting drops to 20 mph by 6 AM, prdefined route drops to around 40 mph by 6 AM, and optimized route only drops to 60 mph at 6 AM. All three lines generally stay around that speed for the remainder of the day..
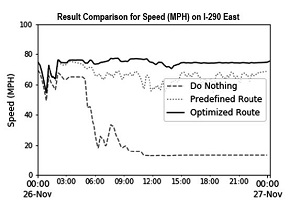
4b. Graph. Traffic speed results on I–290 East with severe capacity reduction scenario. Graph shows Result Comparison for Speed (MPH) on I-290 East. Speed in MPH is shown on y-axis and time on x-axis. Lines show do nothing, predefined route, and optimized route. While all lines start around 75 mph at midnight, do noting drops to 20 mph by 6 AM, spikes to 30 mph right before 9 AM, then drops to 15 mph by noon and stays there for the rest of the day. Predefined route slowly declines to 70 mph by 6 AM and overs around 60 to 70 mph throughout the day. Optimized route jumps up to 80 mph by 6 AM and stays around there the rest of the day.
MODERATE CAPACITY REDUCTION 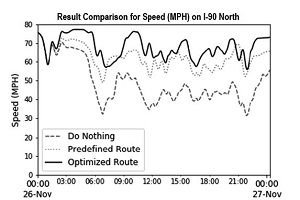
4c. Graph. Traffic speed results on I–90 North with moderate capacity reduction scenario. Graph shows Result Comparison for Speed (MPH) on I-90 North. Speed in MPH is shown on y-axis and time on x-axis. Lines show do nothing, predefined route, and optimized route. While all lines start around 75 mph at midnight, do noting drops to 30 mph by 6 AM, with peaks to 50 mph at 9 AM and midnight the next morning. Predefined route drops to 50 mph at 6 AM, then fluctuates between 50 and 60 mph the rest of the day. Optimized route drops briefly to 60 mph at 1 AM, then goes back to 75 mph by 3 AM, fluctuating between 60 and 75 mph throughout the day.
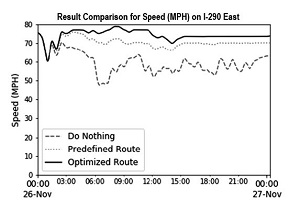
4d. Graph. Traffic speed results on I–290 East with moderate capacity reduction scenario. Graph shows Result Comparison for Speed (MPH) on I-290 East. Speed in MPH is shown on y-axis and time on x-axis. Lines show do nothing, predefined route, and optimized route. While all lines start around 75 mph at midnight, do noting drops to 50 mph by 6 AM, then fluctuates between 50 and 60 mph throughout the day. Predefined route drops between midnight and 3 AM, but generally stays around 70 mph throughout the day. Optimized Route quickly drops between midnight and 3 AM to 60 mph, but stays around 70 to 75 mph thorughout the day.
Source: FHWA The U.S. Government does not endorse products or manufacturers. Trademarks or manufacturers’ names appear in this publication only because they are considered essential to the objective of the document. For additional information, please contact 1 For complete study information, see Implementation of Analysis, Modeling, and Simulation Tools for Road Weather Connected Vehicle Applications Project Report, FHWA-HOP-20-060. [ Return to note 1. ] |
|
United States Department of Transportation - Federal Highway Administration |
||