Leveraging Road Weather Data for Performance Management Dashboards and ReportsPrintable version [PDF 1.4 MB]
U.S. Department of Transportation FHWA-HOP-20-051 WEATHER-RESPONSIVE MANAGEMENT STRATEGIES FACT SHEET BackgroundThe Weather-Responsive Management Strategies (WRMS) initiative under the Federal Highway Administration (FHWA) Every Day Counts—Round 5 (EDC-5) program promotes the use of road weather data from mobile and connected vehicle (CV) technologies to support traffic and maintenance management strategies during inclement weather. Performance management is an important WRMS application. Many agencies generate performance measures with traditional data sources. As defined by FHWA,1 "performance measurement is the use of evidence to determine progress toward specific defined organizational objectives," and includes both quantitative data and qualitative information. Data management tools can use road weather data from mobile and CV technologies to enhance existing performance measures and improve how agencies manage the performance of their road weather operations and maintenance activities. This fact sheet provides an overview of how agencies may leverage road weather data to develop and improve performance measures for enhanced storm management and performance management dashboards. Performance ManagementAvailable Resources FHWA's EDC-5 WRMS Resource Toolkit: https://collaboration.fhwa.dot.gov/dot/fhwa/RWMX/SiteAssets/WRMS/home.aspx Performance management enables agencies to better guide investments and measure progress by utilizing historic and real-time data, as well as forecasted information. It also enables agencies to adjust, where necessary, to improve operational performance. By adopting performance management principles, agencies can better implement weather-responsive management strategies for improved effectiveness. Defining Road Weather Performance NeedsKey Questions
Agencies may use performance measures to assess benefits of new practices or processes, justify funding, and improve public understanding. The first step in performance management is to identify agency needs based on the type of service and level of service an agency is providing. In the case of road weather management, this refers to the strategies for mitigating the impacts of an adverse road weather event before, during, and after it occurs. Agencies may need to measure performance for a variety of reasons, such as:
Effective performance measures align with an organization's goals and objectives. Transportation agencies may consider developing road weather measures to examine for different parts of the transportation network. These could be measures exclusive to freeways or all State-maintained roadways, or at different levels (e.g., statewide, District level, or garage level). For instance, a detailed measure of time to bare pavement may be challenging to make for all State-maintained roadways, and thus may be generated only for freeways. A measure of material usage and winter event severity during a season may be generated at a garage level or District level, and then aggregated to also provide a statewide measure to compare year over year. The following are a variety of available resources for agencies looking to develop robust road weather performance measures, based on needs and what has proven effective for other agencies. Performance Measures in Snow and Ice Control Operations.2 The document examines existing snow and ice performance measures and guides agencies toward development of effective performance measures, as well as tools and materials to support performance assessment. 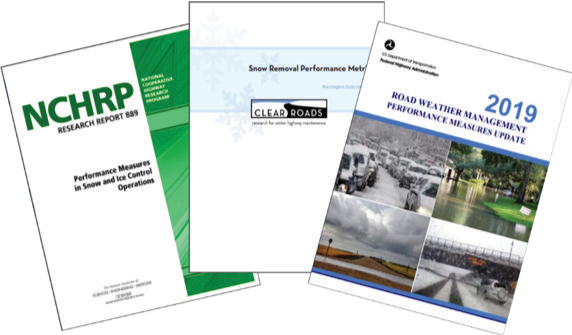
Figure 1. Resources for developing road weather performance measures. (Source: FHWA) Snow Removal Performance Metrics.3 The project examines the commonalities, differences, and relative costs of the various measures. The resulting report identifies effective performance metrics for snow and ice maintenance operations. It also presents findings from a survey of 35 States, 4 local agencies, and 10 European and Canadian agencies about their use of performance measures. 2019 Road Weather Management Performance Measures Update.4 A biennial effort, this document provides an overview of performance measure trends based largely on survey responses from 39 States. Key Questions
Considerations for Data CollectionIt is likely that many agencies are already collecting data that may be leveraged for road weather performance measures. Agencies may use weather data from road weather information systems (RWIS), National Weather Service (NWS), condition reports, and purchases of salt and material for winter maintenance. In addition to these traditional sources, agencies can also use mobile data from fleet vehicles or CVs for applications like performance measurement. In some cases, existing performance measures could be refined to focus on road weather events. Data from speed detectors, third-party mobility data, incident logs, crash reports, and fatality data may be available to generate mobility and safety measures during adverse road weather events. For example, agencies can fuse safety performance measures using crash and fatality data with data from RWIS and NWS. Agencies can also examine that data for the winter months to form a direct or indirect performance measure for winter safety. Additionally, agencies may use private- sector data sources and national data sets like the National Performance Management Research Data Set (NPMRDS) to supplement available agency data. In some cases, agencies may be challenged to generate new or effective performance measures from available data. This may be due to several factors:
Considering the available historical data, agency practitioners may consider making changes to business practices to collect and store data in a different manner. Agencies may also collect new data to support the development of performance measures. It should be noted that performance measures have added value when consistently reported year over year in order to make comparisons; while there is value in modifying performance measures as new or better data becomes available, this may impact the agency's ability to accurately determine whether agency performance is improving over time. Development of Road Weather Performance IndicesOne critical aspect for generating road weather performance measures is developing a method to normalize data based on the severity of road weather events. This helps the agency understand whether the performance has changed, or if the change is a result of more severe (or more mild) weather events. Many agencies may internally generate and use a weather severity index (WSI) or storm severity index (SSI). However, a variety of external resources and third-party information, including those listed below, are also available to use or inform the development of a WSI or SSI. Accumulated Winter Season Severity Index (AWSSI)®.5 Developed by the Midwestern Regional Climate Center and depicted in Figure 2, this WSI uses nonproprietary data from the National Oceanic and Atmospheric Administration (NOAA) to provide a national-level perspective, as well as a State and point-location analysis of weather severity. The number of data points available in each State is variable. Thus, practitioners should investigate data before choosing to adopt this performance index. Users of the tool include New York State and Montana. Road AWSSI (RAWSSI)®. Expanding on the AWSSI® tool, Clear Roads created the RAWSSI calculation. The tool enhances analysis by accounting for roadway conditions. Specifically, RAWSSI considers the temperature and snowfall for the day, and was found to slightly better correlate with operations data. 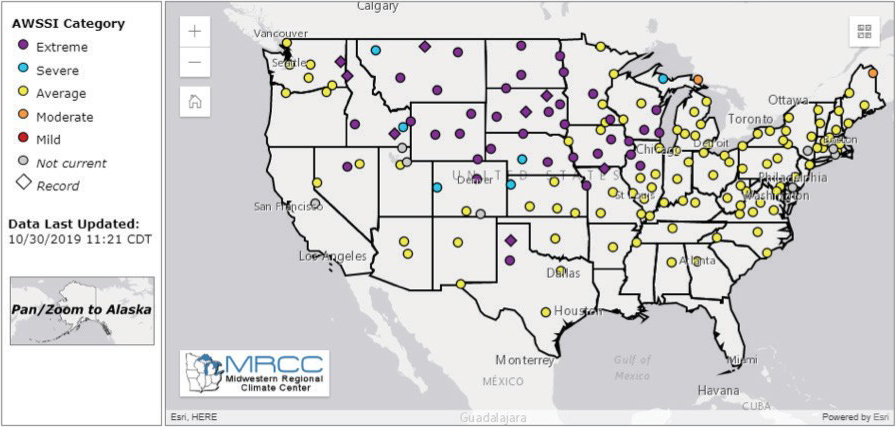
Figure 2. Screen shot of AWSSI showing weather severity from October 30, 2019 Mesonet-Based Performance Indices.6 The Mesonet is a large-scale weather monitoring network managed by the NWS. It allows for mesoscale observations and forecasting, ranging from a hurricane event in New York to tornados in Oklahoma, using 1,000 meteorological stations across the country. In New York State, the University of Albany manages Mesonet data from 126 stations across the State and is working with the New York State DOT to develop weather severity indices and a performance management tool that provides greater resolution than the AWSSI/RAWSSI network.7 Maintenance Decision Support System (MDSS) Severity Indices.8 A number of States use an MDSS to make better winter maintenance decisions regarding the timing and material to apply on roadways based on current and forecast road weather conditions. This tool is available as a web application called WebMDSS, and now provides a weather severity analysis. Data Usage, Application, and SharingAgencies may consider processing data to support public-facing or internal dashboards on performance, material usage, costs, or savings; return on investment analyses; internal determination of resource allocation; or other reports. Some measures may be helpful to provide accountability to the public or legislators, while others may better serve decision makers at the agency or be used to justify additional funding. Additionally, some measures may be useful for both internal purposes and the public. Key Questions
Several State DOTs assimilate road weather information for display on Performance Management Dashboards or to develop performance management reports. Below are examples of some that are provided for public use, and others that are intended only for internal consumption. Idaho Transportation Department Dashboard.9 An annual average measure of percentage of time highways are clear of snow and ice during winter storms is compared against a goal to maintain at least 73 percent unimpeded mobility. Iowa DOT Performance Dashboard.10 Winter operations measures include the average time roadways are returned to normal surface conditions for each of three maintenance service levels that are designated based on the roadway type. The webpage provides current and historic averages of weather measures, like WSI and salt use, reported bi-weekly through the winter season, as well as annual historic measures of weather (e.g., WSI, snowfall quantity, snow events) and costs (e.g., labor, equipment, material). Minnesota DOT (MnDOT) Performance Reports and Performance Dashboard.11 MnDOT now uses a performance dashboard to provide information on the percentage frequency for meeting the bare lane target of 70 percent, which is a number of hours based on traffic volumes for the roadways during the winter season. The dashboard also reports actual salt use, actual versus optimal salt use, and WSI for each season. Previously, MnDOT published this information as part of an annual transportation scorecard and performance report. Missouri DOT Tracker.12 This quarterly report is available online and includes a section for Winter Storm Operations that tracks:
Wisconsin DOT Annual Winter Maintenance Report and Mobility, Accountability, Preservation, Safety, Service (MAPSS) Program.13 An annual winter maintenance report includes a variety of measures for each winter season to compare year to year performance, including information about weather conditions, cost and quantity of materials, labor hours, average crew reaction time, and assets. Additionally, the MAPSS Performance Improvement Report includes an annual mobility measure for winter response. It tracks WSI and percentage of time that bare-wet condition goals are met after a winter weather event for roads maintained 24 hours per day and 18 hours per day. These roads are to be cleared within 4 and 6 hours after the end of the storm, respectively, 70 percent of the time. ConclusionAgencies already collect a variety of road weather data from traditional sources. Data from mobile and CV sources offer agencies an even richer data set to leverage for WRMS applications, such as performance management. Road weather performance measures developed from this data may vary in complexity based on the quality of available data and resources to collect and analyze the data. Calculated performance measures can be published for internal use or public consumption to provide a year-over-year comparison of agency costs and performance in road weather operations, and to feature improvements and justify additional investment.
For additional information, please contact: David Johnson 1 More information available at: https://ops.fhwa.dot.gov/perf_measurement/index.htm [ Return to Note 1 ] 2 National Cooperative Highway Research Program (NCHRP), Research Report 889. Transportation Research Board (TRB). 2019. Available at: http://www.trb.org/NCHRP/Blurbs/178901.aspx [ Return to Note 2 ] 3 Clear Roads Pooled Fund Study, Report CR 14-05. 2017. Available at: http://clearroads.org/wp-content/uploads/dlm_uploads/FR_CR.14-05_Final.pdf [ Return to Note 3 ] 4 FHWA, Report FHWA-HOP-19-089. 2019. Available at: https://ops.fhwa.dot.gov/publications/fhwahop19089/fhwahop19089.pdf [ Return to Note 4 ] 5 More information is available at: https://mrcc.illinois.edu/gismaps/awssi.htm, https://mrcc.illinois.edu/research/awssi/indexAwssi.jsp and https://clearroads.org/project/16-02 [ Return to Note 5 ] 6 More information is available at: www.Mesonet.org and https://wxobservation.com/mesonet-stations [ Return to Note 6 ] 7 ore information available at: http://www.nysmesonet.org [ Return to Note 7 ] 8 More information available at: https://mdss.iteris.com/mdss/pfs [ Return to Note 8 ] 9 More information available at: https://apps.itd.idaho.gov/Apps/Dashboard [ Return to Note 9 ] 10 More information available at: https://iowadot.gov/performance/winter-operations#22611382-weatherbr-severity [ Return to Note 10 ] 11 Performance reports available at: https://www.dot.state.mn.us/measures and Performance Dashboard available at: https://performance.minnesotago.org [ Return to Note 11 ] 12 Winter operations performance measures were Section 4f for 4th quarter 2019. Available at: https://www.modot.org/winter-storm-operations-4f [ Return to Note 12 ] 13 Annual Winter Maintenance Reports and related information available at: https://wisconsindot.gov/Pages/doing-bus/local-gov/hwy-mnt/winter-maintenance/default.aspx; MAPSS Performance Improvement Program information available at: www.mapss.wi.gov [ Return to Note 13 ] |
|
United States Department of Transportation - Federal Highway Administration |
||