Weather-Responsive Management Strategies for Traveler Information During Flood EventsPrintable version [PDF 2.5 MB]
U.S. Department of Transportation FHWA-HOP-20-045 WEATHER-RESPONSIVE MANAGEMENT STRATEGIES FACT SHEET BackgroundThe Weather-Responsive Management Strategies (WRMS) initiative under the Federal Highway Administration (FHWA) Every Day Counts – Round 5 (EDC-5) program promotes the use of road weather data from mobile and connected vehicle (CV) technologies to support traffic and maintenance management strategies during inclement weather. The goal is to improve safety and reliability, as well as to reduce environmental impacts on the transportation system resulting from adverse weather. WRMS can mitigate the impact of major flooding events through preparation and prediction efforts that leverage and build data, tools, and relationships. As a result, agencies are better equipped for response and recovery efforts, including improved traveler information. While experience with major flood events increases Department of Transportation (DOT) staff's understanding of how to assess and respond to flood risks, flood-related WRMS enable DOT staff to better understand the consequences of specific stream gauge readings, what the impacts will be and where, who to talk to, what resources are available, and new tools and next steps required to advance practices. Traveler information is an especially valuable tool during major flood events because of how extensive and prolonged the impacts from such events can be. This fact sheet provides an overview of traveler information strategies based on lessons learned and experiences from Iowa DOT, Missouri DOT, Nebraska DOT, North Carolina DOT, and Houston TranStar while managing flood events that had significant and prolonged impacts and road closures. Traveler Information MapsMajor flooding is often an extended-duration event that results in a different response to support traveler information needs than agencies may be accustomed to. Through their flood experiences, Iowa DOT, Missouri DOT, and Houston TranStar have all realized the need to modify their traveler information maps to provide better flood-related information. Agency staff should keep in mind that a major event is likely to generate a variety of traveler information-related requests from managers, other agencies, and even the governor's office. However, it is important for traveler information managers to consider implications to broader agency operations before making changes in traveler information websites for these requests. For example, instead of providing county and local agency information directly on its 511 website, Iowa DOT provided links to those websites, as this was a more sustainable approach for staff. Several enhancements and modifications to traveler information maps as a result of major flood events are described below. Visually Streamlining Flood Impact GraphicsDuring a major flood event in 2019, Iowa DOT realized that the traditional closure icons on its 511 traveler information map did not show the impact of closures in a way that the public could easily understand. As such, Iowa DOT worked with their traveler information systems vendor to more clearly display a full lane closure, in one or both directions, by adding a painted line over the roadway, in addition to the traditional incident icon ( In an effort to reduce confusion and eliminate clutter on its 511 website, Iowa DOT had previously implemented icon clustering. However, as a response to the 2019 flood, events considered "high priority" are removed from the clusters to ensure that they stand out. High priority events include unplanned events, such as flooding, and are depicted by the emphasized icons ( Visually Streamlining Flood Impact Graphics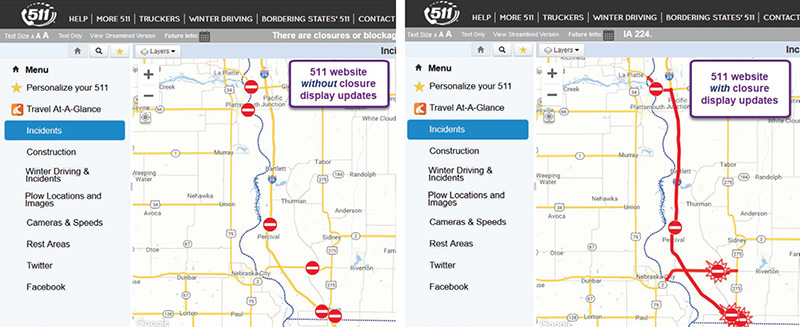 Figure 1. Iowa DOT changed how closures were displayed on the 511 website during a major flood in 2019. The original view (left) was enhanced with painted red lines to show the extent of the closure and the use of emphasized icons designates a high priority event (right).
Figure 1. Iowa DOT changed how closures were displayed on the 511 website during a major flood in 2019. The original view (left) was enhanced with painted lines to show the extent of the closure and the emphasis on icons designates a high priority event. (Photo Source: Iowa DOT). Planned Versus Unplanned EventsIowa DOT distinguishes incidents from construction activities on 511 as unplanned and planned events, respectively. As a result, all flood-related events are labeled as incident events in 511 to be distinct from construction events. Algorithms in the road condition reporting system automatically insert an event on the "incident" or "construction" layer based on the phrase used by the Transportation Management Center (TMC) operators for an event, traffic impact, or cause (e.g., flooding or emergency repairs). This allows phrases to be filtered so that accurate results are displayed when a system query is made. As emergency repairs necessitate lane closures, this phrasing causes the event to appear in the correct category as a flood-related incident event, rather than a construction event, when providing flood-related information to the traveling public. 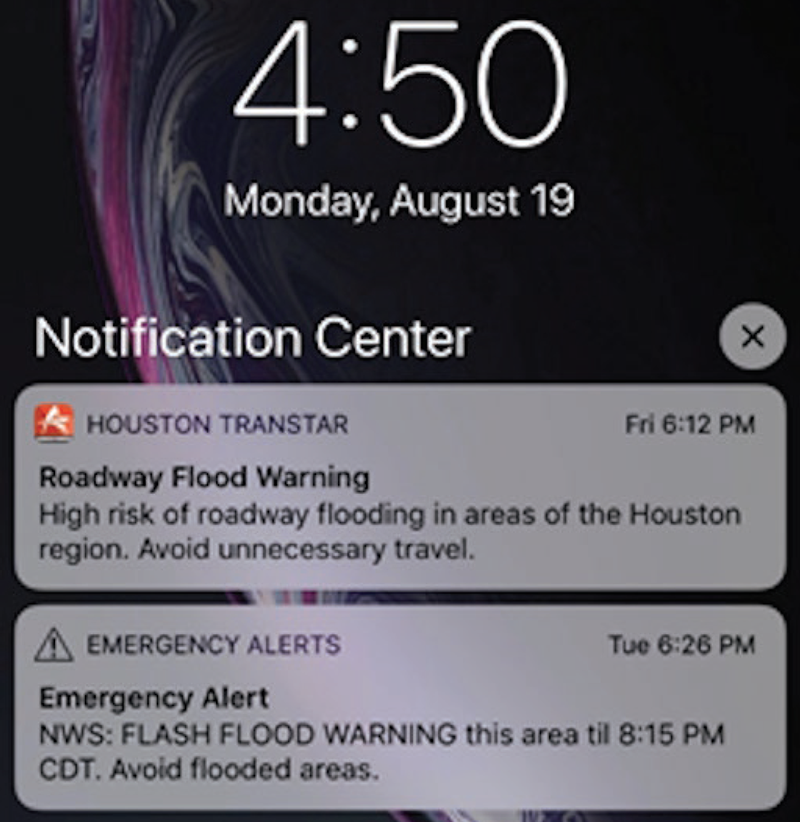 Figure 2. Houston TranStar information generates push notifications for subscribed travelers when flooding thresholds are met in the area. (Photo Source: Houston TranStar). Threshold NotificationsAfter Hurricane Harvey caused major flooding in the Houston area in 2017, the regional TMC – Houston TranStar – recognized that there was good camera-verified information for flooded freeways and frontage roads, but little information on flooded roads without camera coverage. In response, Houston TranStar coordinated with agency partners to integrate data from 170 flood sensors around the region and create thresholds for rainfall rates and stream levels that would trigger warnings to travelers to exercise caution and avoid travel in areas where flooding was likely. Specifically, one inch of rainfall in 15 minutes or a stream overflowing its banks will generate push notifications to subscribed users based on their location, as shown in Figure 2, and special icons on the traveler information map, as depicted in Figure 3. 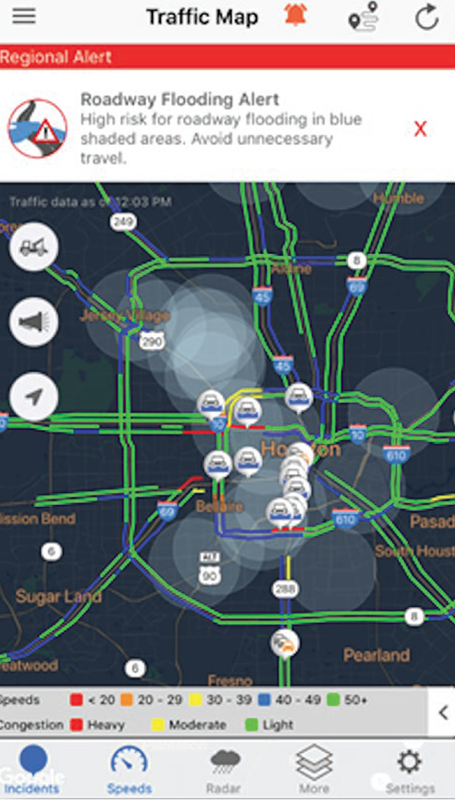
Figure 3. The Houston TranStar traveler information map displays blue shading in a three-mile radius around all affected flood sensors where a threshold is exceeded. (Photo Source: Houston TranStar). Providing Information for Third-Party Navigation and Mapping ProvidersThird-party navigation and mapping providers reference DOT traveler information maps for flooding information. To ensure accurate information is provided to travelers, DOT may need to develop policies or modify how information is presented on the DOT traveler information map. In 2019, long segments of I-29 in Missouri and Iowa were closed due to major flooding. It was expected that the way these closures were logged and displayed could result in traffic being diverted around the initial point of the highway closure to intermediate closed sections of I-29 or to lower-volume roads, many of which were also closed. To help eliminate this confusion regarding the closure, DOT staff manually marked both the route and all on-ramps along the route as "Closed" on the agency traveler information maps, where flood-related closures and information are provided. As a result, the third-party navigation and mapping providers received the information and travelers were not routed onto the closed highway. The North Carolina DOT experienced flooding during Hurricane Matthew in 2016 that caused I-95 to be closed. Even though the State Highway Patrol would alert drivers that the highway was closed, the same drivers would return noting that their navigation applications were routing them to this location. Realizing the need to better connect with other traveler information providers, North Carolina DOT now maintains points of contact for third-party navigation and mapping provider staff who specifically focus on incident and traffic, mapping, and navigation and routing issues. Additionally, NCDOT became a Waze Connected Citizen Program (CCP) member. During Hurricane Florence, in 2018, there were 2,574 road closures in North Carolina, with such bad and volatile conditions that a "no-drive zone" was implemented for three days across a large, impacted area in the southern and eastern parts of the state. Despite efforts to coordinate with navigation providers, the DOT still had to issue a message to travelers about the "no drive zone" to say, "Do not trust your GPS." The DOT continues to foster relationships with third-party navigation and mapping providers to ensure travelers receive accurate information. North Carolina DOT has developed procedures for updating or correcting digital maps, including those from third-party navigation and mapping providers. Specific to flooding, DOT staff must first enter all temporary road closures in the North Carolina DOT traveler information website, DriveNC.gov. If information is available on this website but not from a third-party provider, the DOT State Traveler Information Engineer should be contacted as this individual maintains points of contact for third-party navigation and mapping provider staff. As issues arise, the NCDOT State Traveler Information Engineer follows a Standard Operating Procedure for troubleshooting that defines how incident information flows to the third-party navigation and mapping providers and how corrections can be initiated. 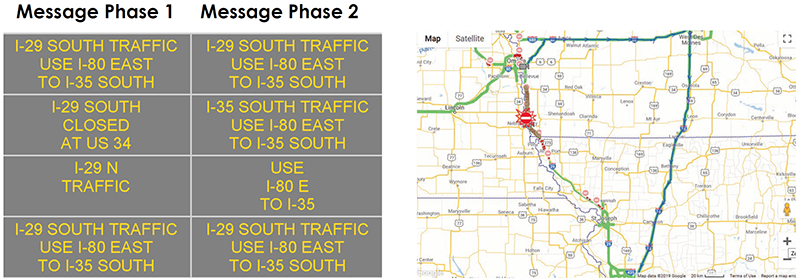 Figure 4. Examples of the various two-phase DMS messages the Iowa DOT used (left) to convey the I-29 detour caused by a flooding-related closure: I-29 South traffic use I-80 East to I-35 South (phase 1) and I-29 South traffic use I-80 East to I-35 South (phase 2); I-29 South closed at US 34 (phase 1) and I-35 South traffic use I-80 East to I-35 South (phase 2); I-29 N Traffic (phase 1) and Use I-80 E to I-35 (phase 2); and finally, I-29 South traffic use I-80 East to I-35 South (phase 1) and I-29 South traffic use I-80 East to I-35 South (phase 2). The I-29 detour caused by a flooding-related closure was also depicted on the 511 website (right) with an emphasized icon on the roadway map.
Figure 4. The Iowa DOT used a variety of two-phase DMS messages (left) to convey the I-29 detour caused by a flooding-related closure, which was also depicted on the 511 website (right).
Figure 4. Examples of the various two-phase DMS messages the Iowa DOT used (left) to convey the I-29 detour caused by a flooding-related closure: I-29 South traffic use I-80 East to I-35 South (phase 1) and I-29 South traffic use I-80 East to I-35 South (phase 2); I-29 South closed at US 34 (phase 1) and I-35 South traffic use I-80 East to I-35 South (phase 2); I-29 N Traffic (phase 1) and Use I-80 E to I-35 (phase 2); and finally, I-29 South traffic use I-80 East to I-35 South (phase 1) and I-29 South traffic use I-80 East to I-35 South (phase 2). The I-29 detour caused by a flooding-related closure was also depicted on the 511 website (right) with an emphasized icon on the roadway map.
Figure 4. The Iowa DOT used a variety of two-phase DMS messages (left) to convey the I-29 detour caused by a flooding-related closure, which was also depicted on the 511 website (right).
(Photo Source: Iowa DOT. Map Data ©2019 Google). Re-Routing MessagingRe-routing traffic is a major challenge for high-volume routes impacted by flooding, particularly interstate highways. In Missouri and Iowa, I-29 is a rural corridor, sometimes with 10 miles between exits and very limited lodging options for several hundred miles. Similar to winter weather closures, during the 2019 flood, the DOT understood the need to strategically close I-29 at a point where travelers had a place to go and also message far enough in advance to encourage alternate routes for through travelers. Extensive messaging was required to promote a global detour on I-35 and I-80 via Des Moines, which added six hours to the route, as shown in Figure 4. Messaging included permanent and portable dynamic message signs (DMS), social media, news releases, and updates to the 511 website. Missouri DOT coordinated messaging with the Kansas City TMC, referred to as Kansas City (KC) Scout, as well as trucking companies. One additional challenge noted by Missouri DOT was the staff time required to place portable DMS in sometimes remote areas and return to the portable DMS every time a message needed to be updated. Iowa DOT learned, during major flooding in 2011, the importance of providing consistent traveler information. During that major flood, communications staff manually created a map with flooding closures and detours. However, this map conflicted with what Iowa DOT was displaying on their 511 website, which confused travelers. Agencies need to provide consistent information to the public about the resources being referenced to ensure the greatest outreach and understanding. This lesson learned from the 2011 flood event informed the Iowa DOT response for improved coordination when developing and disseminating messaging for travelers for the 2019 flood event. Dedicated Event Website and OutreachAdditional tools may be needed beyond those that are normally available to inform the public about flooding resources and impacts. The Nebraska, Iowa, and Missouri DOT websites all had dedicated links to update the public on projects to repair and replace pavement and bridges impacted by flooding given the large number of travelers and citizens affected, physical extent of closures, and duration of the event impacts. Timelines for projects, names of contractors doing the work, and pictures of the damage and ongoing work were included. These websites were developed to anticipate questions from the public about recovery assistance, traveler impacts, and the status of the levee system. As an example, Iowa DOT partnered with the State of Iowa to create the single, "one-stop shop" website for particularly significant floods in 2011 and 2019, as shown in Figure 4. This website included:
To improve public safety, Iowa DOT posted flood-related videos and used a Flickr site for images to help reduce the number of people traveling to see the flooded areas. A popular page for commuters and citizens was the frequently updated "restoring the roadway" page. That page continued to be updated for months following the flood event to offer updates of repairs and road status given that many affected bridges were used for commuter traffic between states and many questions continued to be received from the public. A separate County Engineers Association 511 website was also available in Iowa as a resource for travelers interested in the status of county roads. Nebraska DOT similarly conducted extensive public outreach, including listening sessions, public meetings, and assigning district personnel to local communities and hard-hit areas. They also conducted multiple press conferences and utilized a dedicated website containing Geographic Information System (GIS) information about flooding that was updated daily. Missouri DOT places a major emphasis on customer service. Specifically, operators are staffed 24/7 to take calls from the traveling public to answer questions. As needed, calls are generally returned within several business days to ensure that customer needs are being met, which is reflected by a high measure of customer satisfaction. Finally, notifying the public about reopening a road involves internal coordination with law enforcement and other agencies. Iowa DOT specifically does not issue a press release until shortly before the re-opening (e.g., 15 minutes). This prevents queuing that occurs when information about an opening is provided too soon, which is exacerbated if the re-opening is delayed for any reason.  Figure 5. Website developed by Iowa DOT web team staff to compile all information related to the 2019 flood event in a single location for the State of Iowa: https://floods2019.iowa.gov. (Photo Source: Iowa DOT). 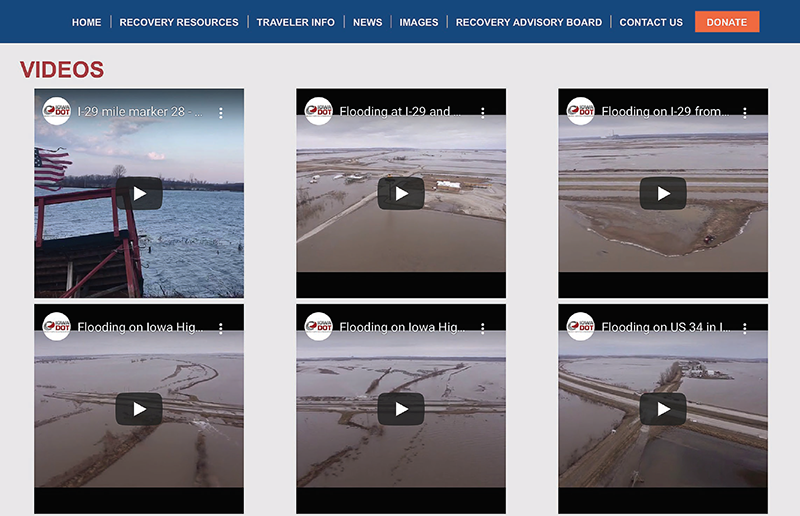 Figure 6. The Iowa DOT website for the 2019 flood event included a variety of videos for the public to see the extent of flooding and helped minimize the number of people traveling to see flood impacts: https://floods2019.iowa.gov/images.aspx. (Photo Source: Iowa DOT). ConclusionsTravelers need to be able to access a wide variety of resources during a major flood event, particularly details regarding closures and detours. Agency traveler information websites must provide consistent and accurate information that is easy for travelers to access and understand, and available for easy ingestion by third-party providers. Travelers may also benefit from being able to access additional information on a website or public meetings offered by the DOT. Available ResourcesFHWA's EDC-5 WRMS Resource Toolkit: Technical ContactsDavid Johnson Sinclair Stolle Tonya Lohman Michael Mattison Kelly Wells Valerie Taylor Ugonna Ughanze |
|
United States Department of Transportation - Federal Highway Administration |
||