RITIS: A Probe-data Source for Enhancing Operations and Planning Capabilities

Printable version [PDF 1.6 MB]
You may need the Adobe® Reader® to view the PDFs on this page.
U.S. Department of Transportation
Federal Highway Administration
Office of Operations
1200 New Jersey Avenue, SE
Washington, DC 20590
ops.fhwa.dot.gov

FHWA-HOP-20-044
September 2020
Monitoring before, during, and after work zone activities and enabling data-based strategies for work zone measures through archived data and real-time traffic and incident information.
Regional Integrated Transportation Information System
The Regional Integrated Transportation Information System (RITIS) is an automated fusion and archiving system of real-time traffic, incident, and weather data obtained from agencies and communicated through dashboards and visual analytic tools. RITIS is a product of the Center for Advanced Transportation Technology Laboratory (CATTLab) at the University of Maryland. Figure 1 illustrates the consolidation of various traffic data sources fused in RITIS and disseminated to public and private entities for mobility and safety applications.
RITIS has been successfully used by decision makers, researchers, planners, operations specialists, the military, and homeland security officials in every State. Agencies use the RITIS platform to make data-driven decisions to improve operations, safety, and emergency preparedness and sustain a reliable regional transportation system.
RITIS has three main components:
- Real-Time Data Feeds provide direct and real-time access to multiple data sources, including incident, detector, probe, weather, transit, TOC communications, and others.
- Real-Time Situational Awareness Tools provide access to a set of interactive visualization tools for dynamic and on- going network monitoring. Real-time transportation data are displayed on a dashboard along with traffic maps and live cameras.
- Archived Data Analysis Tools enable processing of data stored for long-term retention. Engineers can query events and analyze probe vehicle data from past hours, days, months, and years, because all RITIS data are archived immediately and retained indefinitely.
In addition to the transportation status monitoring system, RITIS provides access to the National Performance Management Research Data Set (NPMRDS). Through FHWA-facilitated free access to NPMRDS, State and local transportation agencies can access INRIX probe-vehicle data (lagging by 1 month) to analyze speed and travel time data.
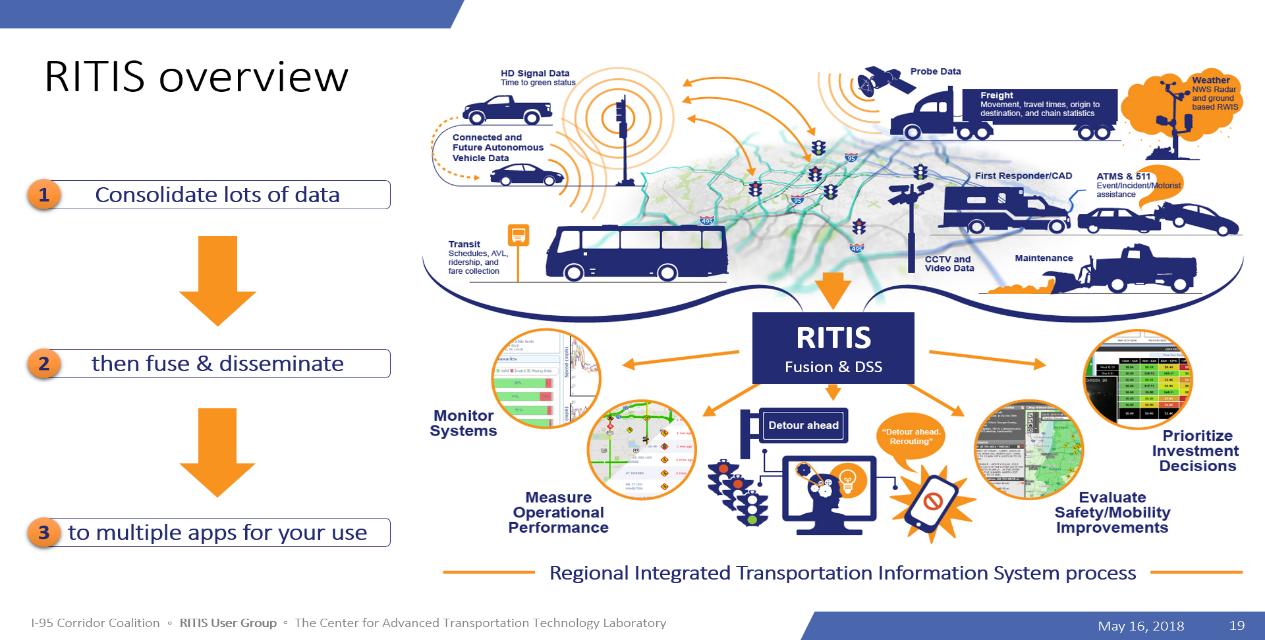
Figure 1. Regional Integrated Transportation Information System (RITIS) Overview
(Source: CATTLab)
Probe Data Analytics Suite
The Probe Data Analytics (PDA) Suite, available with a paid subscription, is a RITIS tool that offers customized dashboards for real-time operations, performance measures analysis, and visualization. Using these data visualization and retrieval tools, agencies can develop system performance summaries and trends, identify mobility problems and prioritize projects, conduct before and after studies, monitor work zone performance, and perform other analyses.
The PDA Suite enables agencies to use archived probe data joined with other agency transportation data to support operations, planning, analysis, research, and performance measures generation. It consists of a collection of data visualization and retrieval tools that allow users to download reports, visualize data on maps or in other interactive graphics, and download raw data for offline analysis.
In addition to data from the NPMRDS, the PDA Suite provides access to third-party probe data from INRIX, HERE, and Waze. GPS trajectory data are collected from a wide array of commercial vehicle fleets, connected cars, and mobile applications and are fused with other data from an agency to provide complete system performance analysis. The PDA Suite combines such data with State DOTs’ Advanced Traffic Management System platforms to build congestion scans and traffic trend analyses, travel time and reliability analyses, queue measurements, vehicle- and person-hours of delay, user delay costs (cost of time, fuel consumption, and emissions), congestion trend analysis, and much more. The PDA Suite can analyze probe data of various granularity and providers.
Work Zone Performance Monitoring Application Overview
The Work Zone Performance Monitoring Application (WZPMA) is a RITIS tool that enables analyses of RITIS data fused with an agency’s work zone information and the PDA Suite. Information from RITIS and probe-vehicle data are integrated with agency work zone data such as permit information, project information, and site details as they become available from State DOTs. Figure 2 depicts the compendium of probe- data and work zone information needed to perform real-time work zone performance monitoring.
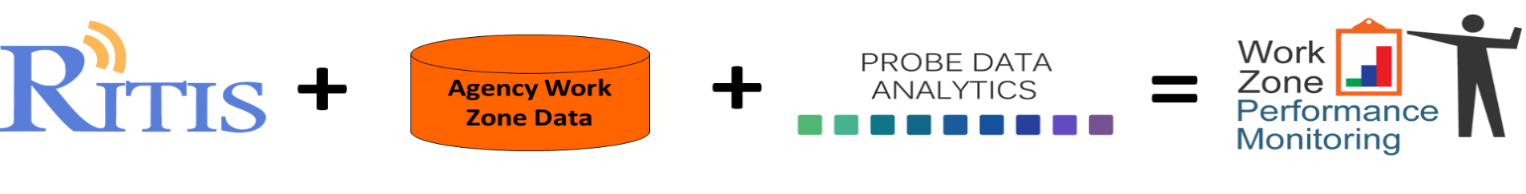
Figure 2. Components of the Work Zone Performance Monitoring Application
(Source: CATTLab)
Work Zone Performance Monitoring Application Features
The WZPMA was developed to assist agencies comply with requirements of the Final Rule on Work Zone Safety and Mobility. The application enables agencies to monitor work zone performances and facilitates efficient management and evaluation of work zone impacts throughout project development, implementation, and after action, resulting in improved overall processes and procedures. The WZPMA provides different types of information targeted to three different user groups:
- Project engineers and managers – provides real-time performance and alerts when performance thresholds are exceeded.
- Public relations staff – provides real-time and historic performances, as well as information needed to respond to complaints and inquiries.
- Planners and decision makers – provides estimates of lane closure costs and reviews previous performances.
The WZPMA has three features: 1) a dashboard that lists all work zones, 2) a profile for individual work zones, and 3) a notification system that alerts poor performances. The following sections describe these features in more detail.
Work Zone Dashboard
The dashboard provides an overview of all current work zones in a State under four interactive widgets:
- Current work zones are clustered based on their location.
- The top critical work zones with the most severe impacts, based on the magnitude of the queue lengths, delays, and user costs of the current work zones, are listed.
- Work zone locations are shown on an interactive map.
- User delay costs for the last full week are summarized for a select number of corridors in the State. The costs are calculated based on the proportion of passenger and commercial vehicles, adjusted average daily traffic volumes, speed reduction factors, and vehicle-hours of delay.
A typical work zone dashboard is shown in Figure 3.
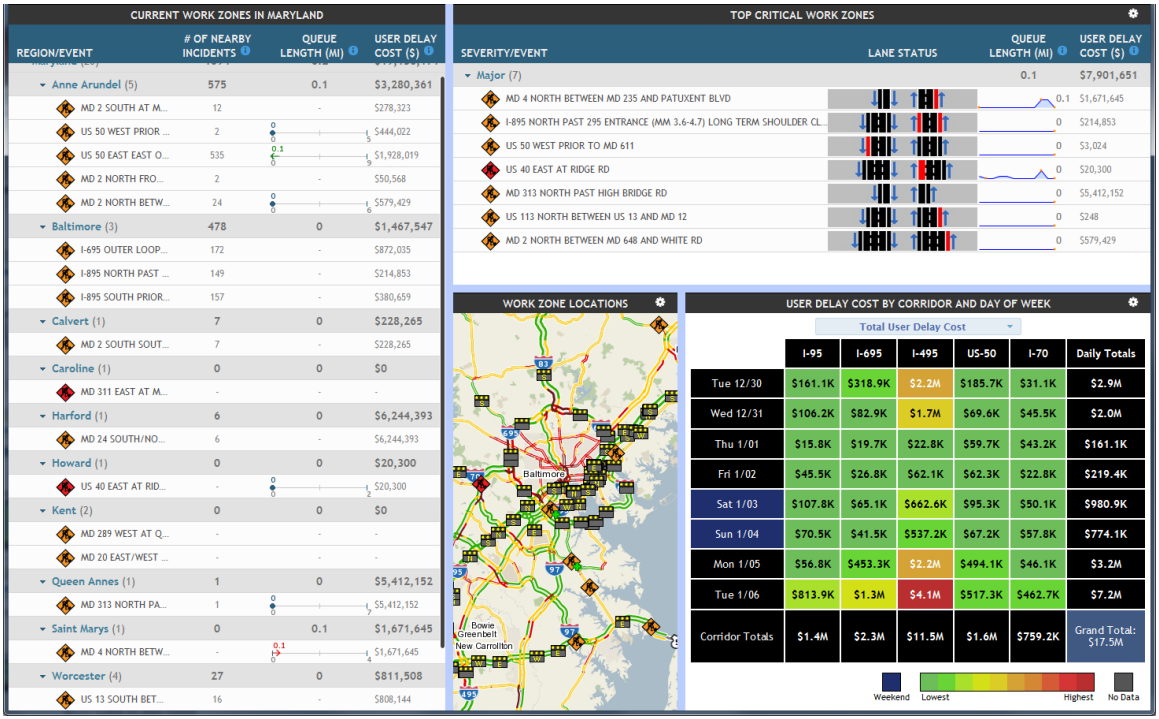
Figure 3. Work Zone Monitoring Application dashboard interface
(Source: CATTLab)
RITIS helps State DOTs monitor mobility impacts of work zones in real time
Project Prioritization. State DOTs quantify delays and queues attributed to lane closures and detours and summarize their associated monetary costs. These cost summaries are essential in prioritizing resources, supervising compliance with construction lane closure schedules, and adjusting traffic control plans.
System Performance Reporting. Project engineers and managers utilize multi-layered maps to conduct real-time travel time analyses of work zones based on current traffic conditions. Notifications are customized based on thresholds at selected roads. District and State engineers track traffic speed and delay thresholds based on any unexpected mobility and safety issues.
Problem Identification. By knowing where, when, and what is causing congestion in work zones, State DOTs optimize use of limited resources, increase effectiveness of mobility impact mitigating strategies, and provide a faster response to inquiries and complaints.
Work Zone Performance Monitoring. Performance assessment is crucial to identify improvement opportunities in data collection and processing procedures, as well as to mainstream traveler information and mitigate mobility impacts. State DOTs perform real-time analyses which are critical in establishing better public relations and developing training programs.
Individual Work Zone Profile
As opposed to the work zone dashboard that provides high- level information on all work zones in a State, the individual work zone profile presents detailed information on one work zone at a time. It compares current work zone performance with past performances by linking measured speed and travel times with lane closure status, current traffic, and infrastructure conditions (work zone boundaries, bottlenecks, posted speeds, nearby cameras, and nearby incidents). It also summarizes user costs of the individual work zone in four-hour time periods for the previous seven consecutive days. A sample of the individual work zone profile is shown in Figure 4. The individual work zone profile interface has five widgets: settings, current conditions, work zone performance measures, work zone location, and user cost summary.
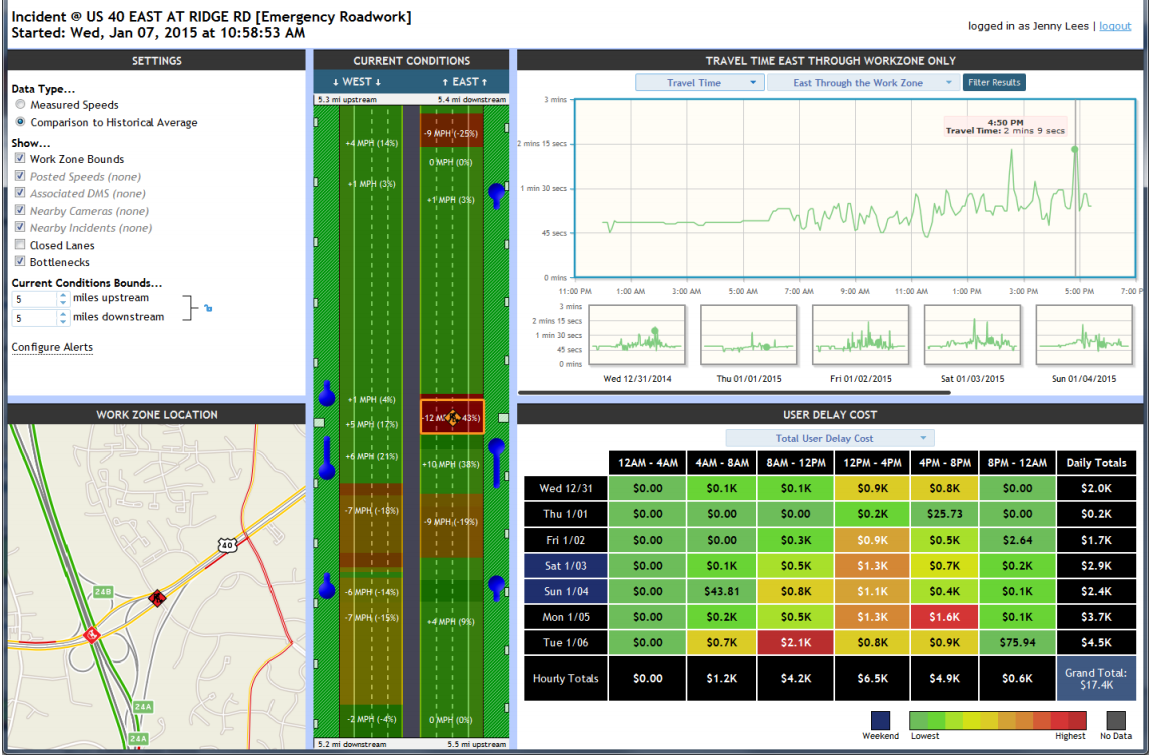
Figure 4. Individual work zone profile
interface (Source: CATTLab)
Work Zone Notifications
The WZPMA can automatically send alerts to work zone construction managers whenever pre-established mobility performance thresholds are exceeded for selected work zones. The alerts can be customized and delivered through text messages or email. Occurrence of incidents near work zones, long queues, excessive delays, and low travel speed are some factors that trigger alerts. Work zone alerts can be scheduled by time of day and by day of week. Instead of an agency staff member watching the work zone dashboards all day long in an attempt to identify mobility issues, the notification system provides a simple solution by generating automated alerts for a specified work zone during a specified time frame. The system also could be used to make operational and planning decisions, as well as help monitor the effectiveness and impacts of various countermeasure strategies in real-time.
The Work Zone Performance Monitoring Application in Action
Several State DOTs have used the WZPMA to evaluate the performance of their major work zones. Selected examples include:
- Georgia DOT evaluated the user cost and delay impacts of the I-85 Bridge Collapse in Atlanta, Georgia. User delay costs increased 20 percent ($2 Million) after the bridge collapsed and the evening rush started two to three hours sooner.
- Pennsylvania DOT estimated that the major two-billion- dollar reconstruction project along I-95 in Philadelphia caused a 20 percent to 45 percent increase in peak period travel time. The dynamic performance charts with a wide time range and metric display options were used to justify the deployment of extra transit rail cars to mitigate construction impact.
- North Carolina DOT estimated and reported the delays due to the pavement rehabilitation project on I-40/440, also known as Fortify. The agency reported daily travel time for 14 routes, and the data were used to inform stakeholders and the public about impacts to their commutes, alternate routes, and public transit.
Key Takeaways of RITIS and the Work Zone Performance Monitoring Application
- RITIS offers various analytics and tools that provide State DOTs with advanced capabilities to monitor network performance in less time and with better results. Through RITIS’s data-driven applications, agencies can rank bottlenecks, generate performance charts and summaries, perform congestion scans, and calculate user costs. RITIS benefits agencies in planning and managing operations, conducting long-range planning and capital programming, and providing traveler information.
- The WZPMA presents another strategic approach for State DOTs to measure mobility impacts of work zones. Fusion of existing data sources in RITIS with agency work zone information and probe-vehicle data provides a flexible and robust work zone performance monitoring tool. The combination of visual displays on a map together with information on when and where work zones are active provides a systematic method for tracking queue lengths, delays, and speed profiles in real time. State DOTs can analyze delay costs during the lifetime of the work zone by comparing current congestion levels with previously observed levels and implement appropriate mitigation strategies.
- The WZPMA offers many benefits to State DOTs. Benefits include support in meeting the requirements of FHWA regulations on work zone data collection and monitoring, access to richer and cost-effective work zone mobility data, on-site assistance to construction project managers through real-time monitoring of work zone mobility impacts and feedback on lane closure effects, and programmatic evaluation of work zones at both program and project levels.
- Many State DOTs have used the WZPMA for a variety of purposes. State DOTs have used the WZPMA to perform work zone delay monitoring, reporting, and communication with stakeholders and the public. The State DOTs were able to save a significant amount of time and resources, evaluate major construction work zone investments, and track overall work zone safety and mobility impacts.
For more information on FHWA’s Work Zone Management Program, please contact Jawad Paracha, FHWA Office of Operations: Jawad.Paracha@dot.gov
Additional resources on work zone performance management can be found at: https://ops.fhwa.dot.gov/wz/ and https://www.workzonesafety.org/swz/
FHWA is engaging with State DOTs and conducting research to understand work zone mobility performance measurement best practices, challenges, and opportunities. The information will be used to increase awareness on data, tools, and methods for systematic work zone performance measurement across all stages of project development including planning, design, construction, and post-construction. Topics of interest include use of probe data and mainstreaming performance measures into agency policies and processes, including work zone process reviews and incorporating work zones into TSMO initiatives. This case study is one of a series of resources on work zone mobility performance measurement.
The U.S. Government does not endorse products or manufacturers. Trademarks or manufacturers’ names appear in this report only because they are considered essential to the objective of the document.