The National Performance Management Research Data Set (NPMRDS) and Application for Work Zone Performance Measurement

Printable version [PDF 514 KB]
You may need the Adobe® Reader® to view the PDFs on this page.
U.S. Department of Transportation
Federal Highway Administration
Office of Operations
1200 New Jersey Avenue, SE
Washington, DC 20590
ops.fhwa.dot.gov

FHWA-HOP-20-028
September 2020
The NPMRDS offers a free data source to State and Local transportation agencies for monitoring and reporting transportation system performance measures, as well as for setting and meeting mobility objectives and targets.
The National Performance Management Research Data Set in a Nutshell
Data Providers: INRIX, TomTom, HERE
Funded By: FHWA
Purpose: Support MAP-21 regulation and ongoing transportation system mobility performance measurement
Users: Federal, State, and regional agencies
Data Source: Probe vehicles
Metrics: Speed, travel time, and static AADT (2017)
Data Latency: One-month old
Lowest Temporal Resolution: 5 minutes
Spatial Resolution: TMC level (about ½ mile to 1 mile in urban/suburban areas and 5-10 miles in rural areas)
Geographical Coverage: NHS
Modal Coverage: Truck and passenger car Data Format: CSV and ArcGIS shapefiles (road segment details)
Licensing Agreement: Required
Overview
Transportation agencies are increasingly using probe vehicle data for transportation system performance management and as a resource for meeting the federal requirements of monitoring and reporting congestion and freight performance enacted in the Moving Ahead for Progress in the 21st Century Act (MAP-21). Federal regulations require setting objectives and targets to guide transportation funding allocation based on safety and operational performance measures.
To assist agencies with meeting the MAP-21 regulations, the Federal Highway Administration (FHWA) provides free access to the National Performance Management Research Data Set (NPRMDS), a national database of probe-vehicle-based speed and travel time data. The NPMRDS offers a new opportunity to monitor and report work zone performance measures. Using the NPMRDS, agencies can better benchmark the baseline mobility conditions prior to work zone activity, quantify and analyze work zone mobility impacts both during construction and post-construction, and implement mobility objectives and targets to proactively manage work zone mobility impacts.
National Performance Management Research Data Set Overview
The NPMRDS contains field-observed travel time and speed data collected anonymously from a fleet of probe vehicles (cars and trucks) equipped with mobile devices. Using time and location information from probe vehicles, the NPMRDS generates speed and travel time data aggregated in 5-minute, 15-minute, or 1-hour increments. The data are available across the National Highway System (NHS), with a spatial resolution defined by Traffic Message Channel (TMC) location codes. A TMC represents a unique, directional roadway segment that is about half a mile to a mile long in urban and suburban areas and could be as long as five to ten miles long in rural areas. The NPMRDS covers more than 400,000 TMCs and includes several billions of speed and travel time observations across the NHS for both freeways and arterials. The NPMRDS has been available since 2013, with freeway data dating back as far as 2008.
NPMRDS data are populated monthly for the previous month, thus they are not available in real time. Agencies can use the data for non-real-time analysis, performance monitoring, and reporting. State and other transportation agencies can access and use the NPMRDS for free through an account with the Regional Integrated Transportation Information System (RITIS) after agreeing to the necessary license agreement (https://npmrds.ritis.org/). The NPMRDS data can be used for a variety of applications, including planning, design, traffic operations and management, freight analysis, safety analysis, and congestion analysis.
The National Performance Management Research Data Set and Work Zone Mobility Performance Measurement
Performance measures provide transportation agencies with a mechanism to monitor their transportation system and identify where improvements or mitigation strategies might be needed. Performance measures serve as indicators for the effects of any change to the transportation system, such as the introduction of a work zone or traffic incidents.
Traditionally, transportation agencies have struggled to accurately measure and monitor the mobility performance of their work zones due to a lack of available data—both measured mobility data and accurate work zone activity data (WZAD)1. One solution to a lack of mobility data is the NPMRDS. The NPRMDS provides significant opportunities for transportation agencies to analyze transportation system performance in a systematic manner. NPMRDS speed and travel time data are available for all hours of the day, all days of the week, and all weeks of the year going down to a five-minute level of granularity. This represents a rich history of travel time and speed data that agencies can use for both bottom-up (e.g., hourly traffic analysis, peak hour analysis, daily analysis) and top-down (e.g., yearly, seasonal, monthly, weekly, trending) performance analysis. Therefore, agencies can now conduct the kind of detailed, repeatable, and systematic analyses and performance reporting that was not possible without an extensive roadway sensor and traffic measurement network. Using NPMRDS data, agencies can choose specific analysis time intervals to calculate work zone related delays, queues, throughput, and travel time reliability.
Figure 1 illustrates an example of a travel time analysis performed by North Carolina Department of Transportation (NCDOT) using NPMRDS data. The graph shows morning travel times obtained from probe data in the westbound direction through the Fortify Work Zone for a period of six months. Elevated travel times occurred in January through March, when the work zone first went into effect with moderate activity. The travel times notably increased in April and May when work activity increased and the contractor implemented daytime lane closures. Finally, the June curve shows the travel times dropping after completion of the work zone.
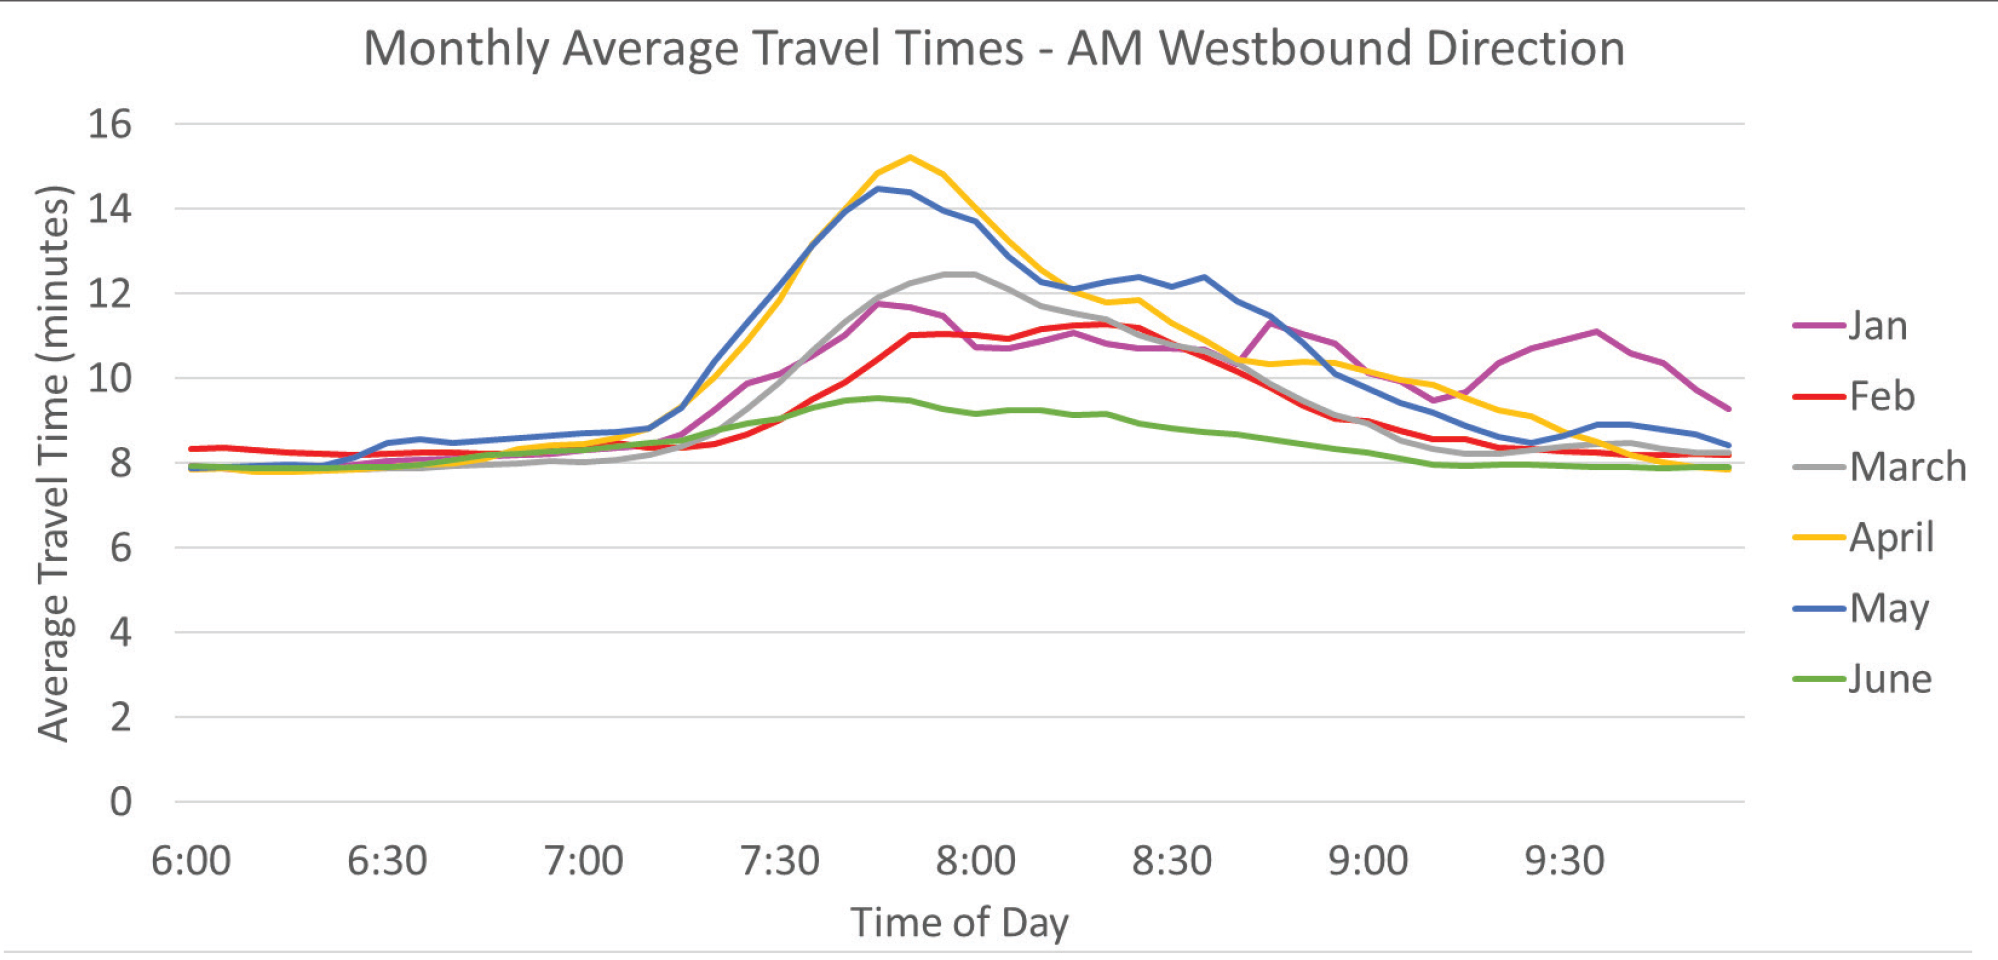
Figure 1. Example Travel Time Analysis Graph
(Source: NCDOT)
By quantifying work zone mobility performance, agencies can then take appropriate remedial and corrective actions, and use the information to better manage their work zones, including:
- Planning work zone and road closure start and end times (using granular NPMRDS data)
- Estimating work zone mobility impacts during planning and design
- Developing a baseline of system performance prior to implementing the work zone
- Conducting ongoing and post-hoc work zone mobility performance measurement and management, including:
- Calculating work zone travel times, speeds, and work-zone-induced delay
- Conducting travel time variability and travel time reliability analyses
- Determining total vehicle delay and estimating road-user costs
- Analyzing mobility performance of alternate routes and the nearby transportation network
- Cross referencing NPMRDS data with other data sources (e.g., construction information, incident data, crash data, weather data) to better understand causal relationships and take appropriate remedial and/or corrective actions
- Improving overall work zone management processes using a data-, metrics-, and performance-based approach
Using the NPMRDS, agencies can conduct the following types of analyses (see Figure 2):
- Basic analysis, such as speed and delay measurement
- Value-added analysis, such as road-user-cost analysis
- Sophisticated analysis, such as travel time reliability analysis
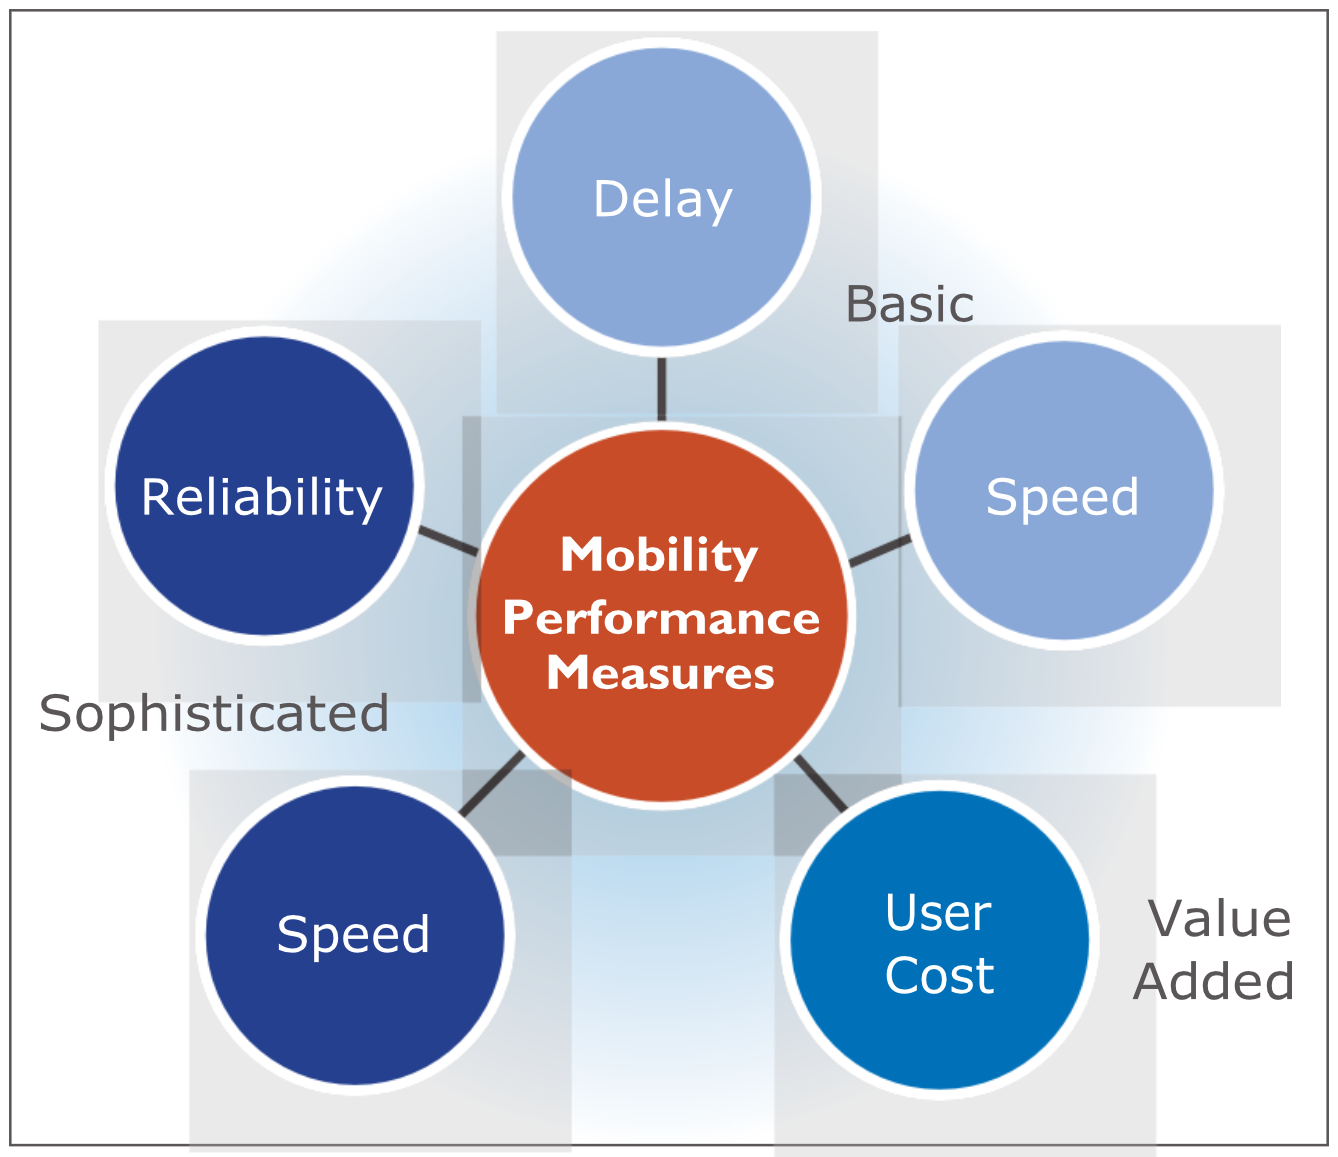
Figure 2. Spectrum of Work Zone Performance Analysis made possible by the National Performance Management Research Data Set (Source: FHWA)
Figure 3 shows the data building blocks for data-driven work zone performance management. The minimum data needed are work zone activity data (from the agency) and corridor mobility data (i.e., speed and travel time from the NPMRDS). The NPMRDS, therefore, fills a foundational performance measurement need for work zones. Additional data including traffic volume data, contextual information (e.g., incidents, weather, special events), and user cost assumptions can add further breadth and depth to the performance analysis.
FHWA has developed a 10-step process for work zone performance measurement using the NPMRDS and applied it (on a retroactive basis) to an example project: the Texas Department of Transportation Go I-10 project. The 10-step process and the Go I-10 case study are available for viewing and downloading at https://ops.fhwa.dot.gov/wz.
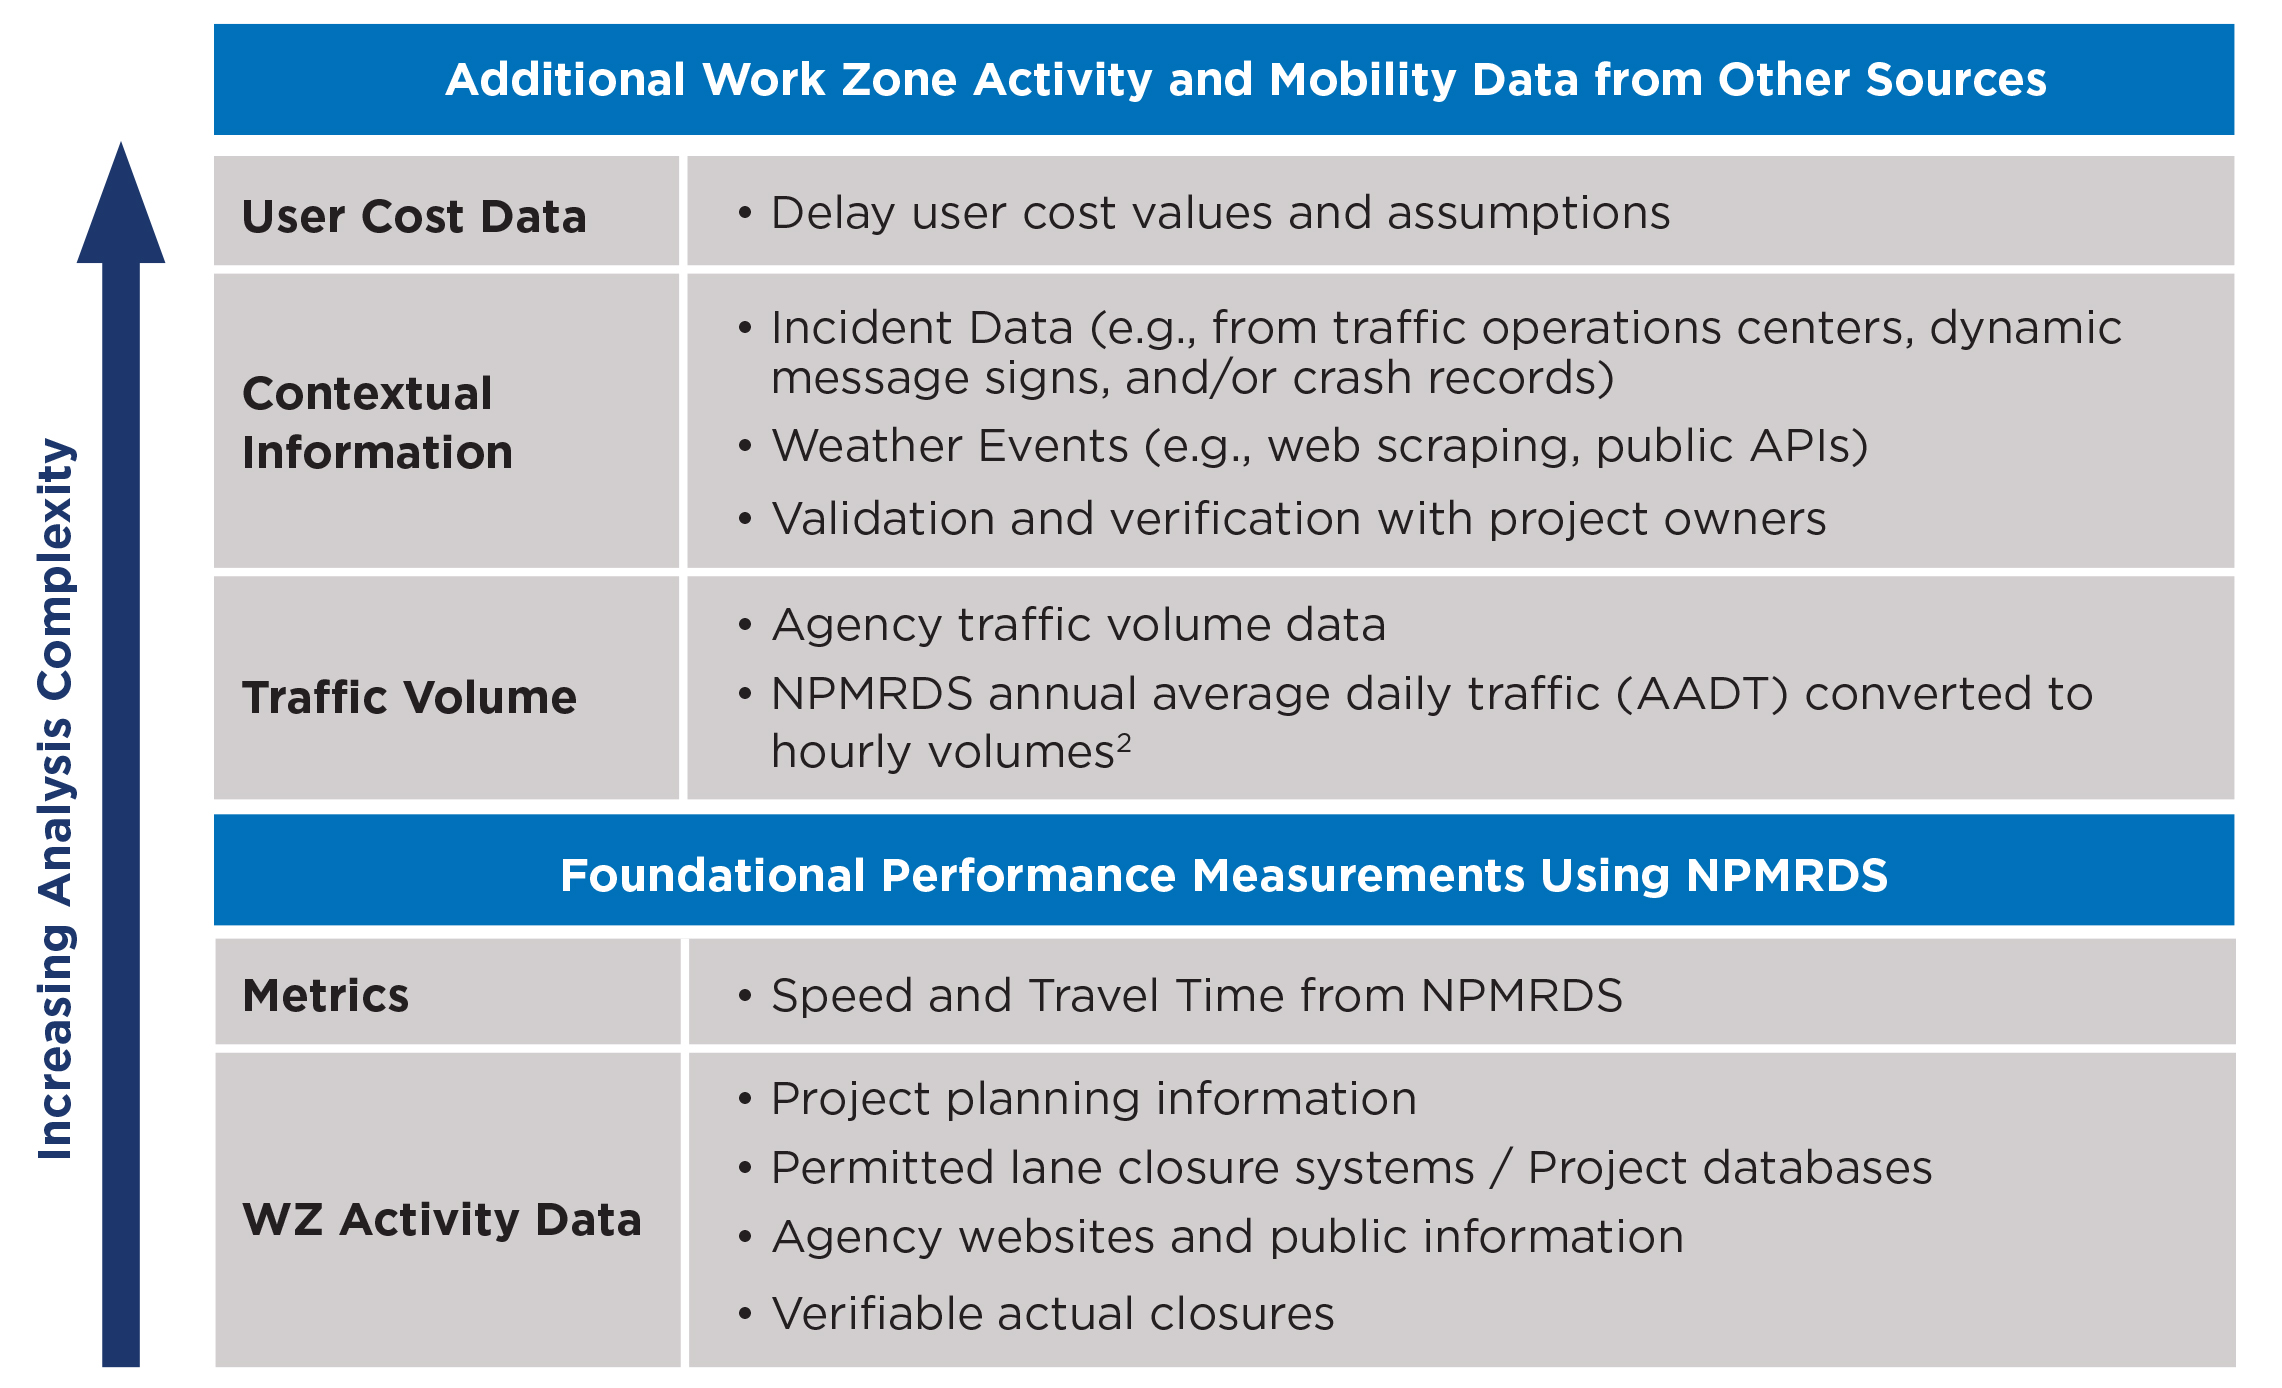
Figure 3: Data Building Blocks for Work Zone Mobility Performance Measurement
FHWA has developed a 10-step process for work zone performance measurement using the NPMRDS and applied it (on a retroactive basis) to an example project: the Texas Department of Transportation Go I-10 project. The 10-step process and the Go I-10 case study are available for viewing and downloading at https://ops.fhwa.dot.gov/wz.
The following are some potential ways for State DOTs to mainstream and integrate NPMRDS data and metrics into their day-to-day work zone management functions:
- Establish and track agency mobility objectives and targets, as well as set up thresholds for minimum mobility performance requirements
- Measure and monitor actual congestion impacts of ongoing construction projects in preceding months (i.e., with a one- month lag) and compare actual impact versus estimated queues and delays
- Validate work zone speed and travel time performance against set performance thresholds
- Measure and monitor mobility performance of detour routes during construction
- Adjust work zone management strategies to improve performance
- Use historical work zone performance data to systematically improve work zone management procedures and transportation management plans
- Incorporate work zone performance metrics in the work zone process reviews as a means of tracking performance over time and conducting trend and pattern analysis
- Bring about broad interdepartmental improvements through a culture of data-driven work zone performance management, leading to better construction and maintenance planning, design, engineering, contracting, construction, and operations
“NCDOT relied heavily on probe data for performance assessment and monitoring of the Fortify work zone on I-40 through Raleigh, NC. Having the probe data provided tremendous value to the department to better understand the delay and travel time impacts of the work zone, including impacts during different stages of the construction.”
- Steve Kite, NCDOT
Limitations of the National Performance Management Research Data Set
Although the NPMRDS creates a new opportunity for offline monitoring and performance reporting of work zones and other transportation aspects, there are some limitations that State and local agencies must consider when performing an analysis using the NPMRDS.
- The NPMRDS does not provide real-time data. NPMRDS data are a month old and therefore cannot be used for real-time traffic monitoring. However, the NPMRDS is very well suited for offline work zone performance assessment and post-hoc evaluations. For real-time management needs, agencies can purchase real-time probe-vehicle data from appropriate providers (e.g., RITIS, INRIX).
- Data quality and availability varies. The NPMRDS may have a significant number of outliers and missing values depending on road type, location, day of week, time of day, segment length, and traffic volume. For road segments not traversed by a probe vehicle during a certain time period, the corresponding entries in the NPMRDS are left blank and not imputed with historical data. Therefore, data may not be complete for all road segments (especially rural, lower-volume areas) or for all hours of the day (especially nighttime conditions). This could limit agencies from being able to use for the NPRMDS for monitoring and reporting work zone performance on low-traffic and rural roads.
- TMC segment lengths in some areas (e.g., rural roads) may be too long to provide an accurate picture of delay and travel time. TMC segment lengths could be as long as 5 to 10 miles, especially in rural areas. This could misrepresent the actual traffic speed and travel time observed around work zones, especially if queues are only a couple of miles long (a small part of the larger segment). Agencies can overcome this limitation by purchasing data at a higher granularity from INRIX or other providers.
- Coverage of the NPMRDS is only on the NHS. Because the NPMRDS covers only the NHS, it is not useful for examining the mobility impacts of work zones located on roads outside of the NHS.
- The basic NPMRDS (free package provided by FHWA) does not come with pre-built analytical tools. Agencies may download NPMRDS data into an appropriate tool/platform (e.g., Microsoft® Excel, database tool, statistical analysis tool, etc.) to run analyses, reports, and visualizations. Alternatively, agencies may purchase access to the web-based NPMRDS Deep-dive Analytical Toolset through the American Association of State Highway Transportation Officials’ (AASHTO’s) TMC Pooled Fund Study, or directly from the University of Maryland CATT Laboratory. (An option to expand the NPMRDS dataset well beyond the NHS is also available through AASHTO.) The NPMRDS Deep-dive tools provide many features including Congestion Scans, Performance Summaries/Charts, Road User Cost Analyses, Animated Trend Maps, and Custom MAP-21 Dashboards. Specific information about these is found here: https://www.tpm-portal.com/wp-content/uploads/cpbm/20171214-slides.pdf. General information about these and other tool options is found at https://www.ritis.org/tools.
For more information on FHWA’s Work Zone Management Program, please contact Jawad Paracha, FHWA Office of Operations: Jawad.Paracha@dot.gov
ditional resources on work zone performance management can be found at: https://ops.fhwa.dot.gov/wz/ and https://www.workzonesafety.org/swz/
FHWA is engaging with State DOTs and conducting research to understand work zone mobility performance measurement best practices, challenges, and opportunities. The information will be used to increase awareness on data, tools, and methods for systematic work zone performance measurement across all stages of project development including planning, design, construction, and post-construction. Topics of interest include use of probe data and mainstreaming performance measures into agency policies and processes, including work zone process reviews and incorporating work zones into TSMO initiatives. This case study is one of a series of resources on work zone mobility performance measurement.
1 WZAD is information on when, where, and how work zones are deployed and managed. This includes attributes such as location, time, impact, duration, lane closures, changes in lane geometry, operational changes, and signing. Recognizing the challenge of having accurate, timely, and updated WZAD, FHWA started the Work Zone Data Initiative to develop a recommended practice for managing WZAD and to create consistent data definitions and specifications. More information on the Work Zone Data Initiative is available at https://ops.fhwa.dot.gov/publications/fhwahop18083/index.htm. [Return to Note 1]
2The NPMRDS provides static AADT that can be converted to hourly volume by using appropriate time-of-day factors. The Texas Transportation Institute (TTI) has developed a methodology for deriving hourly traffic volumes from AADT, which is explained in the NPMRDS website. Alternatively, traffic volume can be obtained from an agency’s existing data sources, e.g., continuous or short-term count stations. [Return to Note 2 in Figure 3]