2019 Traffic Incident Management Capability Maturity Self-Assessment National Analysis ReportExecutive SummaryThe Federal Highway Administration (FHWA) has used the Traffic Incident Management Capability Maturity Self-Assessment (TIM CM SA) for nearly two decades to evaluate the state of the practice in traffic incident management across the country. Originally developed by FHWA in 2002, State and local TIM program managers use the TIM CM SA annually to benchmark and evaluate TIM program success and identify where additional resources may be needed for program improvement. In 2019, a total of 94 locations completed a TIM CM SA for inclusion in the national analysis, down slightly from the number of submittals in 2018 (98). The 55 scored questions in the TIM CM SA were grouped into three sections: Strategic, Tactical, and Support. The initial assessments completed in 2003, 2004, and 2005 (78 in total) continue to be used as the Baseline scores, although it should be noted that the Baseline scores are recalibrated each year that a major revision to the TIM CM SA is completed (2007, 2011, and 2015). Table 1 shows the average score for each of the three TIM CM SA sections from the Baseline and 2019, along with the percentage change from the Baseline.
The 2019 overall TIM CM SA score was 73.3 percent (out of a possible 100 percent), representing a 44.6 percent increase over the Baseline. The TIM CM SA mean scores tended to be higher in larger metropolitan areas than in smaller areas. Specifically, mean scores were calculated for the top 40 metropolitan areas (by population), the top 75 metropolitan areas, and non-top 75 metropolitan areas:
The significant revisions implemented in 2015 resulted in an overall decrease in the national score from 2014 to 2015 (down 9.5 percent). At 73.3 percent, the 2019 score is now the highest since that revision in 2015. The TIM CM SA is intended to represent the consensus opinion of the TIM stakeholders completing an annual assessment in each TIM program area (city/region/State). Starting with the 2017 TIM CM SA, an optional question was added to identify which TIM stakeholders (by stakeholder type, not specific name or agency) were involved in completing the annual assessment. Nearly all (95 percent) of the locations submitting a TIM CM SA in 2019 provided information on the stakeholder groups involved in completing their respective assessments. Figure 1 shows the percentage involvement of TIM stakeholder groups in completing the assessments in 2019. Stakeholder groups included in Other are: Medical Examiners; Safety Service Patrol Providers; Local/Regional Governments; Public Works Departments; and Transit and School Transportation Providers. 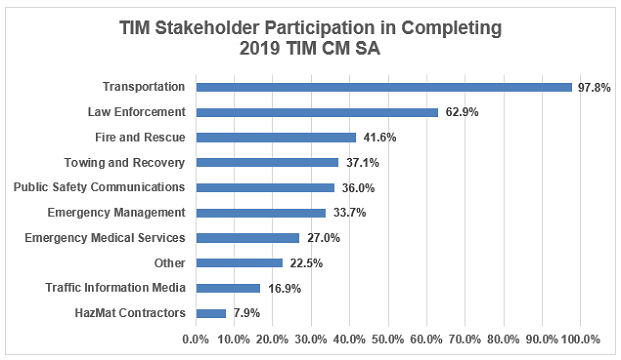 Figure 1. Graph. Traffic incident management stakeholder participation in completing 2019 Traffic Incident Management Capability Maturity Self-Assessment. A listing of all 55 TIM CM SA questions, their respective Baseline and 2019 scores, and the percentage of programs scoring each question 3 or higher1 can be found in the appendix. 1Scores of 3 and 4 indicate the highest levels of progress for a particular question. [ Return to note 1. ] | ||||||||||||||||||||||||||||||||||||||
|
United States Department of Transportation - Federal Highway Administration |
||