Comprehensive Work Zone Mobility Performance Management Across Project Stages

Printable version [PDF 819 KB]
You may need the Adobe® Reader® to view the PDFs on this page.
Contact Information: Operations Feedback at OperationsFeedback@dot.gov

U.S. Department of Transportation
Federal Highway Administration
Office of Operations
1200 New Jersey Avenue, SE
Washington, DC 20590
ops.fhwa.dot.gov
FHWA-HOP-19-054
The California Department of Transportation uses its Performance Measurement System to estimate work zone impacts, plan closures, manage performance during construction, and evaluate work zone management practices post-construction.
Overview
The California Department of Transportation (Caltrans) uses its Performance Measurement System (PeMS) as the key platform for monitoring and managing work zone performance. PeMS is a comprehensive roadway performance monitoring system consisting of roadway sensors for data collection, a web-based data warehouse, and a data analytics suite. Caltrans planners and engineers use PeMS to proactively manage work zone impacts across all project stages by:
- Estimating work zone impacts as part of pre-closure planning and analysis including lane requirements visualization and delay estimation;
- Monitoring and managing impacts during construction through dynamic reporting of road closure activity and status, real-time delay assessment, and detour route performance analysis;
- Analyzing and documenting project impacts and lessons learned including volume, throughput, queue length, delay, and incidents (including impacts on detour routes); and
- Using data archived in PeMS to better plan and design work zones and to compare real-time performance against historical performance.
PeMS
PeMS is Caltrans' statewide transportation performance management system that uses real-time traffic data from over 39,000 Caltrans system detectors (i.e., inductive loops, vehicle detection stations, and radar devices). These detectors span the State's freeway system across all major metropolitan areas and provide traffic volume, occupancy (i.e., traffic density), and speed data. These data are stored in a web-based centralized traffic data warehouse that integrates additional near-real-time and historical traffic data including permanent traffic counts, Weigh-in-Motion (WIM) data, Electronic Toll Collection (ETC) travel times, incident data, and Lane Closure System (LCS) data.
PeMS provides integrated insights and analyses grounded on rich historical and current data, enabling a comprehensive understanding of any mobility impacts of work zones and enabling the development of comprehensive mitigation and management strategies.
The key performance measures and analytical capabilities provided by PeMS include annual average daily traffic, vehicle miles traveled, delay, bottleneck locations, peak hour/peak period data, managed lanes (high-occupancy vehicle lane) data, and level of service. This massive collection of roadway performance data forms the basis of PeMS, which enables evaluation of mobility performance on major roadways using data analysis and visualization tools. The following figure illustrates Caltrans' work zone performance measurement framework and the different data sources that feed PeMS.
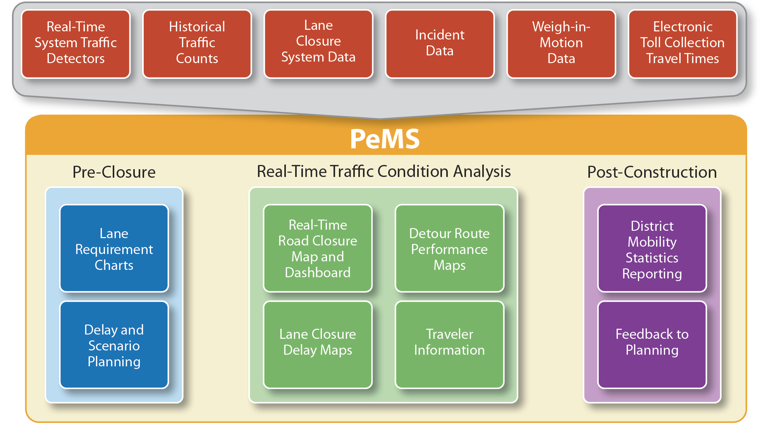
PeMS Data Sources and Caltrans' Work Zone Performance Management Framework
Pre-Closure Planning and Analysis
PeMS serves as the main data source for Caltrans' Lane Requirement Charts (LRCs) and for conducting detailed analysis of work zone lane closure impacts. The advantage of using PeMS for lane closure planning is that it not only provides a wealth of historical data for closure analysis but also systematizes the process across projects and provides additional tools (e.g., visualization) to better understand the impact of lane closures. The results of the analyses are shared internally within each district and at the statewide level. District traffic managers, transportation management plan engineers, resident engineers, and field inspectors use PeMS data to support lane closure activities.
Lane Requirement Charts
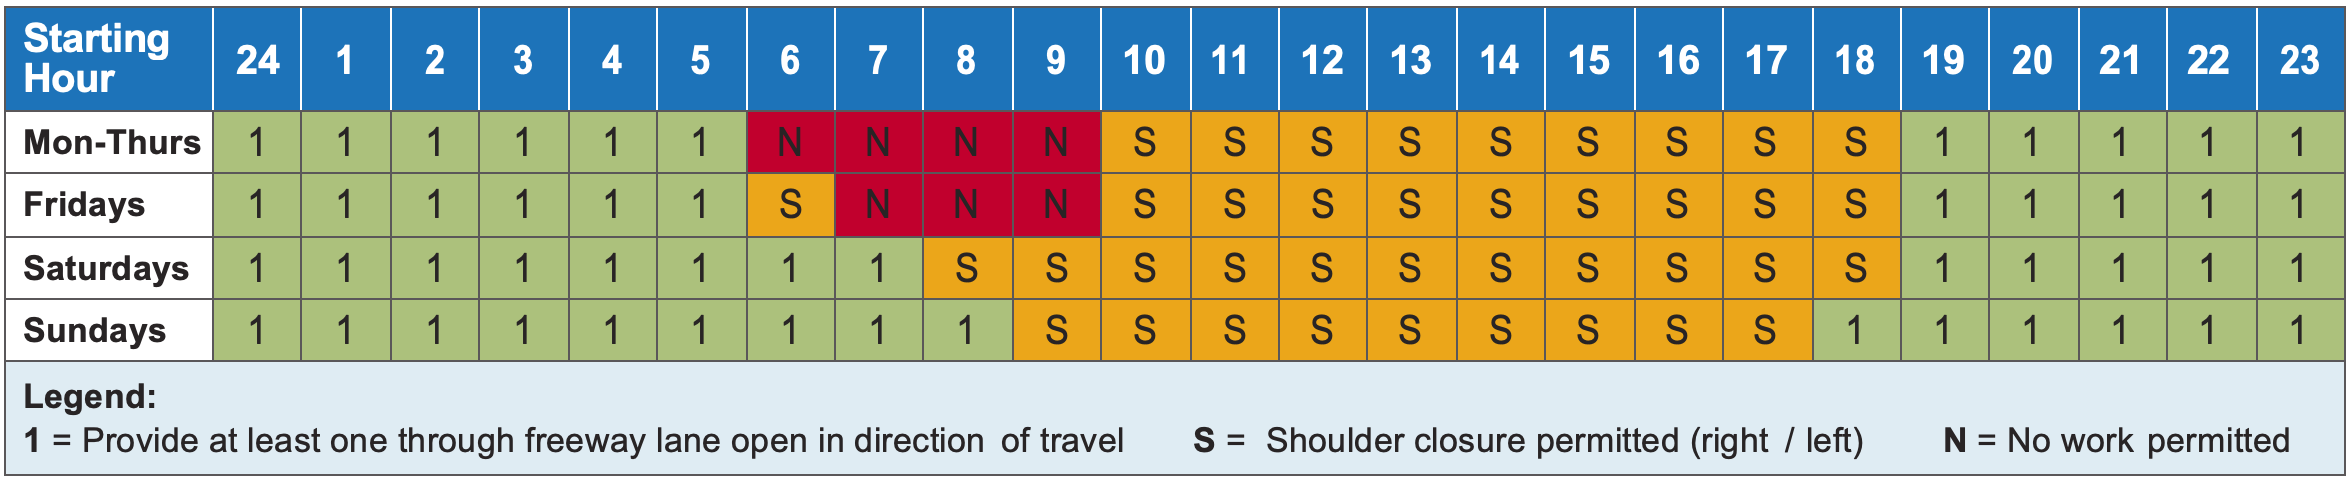
PeMS matches expected traffic demand against roadway capacity and produces LRCs for allowable lane closures by time of day. The figure below shows an example PeMS LRC chart.
Example PeMS Lane Requirements Chart
Delay and Scenario Analysis
While permitted lane closure systems are used by many States, PeMS provides additional analysis capabilities by combining standard lane closure charts with 10+ years of historical data that enable a comprehensive understanding of the work zone impacts of projects. PeMS directly estimates delays on the mainline, detour routes, and adjacent roadways without needing to run separate analyses in other software tools. The delay parameters include total delay duration, maximum individual vehicle delay, maximum queue length, total vehicle-hours of delay, and road user costs. Examples of PeMS delay analysis results are presented below. In PeMS, work zones are modeled as incidents.
| Delay Start Time | Delay End Date | Incident Capacity (veh/hr) | Max Flow During Segment (veh/hr) | Max Individual Delay (minutes) and Timestamp | Max Queue Length (miles) | Total Delay (veh-hrs) |
|---|---|---|---|---|---|---|
| 06/01/2016 (06:35) |
06/01/2016 (10:30) |
3,000 | 4,954 | 25 06/01/2016 (07:30) |
4.76 | 4,074 |

Example PeMS Output for Capacity Analysis. Source: PeMS
| 2-Hour Delay (veh-hrs) |
Average Value of Delay ($/veh-hrs) |
|---|---|
| 1,030.22 | 12.33 |
| Total 2-Hour Delay Cost ($) | Delay Cost ($/10 min) |
| 12,702.61 | 1,058.55 |
| Reopen Delay | Cost per 10 minutes ($) |
| < 30 minutes | 529.28 |
| 30 - 60 minutes | 793.91 |
| > 60 minutes | 1,058.55 |
Some of the applications of PeMS' delay calculations include:
- Assessing delay impacts of early closure and delayed pickup to assess potential contractor penalties for violating permitted lane closure timings;
- Assessing unused capacity on the immediate roadway system (including detour routes) and conducting sensitivity analyses on how much more volume the system can handle;
- Analyzing peak travel seasons/months using historical data and setting monthly variation in lane closure requirements as applicable; and
- Determining Travel Time Index (TTI) to estimate the variability or reliability of travel time through the work zone.
The adjacent table provides an example of a 2-hour delay calculation for a late pickup scenario for capital projects. The cost of the delay associated with a late pickup (for the first two hours after scheduled pickup time) can be used to set the amount to charge a contractor for late pickups. All costs are calculated according to Caltrans' road user cost guidelines.
Real-Time Traffic Conditions Analysis
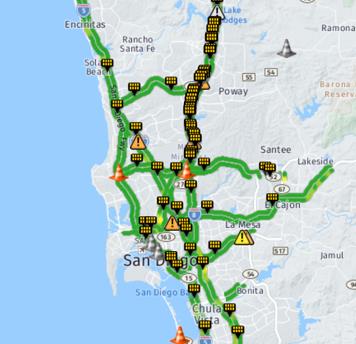
PeMS Real-Time View of all Road Closures
Source: PeMS
PeMS provides tools for real-time and ongoing monitoring of project and lane closure status and any associated delay and travel time impacts. All work zone activities on State highways are recorded and monitored in Caltrans' LCS. PeMS sources data directly from the LCS and is updated every 5 minutes. Every Caltrans district uses PeMS — specifically, the traffic management and construction teams coordinate construction and monitor projects in the field using PeMS data. PeMS also captures incident data from the California Highway Patrol website through web scraping.
All districts are required to report on work zone mobility performance including delay, vehicle miles of travel, and lost lane miles. The district traffic management and construction teams act as quality control to ensure contractor compliance of the allowed lane closure duration, and they cross validate actual closures with the lane requirements specified by the pre-closure analysis. In addition, the LRCs are regularly reviewed by the traffic management team to determine if a lane closure causes excessive delays. For example, if the observed delay is more than 15 minutes, district engineers and planners analyze alternative lane closure strategies and modify the construction activities or terminate them to mitigate any excessive delays and queues caused by lane closures.
The district traffic management and construction teams conduct monthly teleconference meetings to monitor the performance of LRCs and the LCS and discuss their implications on planned construction activity schedules and work zone management across all divisions.
The following are some of the visualization and query tools that PeMS offers for real-time work zone performance monitoring and management:
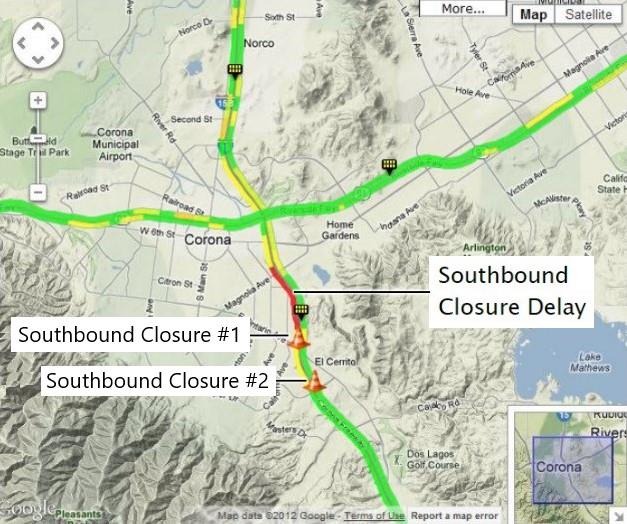
PeMS Lane Closure Delay Map
Source: PeMS
Post-Construction Analysis
Caltrans resident engineers regularly conduct post-construction work zone mobility evaluations that document and evaluate the design/construction features of road projects in the context of contractor work windows, traffic delays, contractor claims for insufficient language in the specifications, contract change orders due to deficiencies of LRCs, and any special project provisions. Incidents in the vicinity of the work zone are evaluated to understand their impact on work zone performance, and any incidents caused by lane closures are appropriately attributed to the work zone. The information from the evaluations is used to identify lessons learned and improvement opportunities for work zone system planning and management. Findings from post-construction evaluations may also be used as inputs into the required biennial Work Zone Process Reviews. As Process Reviews are used to gauge the effectiveness of work zone management policies and procedures, post-construction reviews allow Caltrans to directly measure project outcomes of specific work zone management practices.
Caltrans districts include work zone performance evaluations in their quarterly and annual Mobility Performance Reporting and Analysis Program reports that cover broader congestion reports and metrics. PeMS provides the data and tools to conduct post-closure evaluations both on the mainline and detour routes.
The following are some of the key post-closure analyses that can be performed in PeMS:
- Finding and fully validating actual closures against the original planned closure times;
- Investigating closure traffic volumes and comparing them against the estimated volumes;
- Using traffic volume and delay data to estimate and validate actual lanes-closed and lanes-reopened times against the lanes-closed and lanes-reopened times reported by the contractor;
- Estimating per lane capacity through a closure by analyzing and plotting actual throughput measured by system detectors;
- Estimating queue length using contour plots and online animation; and
- Measuring delay including individual vehicle delay, closure travel times, TTI, maximum closure travel time, and total delay.
Using PeMS to complete post-construction work zone mobility evaluations enables the development of:
- Mobility Statistics Reporting for Districts. Each district submits a summary report every quarter in addition to a yearly report. This mobility report shows a comparison of performance against previous quarters, and bottlenecks are ranked based on average queue length. Total delay and duration of queues are reported in addition to total vehicle hours of delay trends over the year.
- Feedback to Planning Stage. After a project is completed, resident engineers submit an evaluation form to the design engineer. Traffic engineers use these evaluations to adjust requirements for closing and re-opening of lanes for future projects. This open communication between district traffic managers and construction teams has been a key success factor in mitigating mobility impacts of lane closures and helps to optimize work windows while minimizing mobility impacts.
Key Takeaways from Caltrans PeMS and Work Zone Performance Management
- Take advantage of data already available in-house. Many transportation agencies are actively collecting and archiving a variety of data that can be useful for monitoring performance and managing traffic in and around work zones. The data that agencies are already collecting and archiving in-house can be a great resource for starting or advancing work zone performance monitoring programs. For agencies that do not have a broader data archiving program, identifying existing data sources as well as archiving and managing available data through a database platform can result in significant opportunities.
- Data-driven work zone management requires fusion of data from a variety of sources. Caltrans' PeMS effectively fuses many data sources for data-driven work zone decision-making, such as identifying when to start and end lane closures, scoping of current and future work zones, and sequencing of activities. The types of data sources include traffic flow data from system detectors, traffic count data, WIM data, ETC travel times, incident data, and LCS data. Fusing different data sources enhances the utility of data obtained from different sources, which in turn enhances work zone performance measurement and trend identification.
- Effective work zone performance management requires continuous feedback and communication throughout project development — before, during, and after lane closures. Establishing a continuous feedback loop allows agencies to identify areas of improvements based on lessons learned and refocuses agency resources when observed work zone impacts are different from those that were originally expected. Open communication between district traffic management staff, resident engineers, and field inspectors encourages collaboration between traffic and construction departments. Recurring district traffic management team meetings within and across districts are an important part of the continuous feedback for managing and improving work zone performance throughout the State.
- Having a state-wide system that tracks lane closure activities and associated impacts makes it easier to coordinate work zone activities. Communication between the State Department of Transportation (DOT) central office, districts, and local agencies is an important strategic approach for successful work zone scheduling, phasing, staging, and sequencing. A state-wide inventory of completed, ongoing, and planned lane closures is a prerequisite for effective communication among stakeholders, which presents a significant opportunity to minimize work zone impacts and reduce agency work zone management costs.
- Incorporate work zones into broader Transportation Systems Management and Operations (TSMO) and mobility performance reporting processes. Caltrans mainstreamed work zones into broader TSMO strategic planning, performance measurement, and reporting processes. This allows the work zone program to organically tap into broader TSMO funds and resources.
For more information on Caltrans' work zone performance management processes, please contact Lida Movahed, Caltrans: lida.movahed@dot.ca.gov
For more information on FHWA's Work Zone Management Program, please contact Jawad Paracha, FHWA Office of Operations: Jawad.Paracha@dot.gov
Additional resources on work zone performance management can be found at: https://ops.fhwa.dot.gov/wz/ and https://www.workzonesafety.org/swz/
FHWA is engaging with State DOTs and conducting research to understand work zone mobility performance measurement best practices, challenges, and opportunities. The information will be used to increase awareness on data, tools, and methods for systematic work zone performance measurement across all stages of project development including planning, design, construction, and post-construction. Topics of interest include use of probe data and mainstreaming performance measures into agency policies and processes, including work zone process reviews and incorporating work zones into TSMO initiatives. This case study is one of a series of guidance resources on work zone mobility performance measurement.