Transportation Management Centers: Streaming Video Sharing and Distribution - Final Report
Chapter 2. Background and Literature Summary
Key information for this report came from a mix of in-person interviews, literature reviews, and surveys of public agencies (closed-circuit television (CCTV) deployers), law enforcement officials (CCTV recipients and deployers), other public safety agencies (CCTV recipients), the media (CCTV recipients and deployers), universities (technology providers), CCTV manufacturers, and private sector firms that develop technologies to help owners share CCTV streams. This section summarizes basic facts and figures about sharing around the country, why this is a pressing issue, why it has been difficult for many agencies to share, and why there are so many different approaches to sharing.
While this report focuses on transportation management centers (TMC) and how they share CCTV video, it is important to understand why various stakeholders desire CCTV video.
TMCs: TMC personnel use CCTV for situational awareness, event detection and confirmation, for coordinating response, for signal timing, for security operations, to monitor critical infrastructure, to understand what equipment to dispatch to a scene, and for public information.
First Responders (including police, fire, emergency medical services (EMS), safety and service patrols, hazardous materials (HazMat) remediation teams, etc.): These groups tend to use State department of transportation (DOT) CCTV to gain a better understanding of the status of an incident prior to rolling up on the scene. Knowing what they are responding to can help to reduce surprises and can help to further dispatch the right types of responders, equipment, etc. In addition, first responders may use a State and local DOT's CCTV feeds while on the scene to get a wider view of the area to ensure both their safety as well as that of others on the scene.
Towing and Recovery: Towing and recovery personnel make use of live video to understand what equipment might be needed on-scene. Knowing ahead of time how big an incident is can help to ensure the right equipment is dispatched first so that the road can be cleared more quickly. Similarly, towing companies may want to have a better understanding of the space limitations and traffic conditions approaching the scene.
Media: For local news stations, the priorities for viewers that drives ratings and advertising revenue are 1) weather, 2) traffic, 3) sports, and 4) news—in that order.1 Radio follows a similar pattern, with the quality of traffic reporting being extremely high in ratings rankings. Therefore, access to CCTV can dramatically increase viewership, and thus revenue, and is considered a competitive advantage. Several traveler information providers and media outlets interviewed for this project noted that they could attribute the loss or gain of lucrative advertising or other contracts to having access to CCTV from public agencies. These contracts vary in size and value depending on the markets served and can be as small as $15,000 per year or can be valued up to millions of dollars. CCTV is particularly valuable because it works for many communication mediums—web, mobile, and broadcast—and it helps the private sector to verify information internally.
Public: The public desires access to live CCTV to help make better decisions—especially when an event is detected along their commute route. While navigation apps may alert users of crashes and delays, a video of traffic hazards and conditions can be more compelling. The public also has a general desire to "see" what is happening on the roadway and has become accustomed to live-streaming video from many other outlets.
Despite the desire from multiple stakeholders, there is a great disparity among transportation agencies when it comes to their willingness and ability to share their own video feeds with third parties. Some agencies have fully solved their video distribution issues; however, due to local conditions, their solution may be impossible for another agency to replicate. Some common barriers include: network capacity, analog to digital conversion, compression, an unhealthy mix of multi-generational technologies, and more.
Other public agencies (including both State and local DOTs, law enforcement, emergency management agencies, MPOs, etc.) may have a technical solution ready, but they have yet to resolve political, financial, operational, or other institutional challenges. For example, the leadership within the agency may be sensitive to privacy and security concerns. A culture of fear can paralyze an agency's progress towards collaboration—even with partner agencies. Sometimes, an agency's IT policies prevent it from implementing the correct solution, or any solution at all. In these instances, lack of understanding and collaboration between agency IT and operations departments results in loss of significant capability for the agency. In other instances, the agency may not have the right information to justify the expense of implementing a sharing solution. In a few cases, agencies are even "held hostage" by third parties that manage (or outright own) the agency's CCTV platforms and are either unwilling to allow sharing, artificially inflate costs to discourage sharing, or have entered into exclusive relationships with select media partners that inhibit further distribution. There is even one situation in which an agency developed their video sharing memoranda of understanding (MOU) in a vacuum, with the end result being an MOU that was so restrictive that no other partner agency could convince legal counsel to accept the terms and conditions of the agreement.
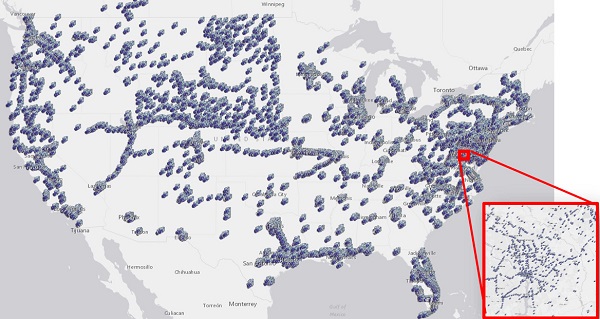
Figure 1. Map. Transportation agency CCTV deployment map.
Source: FHWA. "Federal Highway ITS Asset Viewer – Geospatial Viewer for ITS Assets" web page. Available at: https://www.itsassets.its.dot.gov/, last referenced May 1, 2019.
The 2016–2017 Deployment Tracking Survey2 by the U.S. Department of Transportation Intelligent Transportation Systems Joint Program Office found that 44 of the 50 responding agencies were sharing realtime video data in some form. The survey did not specify whether this referred to video streams or static snapshots. Agencies focusing on arterial management were less likely to be sharing their CCTV realtime video (25 percent of all responding agencies). Roughly 7 percent of transit agencies that responded to the same survey claimed they were sharing their realtime video data.
While the above survey is less than 3 years old, technology—the public's desire for streaming video feeds—is changing rapidly. Table 1 provides the results of an informal March 2019 survey of the top 50 TMCs in the Nation and other TMCs with respect to their CCTV assets and ability to share/stream live video.
| Agency or TMC | Number of CCTV Cameras | Shared with other Agencies? | Shared with the Media | Shared Directly with the Public | Cost recovery for sharing? | Plans to share in the near future? |
|---|---|---|---|---|---|---|
| Alabama DOT | ~500 | ✓ | ✓ | ✓ | NO | N/A |
| Arizona DOT | 450 | ✓ | ✓ | ✓ | NO | - |
| Arkansas DOT | 80 | ✓ | ✓ | NO | N/A | |
| California DOT | 2889 | ✓ | ✓ | ✓ | NO | N/A |
| Colorado DOT | 600 | ✓ | ✓ | ✓ | NO | N/A |
| Connecticut DOT | 342 | ✓ | ✓ | ✓ | NO | N/A |
| Delaware DOT | 252 | ✓ | ✓ | ✓ | NO | N/A |
| District of Columbia DOT | 220 | ✓ | ✓ | ✓ | NO | N/A |
| Florida DOT | 3292 | ✓ | ✓ | ✓ | YES | N/A |
| Georgia DOT | 1250 | ✓ | ✓ | ✓ | NO | N/A |
| Idaho DOT | 244 | ✓ | ✓ | ✓ | NO | N/A |
| Illinois DOT | 250 | - | - | ✓ (only 1) |
NO | - |
| Indiana DOT | 350 | ✓ | ✓ | ✓ | NO | N/A |
| Iowa DOT | 400+ | ✓ | ✓ | ✓ | NO | N/A |
| Kansas DOT | 120 | - | - | - | - | - |
| Kentucky DOT | 224 snapshots | - | - | ✓ | NO | N/A |
| Louisiana DOT | ~500 | ✓ | ✓ | ✓ | NO | N/A |
| Maryland DOT | 950 | ✓ | ✓ | ✓ | NO | N/A |
| Massachusetts DOT | - | ✓ | - | - | - | YES |
| Michigan DOT | 760 | ✓ | ✓ | ✓ | NO | N/A |
| Minnesota DOT | 1000 | ✓ | ✓ | ✓ | NO | N/A |
| Mississippi DOT | 977 | ✓ | ✓ | ✓ | NO | N/A |
| Missouri DOT | 1154 | ✓ | ✓ | ✓ | NO | N/A |
| Nebraska DOT | 234 | ✓ | ✓ | ✓ | NO | N/A |
| Nevada RCTO | 700 | ✓ | ✓ | ✓ | NO | N/A |
| New Jersey DOT | 1080 | ✓ | ✓ | ✓ | NO | N/A |
| New York State DOT | 1015 | ✓ | ✓ | ✓ | NO | N/A |
| New York City DOT | 600 | ✓ | ✓ | ✓ | NO | N/A |
| North Carolina DOT | - | - | ✓ | - | NO | YES |
| North Dakota DOT | 118 snapshots | - | ✓ | ✓ | NO | - |
| Ohio DOT | 700 | ✓ | ✓ | ✓ | NO | N/A |
| Oklahoma DOT | 268 | ✓ | ✓ | FUTURE | ||
| Oregon DOT | 425 | ✓ | ✓ | ✓ | NO | N/A |
| Pennsylvania DOT | 950 | - | - | - | - | |
| Rhode Island DOT | 143 | ✓ | ✓ | ✓ | NO | N/A |
| South Carolina DOT | 500 | ✓ | ✓ | ✓ | NO | N/A |
| Tennessee DOT | 551 | ✓ | ✓ | ✓ | YES | - |
| Texas DOT | 652 | ✓ | ✓ | ✓ | NO | N/A |
| Utah DOT | 1400 | - | ✓ | - | NO | - |
| Vermont DOT | 45 snapshots | - | - | - | NO | N/A |
| Virginia DOT | - | ✓ | ✓ | ✓ | N/A | |
| Washington DOT | 1200 | ✓ | ✓ | - | NO | - |
| West Virginia DOT | 113 | ✓ | ✓ | ✓ | NO | N/A |
| Wisconsin DOT | 30 | - | ✓ | - | NO | - |
| Wyoming DOT | 171 snapshots | - | - | ✓ | NO | - |
- = no data. CCTV = closed circuit television. DOT = department of transportation. TMC = transportation management center.
1 Interview with Regina Hopper, Past President of ITS America and Former Television Reporter. [ Return to note 1. ]
2 U.S. Department of Transportation, Intelligent Transportation Systems Joint Program Office. (n.d.). "2016–2017 Deployment Tracking Survey Results." Available at: https://www.itsdeployment.its.dot.gov/fm_ic.asp. Last accessed May 1, 2019. [ Return to note 2. ]