Integrating Travel Time Reliability into Transportation System Management: Final Technical Memorandum
Chapter 6. Methodology for Linking Goals to Tactics
This section describes an analytical methodology based on the materials presented at the workshop. Hypothetical scenarios that illustrate the application of the analysis framework are presented in the appendix.
Overview
This section proposes a five-step methodology or process that provides a connection from system-level goals and objectives developed at the planning level to more detailed operational objectives, operational approaches, and tactics. This methodology recommends the use of reliability data and analysis tools (RDAT), when available, to move from one step to the next. By using this methodology, the operational tactics or actions taken to manage the transportation system are derived from and contribute to system-level goals and objectives. This methodology is shown in figure 14.
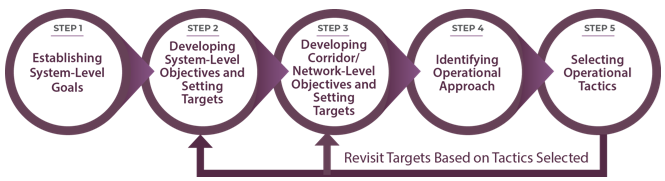
Source: FHWA
Figure 14. Diagram. Five-step methodology for linking system-level goals to the selection of operational tactics.
The appendix demonstrates the use of this methodology in four scenarios. Two of the scenarios show how this methodology could be used for a corridor within a State and the other two scenarios are from the perspective of a small and large metropolitan region. The appendix provides a graphical illustration of the sample corridors and regions and detailed flow diagrams containing abbreviated output from each step and the connections between the steps. It walks through each step of the methodology for each scenario and discusses the applicability of reliability data and analysis tools for supporting those steps.
Below is a description of each of the steps of the methodology and the data and analysis tools that agencies and planning organizations may use to support that step. This methodology may not be conducted from beginning to end by the same staff members or organization. The methodology begins in the area of system-level transportation planning in Step 1 and moves into the traditional purview of transportation operators and engineers by Steps 4 and 5. While the lead or ownership of the methodology may shift across the steps, it is important for planners to inform the later steps and operators to provide input to the earlier steps. This involvement from planners and operators helps to bridge the gap normally experienced between the two disciplines.
Step: 1: Establishing System-Level Goals
System-level goals are high-level goals for the surface transportation system. They are derived through the connection of the general purposes of transportation, local views regarding the unique aspects of the community, and the community's current challenges. Both local challenges and unique community preferences are termed motivators as part of the proposed methodology and they must be articulated and available for Step 1 of the process, which is to develop system-level goals.
Application of Reliability Data and Analysis Tools (RDAT): The Second Strategic Highway Research Program (SHRP2) L05 performance measures guide provides guidance on incorporating reliability into transportation system (and agency) goals.72 In addition, at the goal-setting stage, a useful reliability tool is the travel time reliability monitoring system (TTRMS), described in the SHRP2 L02 monitoring guide.73 If a region had such a system in place, it could be used to help identify some of the motivators that guide the development of system goals.
Step 2: Developing System-Level Objectives and Setting Targets
The second step of the methodology is to develop system-level objectives and set targets. In this step, more aspirational goals must be distilled into specific areas of focus. The methodology employs the SMART definition of the system objectives, meaning that each objective derived from a goal should be specific, measurable, agreed-upon, realistic, and time-bound (SMART) while supporting at least partial achievement of the associated system-level goal. Setting objectives also requires understanding the context of the system and community within which the goal has been established. For example, transportation is about connectivity, yet for rural communities connectivity may necessarily focus on removing physical bottlenecks while urban community connectivity may be about providing system options. To have a measurable objective, the establishment of system-level goals must be carefully framed around specific performance measures that describe progress toward the goal. Background information on selecting performance measures is available on the Federal Highway Administration (FHWA) website.74
After determining system-level objectives, Step 2 includes the setting of targets. There are two important elements to target setting. The first is electing the appropriate performance measure. If the system-level objective is SMART, the performance measure is often embedded within the objective. The second element to target setting is determining the amount of improvement that can be accomplished within the anticipated resources. At this stage in the methodology, targets can be estimated but they will need to be re-visited after planners better understand the expected impacts of the selected strategies and tactics.
Application of RDAT Tools: At the stage of setting system-level objectives and targets, the primary usefulness of RDAT tools is in the establishment of existing and historical conditions to support the following:
- Set a baseline: The SHRP2 L02 monitoring guide details methods to acquire, impute, visualize, and manage such data. It also covers a variety of use cases. The SHRP2 L05 performance measures guide describes ways to roll this data into system-wide visualizations and assessments.75 Setting the baseline allows the analyst to identify existing systematic reliability problems, which in turn can guide the process for establishing objectives at a high level. It is important at the data collection stage to be thinking about how predictive RDAT tools (such as the SHRP2 L07 evaluation tool, FREEVAL, and the C11 Benefit-Cost Analysis tool) will be used to evaluate strategies and tactics in Steps 4 and 5 so that the data collection ultimately can be used in comparisons of unimproved and improved conditions.76 77 78
- Identify sources of congestion: Knowing the sources of system-wide congestion (both recurring and non-recurring) can help agencies focus their system-wide objectives. Because the data collection for reliability statistics is at a granular level, operating agencies and planning organizations can use the data to identify individual segment and corridor deficiencies and to help identify sources of congestion by correlating reliability data with weather, incident, special event, and work zone data.
- Establish system-level performance measures: The SHRP2 L05 guide provides assistance with developing system-level measures, most notably by methods to aggregate measures from the corridor level to the system level.79
- Set thresholds: The SHRP2 L05 guide provides direction and examples related to setting reliability thresholds. The L05 guide gives guidance on incorporating reliability into goals and objectives, and is a useful reference at this stage of the evaluation.80
Step 3: Developing Corridor/Network-Level Objectives and Setting Targets
Network- and corridor-level objectives are derivatives of system-level objectives and are connected to a much more specific geographic context. Between Step 2 and Step 3, it can be common for the leaders or owners of this process to change from transportation planners to operations engineers. During that switch, there can be a tendency to either skip Step 3. The goal of this methodology is to resist the urge to identify tactics from the system-level objectives and the corridor or network context and instead to subdivide the system-level objectives into corridor- or network-level objectives. Each corridor- or network-level objective can then be an interrelated piece of an overall solution rather than a purpose and need statement for a narrowly defined design project or solution.
Application of RDAT Tools: At the corridor and network level, RDAT tools have a level of usefulness similar to that at the system level. In fact, as mentioned in the Step 2 narrative, system-level performance measures must be built up or aggregated from the corridor or segment level. Thus, the applications described in the Step 2 narrative—setting a baseline, identifying sources of congestion, establishing performance measures, and setting threshold—also apply to Step 3, and the same RDAT tools are relevant.
Step 4: Inentifying an Operational Approach
Identifying an operational approach and defining supportive tactical program areas is Step 4 of the methodology. If the corridor/network-level objectives have been defined in a user-focused manner, the choice of tactical program areas may be the first time that the agency engages in discussions of whether the objectives are best met through a design treatment, operations strategy, or revised business process. Context filters down in this step through corridor/network-level objectives, but also must be considered in the review of tactical program areas to avoid applying strategies misaligned with the corridor/network context. In this step, a universe of tactical program areas is available and then assessed against corridor/network-level objectives.
Application of RDAT Tools: Once performance thresholds are defined in Steps 2 and 3 and data has been collected to establish a baseline, identifying areas with reliability issues (not meeting performance targets) can support the selection of tactical program areas to address these issues. The SHRP2 L02 monitoring guide and L05 performance measures guide both describe the ways to calculate and visualize performance measures, and L05 addresses comparing them to targets.81 82
Step 5: Selecting Operational Tactics
Selecting operational tactics in Step 5 requires expert judgment of leaders within each tactical program area to determine how well the corridor or network fits with potential tactics. The experts within each area must be consulted in a collaborative fashion to negotiate the best selection of assorted tactics from divergent tactical program areas to make sure each tactic is applied in a complementary fashion. A lack of coordination during this stage may lead to tactics in one program area that call for using physical space on the roadway or designating a specific tactical area to support one objective that, based on design, could be in contrast with another corridor- or network-level objective. An integrated approach to selecting tactics allows the tactics to be applied in a cooperative fashion and can help rule out tactics that do not support the greater aim.
Application of RDAT Tools: At the tactics stage, predictive reliability tools come into play. These tools are designed to forecast outcomes of various tactics, and these outcomes can be used to extract predicted performance measures consistent with those selected in Steps 2 and 3.
- FREEVAL (as updated in SHRP2 L08) allows the user to manipulate inputs that affect non-recurring congestion: incidents (frequency and duration), demand variations (month and day-of-week), and work zones (type, physical extent, duration, etc.).83 FREEVAL generates a series of scenarios and builds a travel-time distribution, from which various reliability performance measures can be extracted. FREEVAL is strictly for freeways and operates at a corridor level.
- STREETVAL, a related software tool, allows analysis similar to FREEVAL, but for arterial corridors.84
- The SHRP2 L07 tool, like FREEVAL, is freeway-based, but is primarily geared toward highway design treatments (as opposed to operational strategies and tactics). It does offer customizable treatment options that could allow operational strategies to be analyzed as well. The tool provides reliability statistics at the segment (not corridor) level (using the SHRP2 L03 "data rich" models). It also provides monetized benefit estimates.85
- The SHRP2 C11 Accounting Framework tool has a reliability module that allows users to calculate reliability metrics and congestion costs at the freeway segment (not corridor) level (using the SHRP2 L03 "data poor" models).86
The RDAT tools require the user to map the effects of tactics to changes in tool inputs. The L07 report provides guidance in this area.
72 Strategic Highway Research Program (SHRP 2). 2013. Report S2-L05-RR-2: Guide to Incorporating Reliability Performance Measures into the Transportation Planning and Programming Processes, Washington, DC. Available at http://www.trb.org/Main/Blurbs/168855.aspx, last accessed April 5, 2019. [ Note 72 ]
73 SHRP 2. 2014. Report S2-L02-RR-2: Guide to Establishing Monitoring Programs for Travel Time Reliability, Washington, DC. Available at http://www.trb.org/Main/Blurbs/168764.aspx, last access April 5, 2019. [ Note 73 ]
74 FHWA. 2019. Setting Operations Objectives, Washington, DC. Available at https://ops.fhwa.dot.gov/plan4ops/focus_areas/integrating/operations_objectives.htm, last accessed February 15, 2019. [ Note 74 ]
75 Strategic Highway Research Program (SHRP 2). 2013. Report S2-L05-RR-2: Guide to Incorporating Reliability Performance Measures into the Transportation Planning and Programming Processes, Washington, DC. Available at http://www.trb.org/Main/Blurbs/168855.aspx, last accessed April 5, 2019. [ Note 75 ]
76 SHRP 2. 2014. Evaluation of Cost-Effectiveness of Highway Design Features Tool (L07), Washington, DC. Available at http://onlinepubs.trb.org/onlinepubs/shrp2/RFPL38/SHRP2_DesignTool_L07_MRI_Global_v2.1.xlsm, last accessed April 5, 2019. [ Note 76 ]
77 SHRP 2. 2013. FREEVAL-RL Computational Engine (L08), Washington, DC. Available at http://www.trb.org/Main/Blurbs/169595.aspx, last accessed April 5, 2019. [ Note 77 ]
78 SHRP 2. 2013. SHRP 2 C11 - Tools for Assessing Wider Economic Benefits, Washington, DC. Available at http://www.tpics.us/tools/, last accessed April 5, 2019. [ Note 78 ]
79 Strategic Highway Research Program (SHRP 2). 2013. Report S2-L05-RR-2: Guide to Incorporating Reliability Performance Measures into the Transportation Planning and Programming Processes, Washington, DC. Available at http://www.trb.org/Main/Blurbs/168855.aspx, last accessed April 5, 2019. [ Note 79 ]
80 Strategic Highway Research Program (SHRP 2). 2013. Report S2-L05-RR-2: Guide to Incorporating Reliability Performance Measures into the Transportation Planning and Programming Processes, Washington, DC. Available at http://www.trb.org/Main/Blurbs/168855.aspx, last accessed April 5, 2019. [ Note 80 ]
81 SHRP 2. 2014. Report S2-L02-RR-2: Guide to Establishing Monitoring Programs for Travel Time Reliability, Washington, DC. Available at http://www.trb.org/Main/Blurbs/168764.aspx, last access April 5, 2019. [ Note 81 ]
82 Strategic Highway Research Program (SHRP 2). 2013. Report S2-L05-RR-2: Guide to Incorporating Reliability Performance Measures into the Transportation Planning and Programming Processes, Washington, DC. Available at http://www.trb.org/Main/Blurbs/168855.aspx, last accessed April 5, 2019. [ Note 82 ]
83 SHRP 2. 2013. FREEVAL-RL Computational Engine (L08), Washington, DC. Available at http://www.trb.org/Main/Blurbs/169595.aspx, last accessed April 5, 2019. [ Note 83 ]
84 SHRP 2. 2013. STREETVAL Computational Engine (L08), Washington, DC. Available at http://www.trb.org/Main/Blurbs/169595.aspx, last accessed April 5, 2019. [ Note 84 ]
85 SHRP 2. 2014. Evaluation of Cost-Effectiveness of Highway Design Features Tool (L07), Washington, DC. Available at http://onlinepubs.trb.org/onlinepubs/shrp2/RFPL38/SHRP2_DesignTool_L07_MRIGlobal_v2.1.xlsm, last accessed April 5, 2019. [ Note 85 ]
86 SHRP 2. 2013. SHRP 2 C11 - Tools for Assessing Wider Economic Benefits, Washington, DC. Available at http://www.tpics.us/tools/, last accessed April 5, 2019. [ Note 86 ]