A Policy-Driven Approach for Work Zone Mobility Performance Management
PDF Version [PDF 2.0MB]
You may need the Adobe® Reader® to view the PDFs on this page.
Contact Information: Work Zone Feedback at WorkZoneFeedback@dot.gov
The Ohio Department of Transportation uses a policy-driven approach to estimate, monitor, and manage the work zone impacts of key projects across the state.
Overview
The Ohio Department of Transportation (ODOT) uses a policy-driven approach to systematically determine any negative impacts that work zones may have on mobility, and eliminate, minimize, or mitigate those impacts to the greatest extent practicable. The objective of the department's effort is to enhance work zone mobility and safety while delivering a positive road user experience.
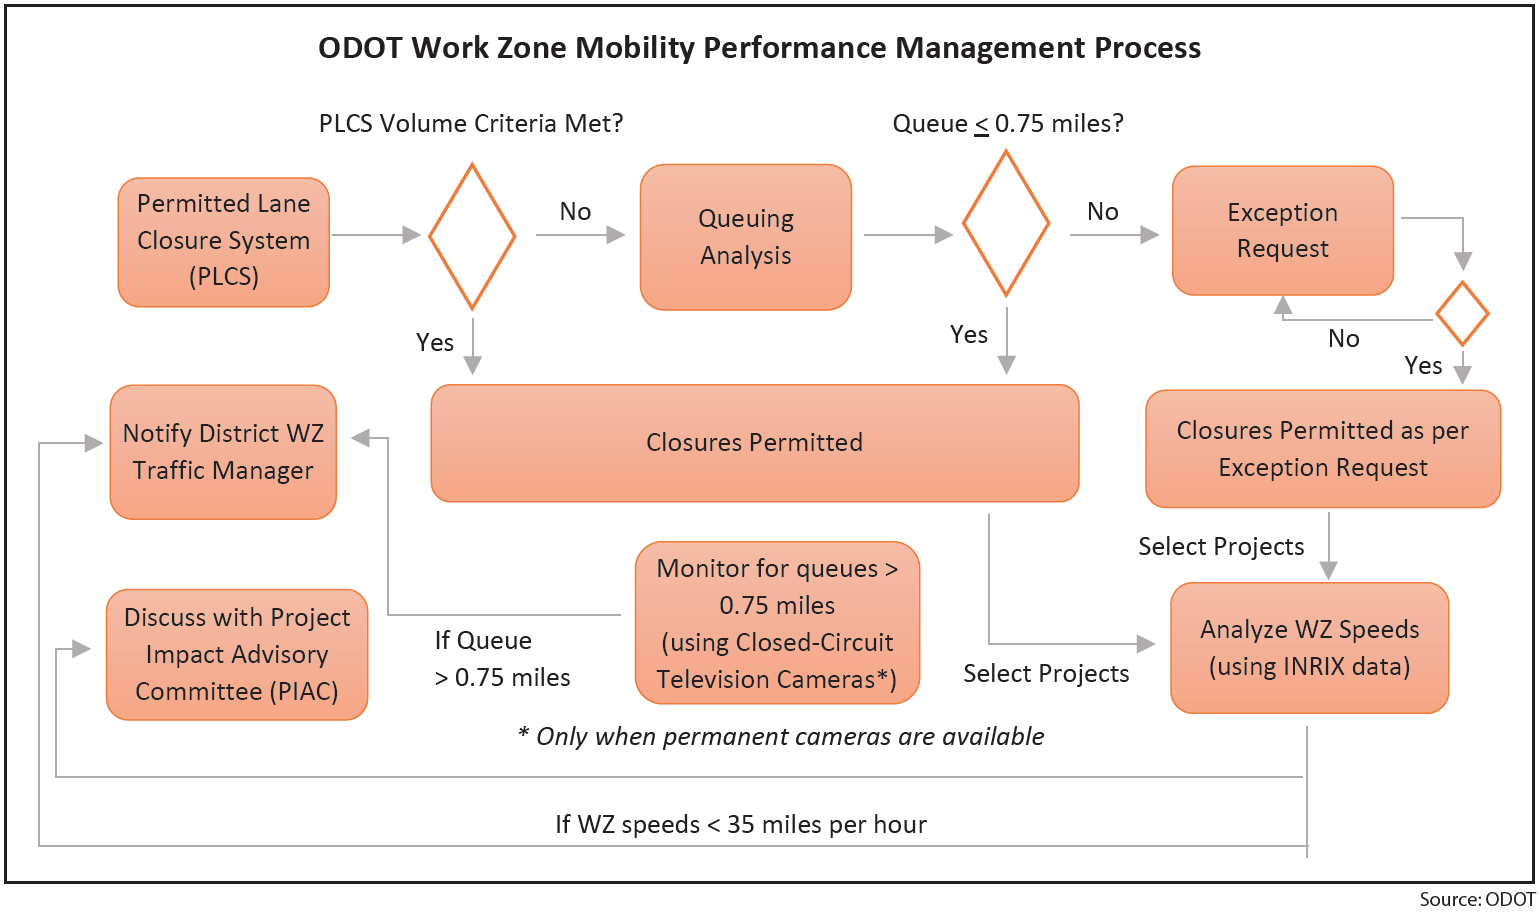
The flow chart below illustrates the ODOT policy requiring that all work zones conform to a permitted lane closure system (PLCS). This system sets volume thresholds for allowable lane closures by time of day. If the expected work zone traffic volume exceeds the PLCS thresholds, the project team must perform a queuing analysis. The allowable work zone queue length is 0.75 miles. If the project team estimates queues to be less than 0.75 miles, ODOT permits the closure. If the estimated queue is greater than 0.75 miles, the project team must submit an exception request to the ODOT Central Office along with appropriate queue and delay mitigation strategies. The policy-driven approach to work zone mobility management starts during project planning and extends into the construction phase of projects. During the construction phase, ODOT monitors work zone queues and speeds and takes appropriate informative or corrective action to improve mobility performance in work zones. At the core of ODOT's approach is a PLCS that allows a certain number of lanes to be closed for road work at certain times of day based on the estimated delay impacts of the closure.
Pre-Closure Analysis – Policy-Driven Lane Closures
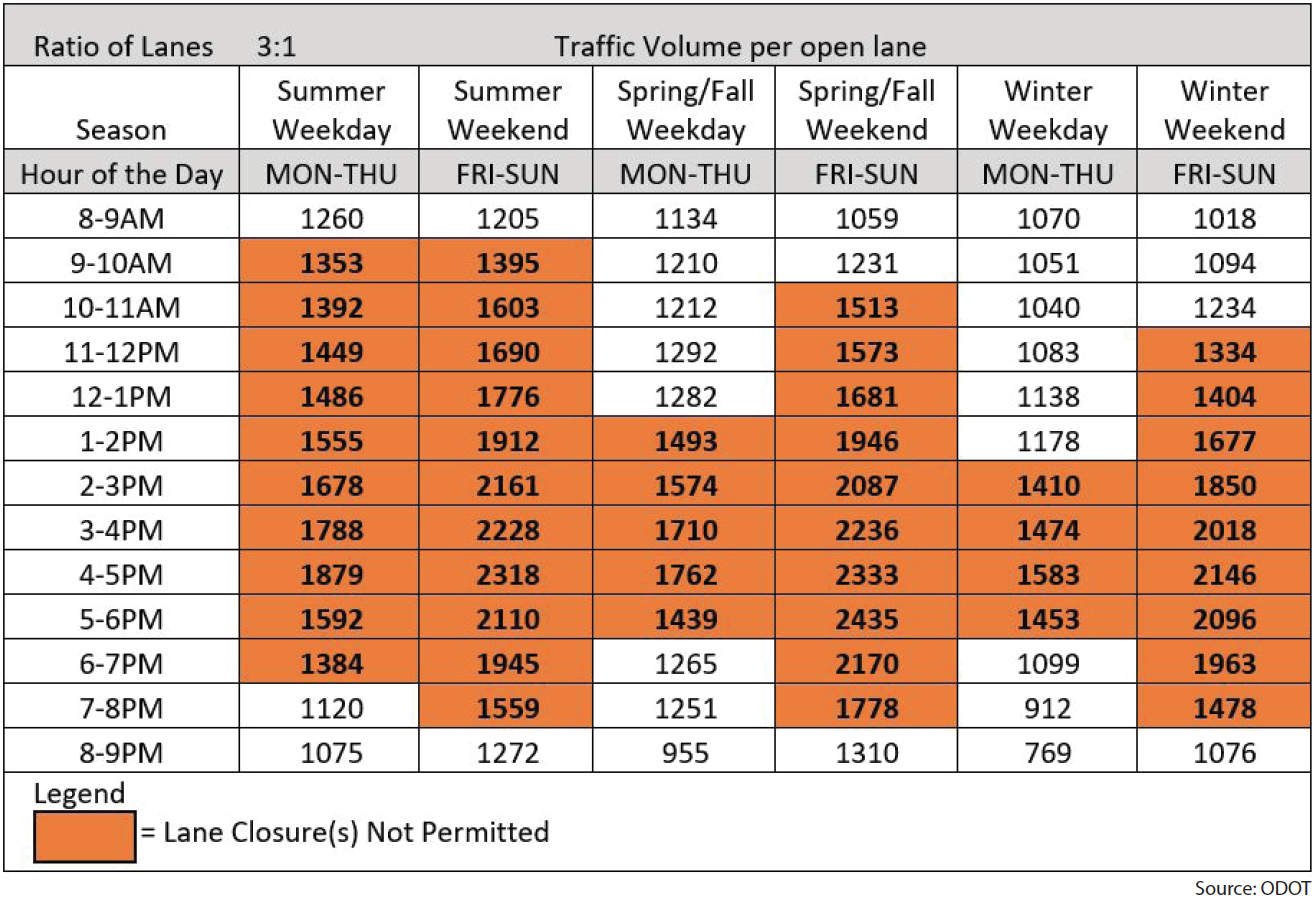
As per policy, for freeways, if the per lane volume exceeds the calculated capacity ranging from 1,000 to 1,490 vehicles per hour (VPH) (depending on truck percentages and terrain) then lane closures will not be permitted during that hour. If the PLCS shows that the volume will not exceed the capacity of the open lanes, crews may perform work during those hours, and the project team does not need to prepare a subsequent queue analysis or an exception request.
ODOT requires the use of the PLCS for all construction and maintenance work except in emergencies. The PLCS relies on volume count data from across the state. Every year, ODOT Central Office and District personnel update the data and methodology in the PLCS. ODOT is continually making the PLCS more accurate by incorporating newly available data.
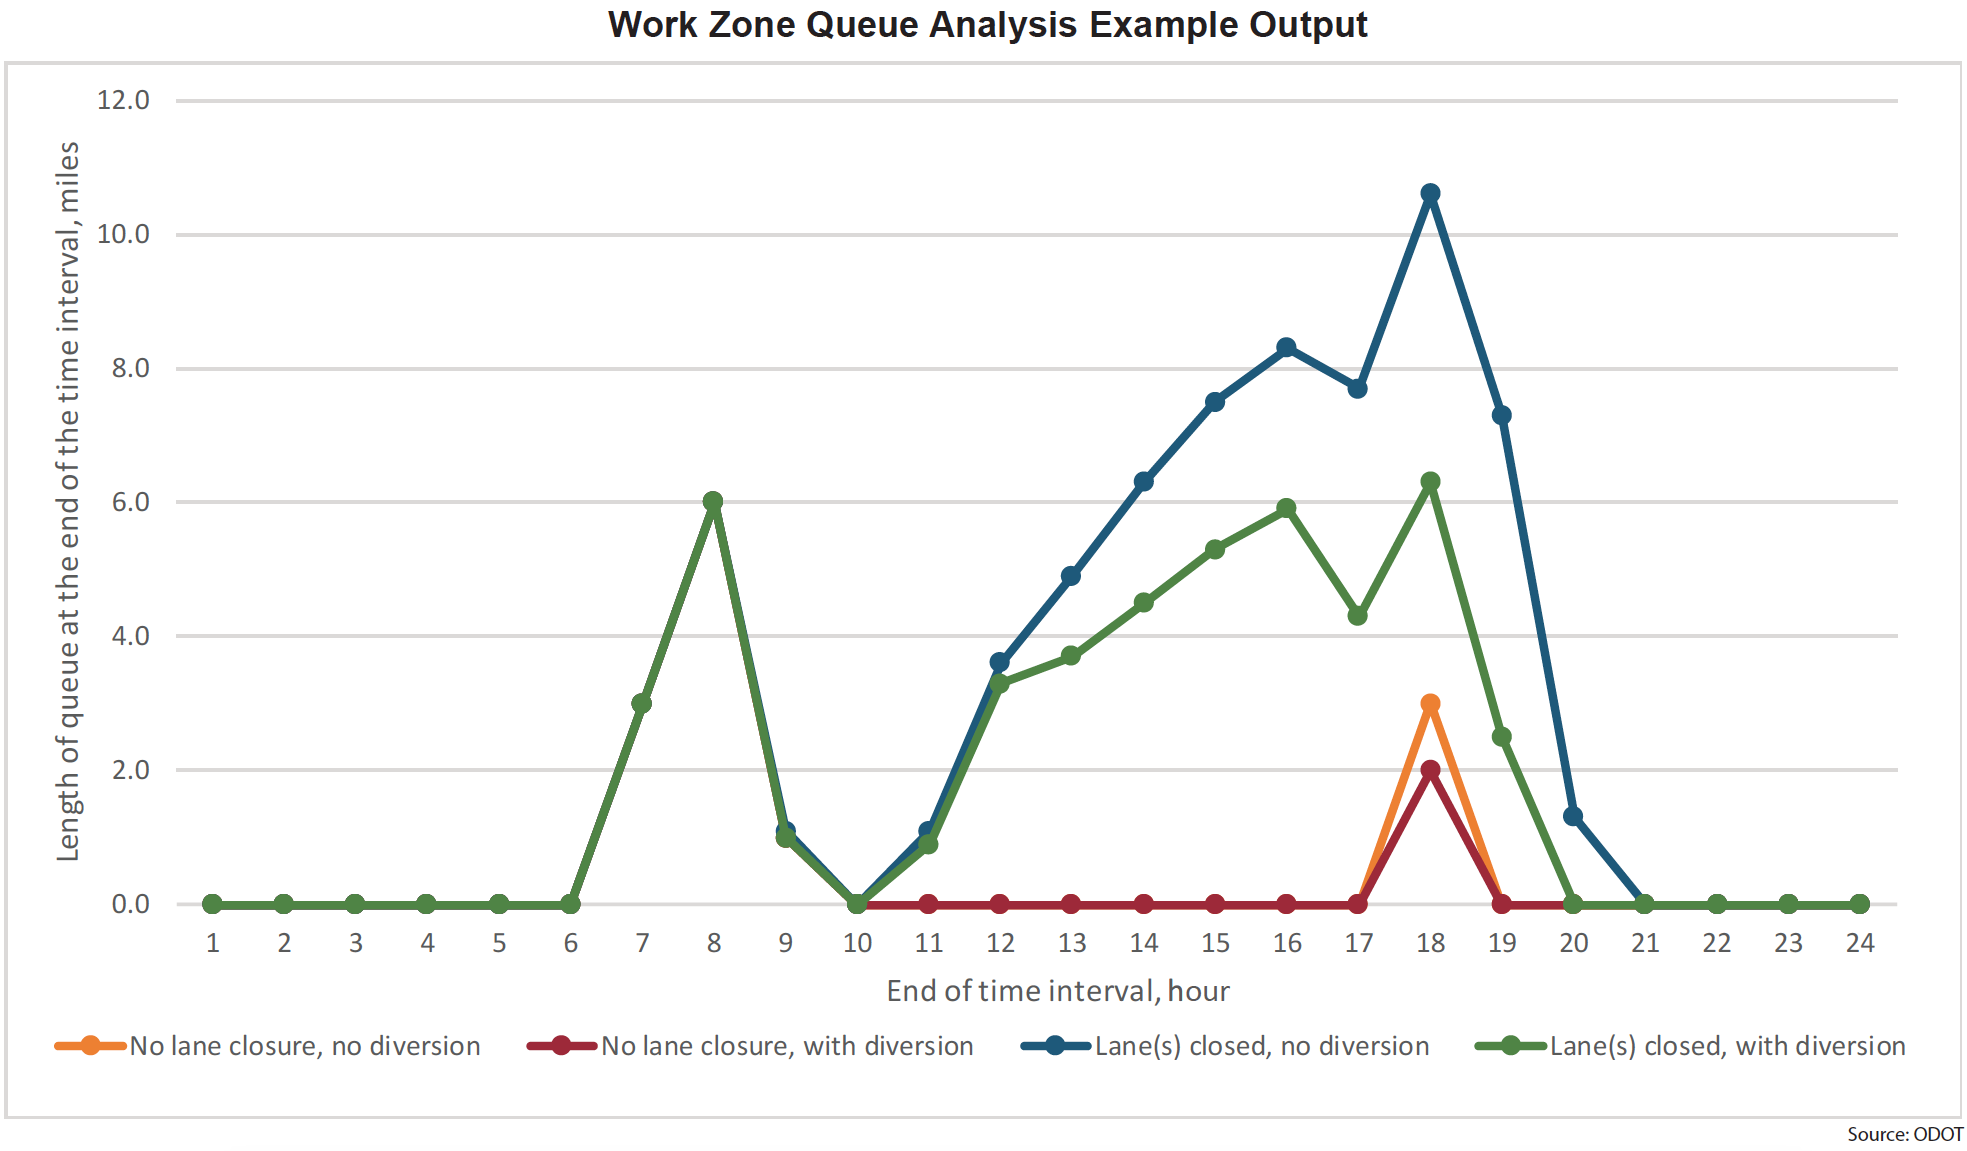
If a project violates the PLCS thresholds, the project team must perform a queueing analysis to verify the impacts. ODOT provides a Queuing Analysis Tool that allows the user to customize site- and project-specific inputs including free flow speed, diversion factors, and work intensity. The ODOT policy sets the threshold for predicted queue length at 0.75 miles. If the queue is less than or equal to this, crews may close the equivalent number of lanes that meet the queue threshold for an unlimited duration without additional restrictions. If the predicted queue length is greater than 0.75 miles, the project team must prepare and file an exception request with ODOT. Planners handle projects with smaller impacts on a case-by-case basis. For projects with predicted impacts exceeding the threshold, a larger, multidisciplinary committee works with the ODOT District team to develop appropriate mitigation strategies and develop the best course of action to manage the impacts.
Performance Monitoring – Enforcing and Managing the Policy Requirements
Performance monitoring during construction is a critical aspect of enforcing and managing the policy requirements for work zone mobility performance.
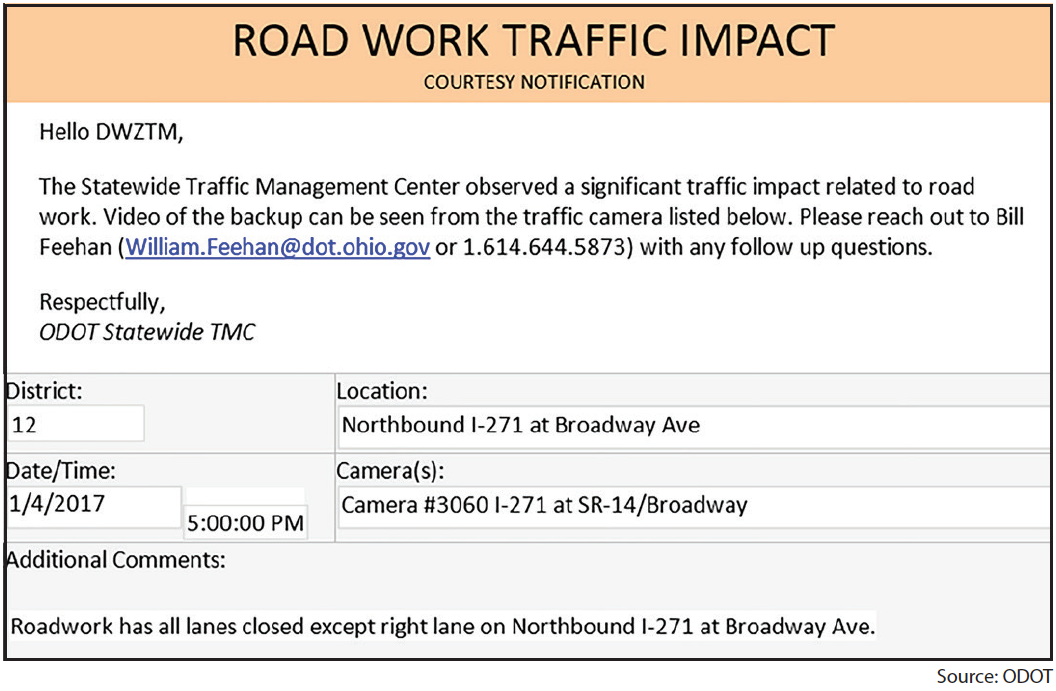
Road Work Traffic Impact Notification
The ODOT Statewide Traffic Management Center (TMC) monitors road projects with available closed-circuit television (CCTV) camera coverage. When managers see a significant queue (>0.75 mile) caused by work zone operations, with no approved exception on file, they send a notice to the respective ODOT District Work Zone Traffic Manager (DWZTM). Depending on the severity of the impact, the DWZTM may choose to suspend the work zone operation and reopen any closed lanes. If needed, the DWZTM instructs the project team to modify the PLCS and traffic management plan for the project to prevent queues from exceeding the threshold in the future.
Work Zone Speed Analysis
In addition to monitoring queues via CCTV, the ODOT Central Office work zone team conducts more in-depth speed analysis for key projects expected to have relatively higher impacts. These speed analyses draw upon INRIX probe vehicle data to track the times when work zone speeds drop lower than the ODOT performance threshold of 35 mph. Monitoring an average of about 25 to 30 projects each construction season, the team produces monthly reports.

The example figure above charts the number of hours that vehicles traveled less than 35 mph through one typical work zone during each month. The black vertical bars represent the limits of the work zone. The chart contains historic lines representing the same number of hours to that point in the two years prior to construction for comparison. In addition to plotting the speed data, these ODOT charts may also incorporate any contextual information (e.g., incidents, weather, special events) to provide insights into underlying issues that may affect work zone performance. The DWZTMs provide this contextual information.
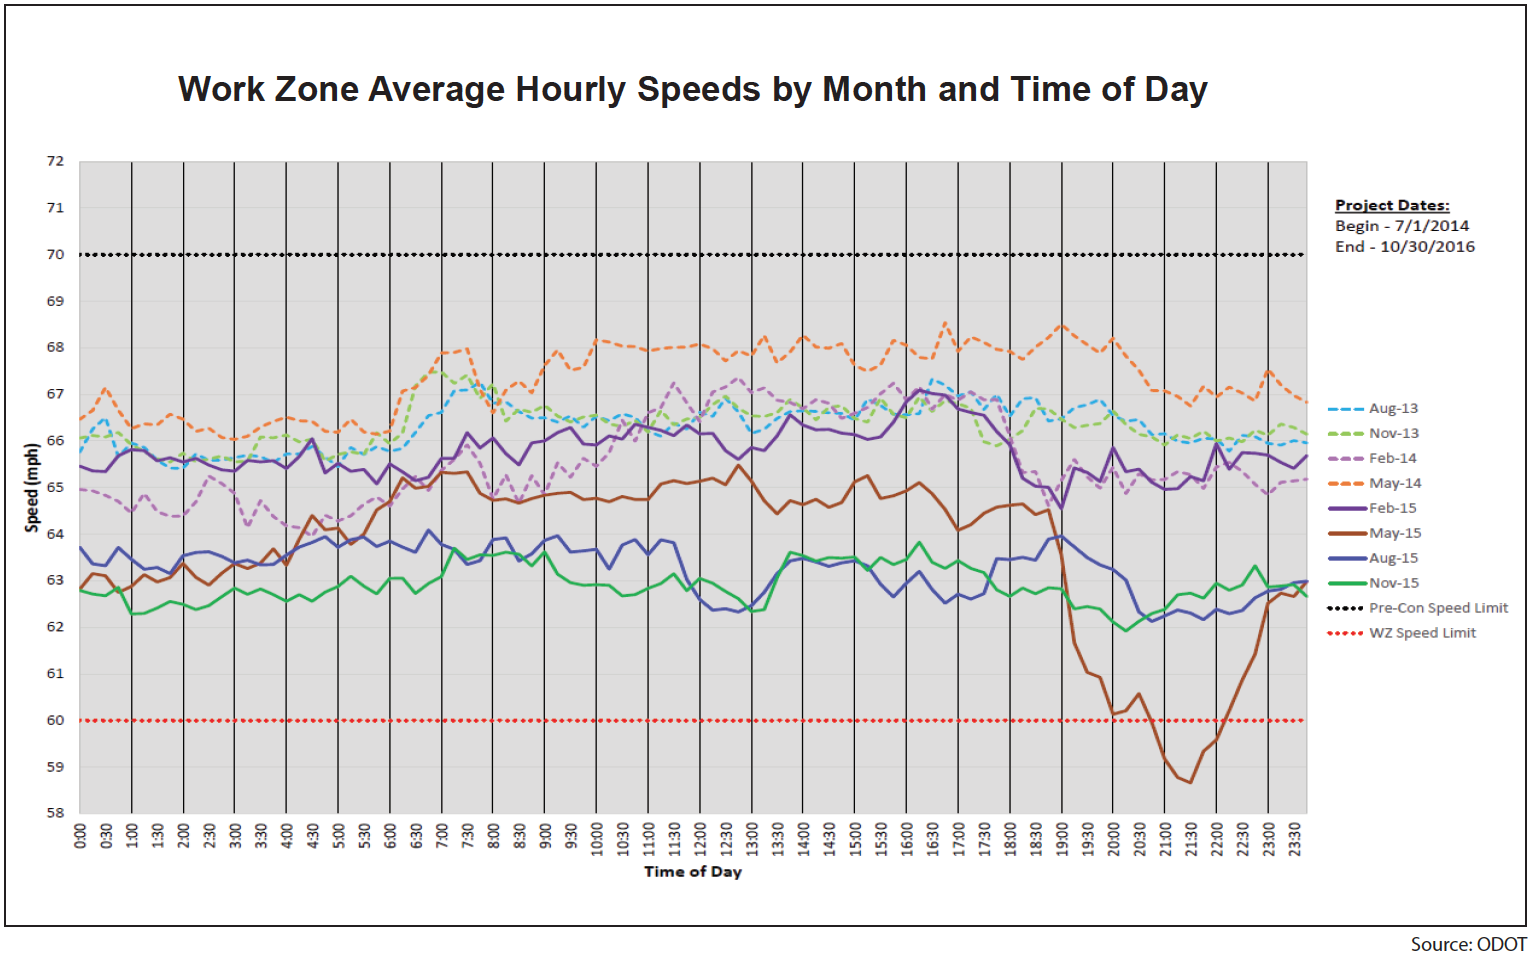
In addition to the monthly tally shown on the previous page, the ODOT Central Office work zone team plots the average hourly speeds for each work zone on a month-by-month basis (Image to the left). ODOT originally intended these hourly average speed plots to quantify the prevalence of motorists exceeding the speed limit in work zones; later the plots evolved into a tool for demonstrating and investigating why actual work zone speeds drop during certain times of day. As currently designed, this chart does not account for variable speed limits that are gradually being implemented for construction projects across the state.
Traffic managers evaluate the speed analysis charts monthly to identify any work zone performance issues. For example, in the case of the project shown in the figure above, ODOT determined that in May 2015 the project was closing lanes an hour earlier than called for in the plans, and hence speeds were lower in May than in some other months. This reduction in average hourly speeds is represented by a drop in the maroon line between 18:30 and 23:00 in the chart above.
INRIX (Kirkland, Washington) is a private-sector source that provides probe vehicle speed and travel time data and analytics as a commercial service. ODOT has a contract (through its Transportation Systems Management and Operations, or TSMO, program) with INRIX to provide speed and travel time data on Ohio roadways. The ODOT work zone management team is leveraging this data to not only monitor the performance of its work zones but also to conduct additional analysis and research to improve overall work zone management practices. This is an example of a State DOT work zone program piggybacking onto resources available through broader TSMO efforts.
Notice: The United States government does not endorse products or manufacturers. Trademarks or manufacturers' names appear herein only because they are considered essential to the object of this document.
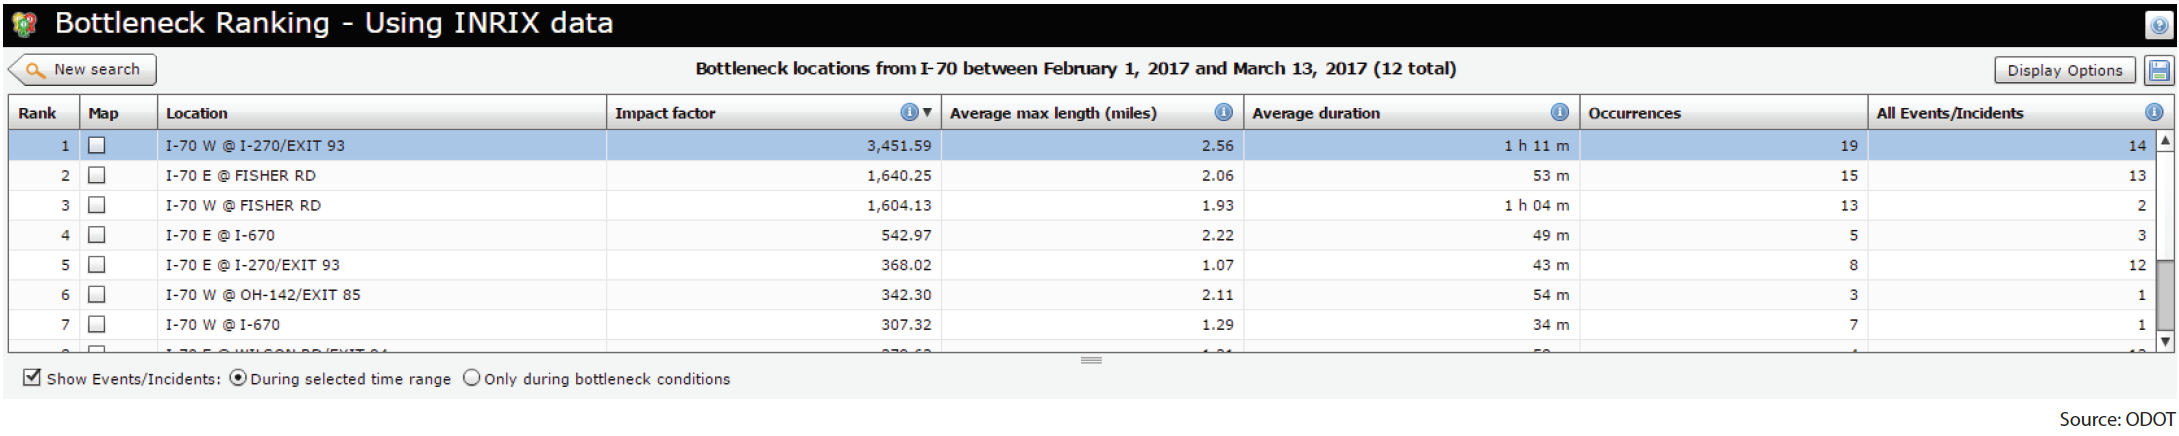
Weekend Bottleneck Reports
ODOT also uses an INRIX bottleneck reporting tool to produce reports on construction season work zone backups each weekend. Managers later cross-reference these report results with visual data from CCTV coverage (where available) to validate the INRIX results.
Crash Analysis
In addition to the mobility analysis reports, ODOT runs crash reports and charts for the same select projects every month. From a mobility standpoint, crash data can provide insights into mobility issues caused by incidents or work zone-specific issues that may be contributing to repeated mobility challenges. For reference, these reports identify the historical maximum and 3-year average numbers of crashes for a defined highway segment prior to construction. Managers can compare these values with the number of present-day crashes displayed throughout the corridor by month. ODOT also uses crash reports to investigate specific crash problems at work zones, because crashes have a direct effect on congestion.
Key Takeaways from ODOT's Work Zone Performance Management Program
- A systematic policy-based approach to work zone performance management allows ODOT to apply appropriate engineering and design checks and balances at all stages of project development. This approach helps ensure that the actual project implementation abides by the policy requirements and/or applicable exceptions for each project. Thresholds such as the 0.75-mile queue restriction and 35 mph speed threshold (lower limit)—along with preset standards for work zone capacity determination and hourly lane restrictions—provide a centralized reference for ODOT to monitor and track work zone performance across all 12 Districts.
- Performance management is a mindset that needs to permeate the culture of the organization and extend across all project development stages. State DOTs need to not only develop policies and requirements, but they also need to enforce the policies and manage performance proactively using appropriate monitoring, management, and analysis techniques.
- Probe vehicle data can provide both high-level and in-depth metrics for work zone performance management. Probe vehicles offer a relatively low-cost way to collect data that would otherwise be hard to obtain. Combining probe vehicle data with existing State DOT resources such as traffic count data, camera feeds, and tools such as the PLCS creates more opportunities to integrate and manage work zone performance. Increasingly, State DOTs are purchasing probe vehicle data for planning purposes and in support of broader TSMO efforts; and work zone program managers can piggyback their data needs onto such efforts.
- Start small and grow big. ODOT started its formal monitoring and monthly analysis efforts with a small crew of two to four
engineers at their Central Office. For larger projects, ODOT engaged the DWZTMs and stakeholders in other agency departments, such
as planning and design. Traffic managers leveraged available tools and data to kickstart the program. On average, it takes two
engineers about two weeks every construction season to set up the reports and about two days every month to extract the data
and produce the reports. Over time, ODOT made incremental improvements to processes and data. As they move forward,
ODOT is working on several improvements including:
- Enhancing their PLCS tool;
- Adding more granularity to their data by leveraging new INRIX data;
- Incorporating additional contextual information (e.g., incidents, special events, weather) into their project analyses; and
- Increasing their annual project coverage by automating their analysis efforts.
- Work zone performance measurement is not just about current projects: it is also about future practices and standards. In addition to using a performance-based approach to manage projects for a given construction season, ODOT also collects lessons learned information and leverages historical data to improve future practices for overall work zone planning, design, and construction. This feedback loop is critical to the department's work zone performance management program across the project life cycle.
For more information on ODOT's Policy Driven Approach for Work Zone Mobility Performance Management, contact Bill Feehan (William.Feehan@dot.ohio.gov) or Emily Willis (Emily.Willis@dot.ohio.gov).
Additional resources on work zone performance management can be found at: https://www.workzonesafety.org/swz/
For additional information, please contact the FHWA Work Zone Management Program: WorkZoneFeedback@dot.gov