Decision Support Framework and Parameters for Dynamic Part-Time Shoulder Use:
Considerations for Opening Freeway Shoulders for Travel as a Traffic Management Strategy
Chapter 2. What is Dynamic Part-Time Shoulder Use?
This chapter provides an overview of dynamic part-time shoulder use (D-PTSU). This active traffic management (ATM) strategy provides additional roadway capacity when realtime conditions warrant it and preserves the benefits of a full-width shoulder at other hours of the day. This chapter describes how D-PTSU works, intelligent transportation system (ITS) infrastructure needs, the advantages of D-PTSU over static part-time shoulder use (S-PTSU), the relative of challenges of D-PTSU compared to S-PTSU, and highlights example D-PTSU installations around the world.
Dynamic Part-Time Shoulder Use and Operations
The usage of shoulders as travel lanes for variable, rather than fixed, hours of the day started in Germany in 1996, and was next implemented in the Netherlands in 1999. The overall success of international implementations prompted their introduction in the United States. In 2009, D-PTSU was first implemented in the United States in Minneapolis, Minnesota on I-35W.
D-PTSU means that the shoulder is opened or closed as needed—typically in response to observed or anticipated congestion. It differs from S-PTSU where there are predetermined (fixed) hours of operations. S-PTSU was implemented in the United States beginning in the 1970s and remains more common than D-PTSU. Noteworthy facilities include the original I-66 facility in Virginia (subsequently converted to D-PTSU and removed in 2018 as part of a major widening project); the US 2 trestle in Everett, Washington; GA 400 in suburban Atlanta; and several freeways in the Boston area. With D-PTSU, there may be core hours of operations when congestion is likely, and the shoulder is always opened during that time, even with a dynamic system (Jenior, Dowling, Nevers, & Neudorff, 2016). Recent installations of PTSU in the United States have tended to be dynamic. In 2015, Georgia DOT implemented D-PTSU on I-85 and Colorado DOT implemented D-PTSU on a rural section of I-70 with peak periods on weekends. In 2017, Michigan DOT implemented D-PTSU on US 23 and Washington State DOT implemented D-PTSU on I-405. In 2018, the Illinois Tollway implemented D-PTSU on 16 miles of I-90. Like European agencies, agencies in the United States are increasingly starting with D-PTSU rather than S-PTSU, enabling the added flexibility of D-PTSU and associated off-peak benefits to be realized.
Reasons for implementing D-PTSU include:
- Routine recurring congestion that is less predictable in time of occurrence and length of occurrence than typical morning and evening peak hours due to commuter traffic.
- Seasonal congestion during weekends and holidays primarily due to recreational travel.
- Anticipated congestion due to special events or incidents.
- High frequencies of non-recurring congestion for other reasons.
- Ability to more effectively close the shoulder by LCS if an incident or emergency warrants it and revert to a safety shoulder.
Typically, D-PTSU is applied where the demand exceeds capacity at certain times during certain days of the week, such as bottlenecks or similar problem areas in the network where there is both recurring and non-recurring congestion (e.g., special events, extreme weather conditions, and seasonal traffic). D-PTSU enables PTSU benefits at hours outside of a fixed schedule.
Considerations related to drivers when planning implementation of D-PTSU (EasyWay, 2015) include:
- Driver expectancy – drivers accustomed to the shoulder being closed versus open during certain hours of the day, days of the week, or during special events, and seasons.
- Underutilization – drivers having adaptation concerns and not using the facility even though it is open.
- Overutilization – drivers using the shoulder when it is closed because they are adapted to using it at other times of the day when it is open.
Figures 2 through 5 show dynamic part-time shoulder use facilities in the United States and internationally.
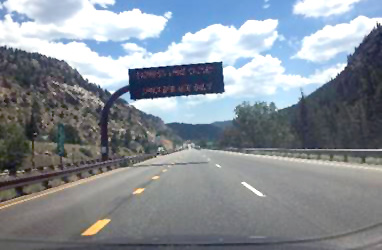
Source: © Kittelson & Associates, Inc.
Figure 2. Photo. Yellow dashed lines divide the left shoulder (used for part-time travel) from the general purpose lanes in Colorado.
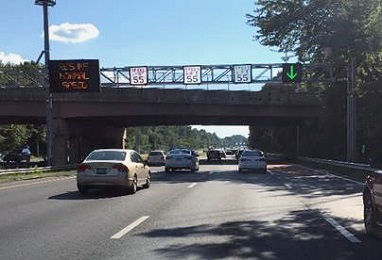
Source: © Kittelson & Associates, Inc.
Figure 3. Photo. A lane-use control sign (on the far right side) indicates whether the shoulder is open or closed to traffic.
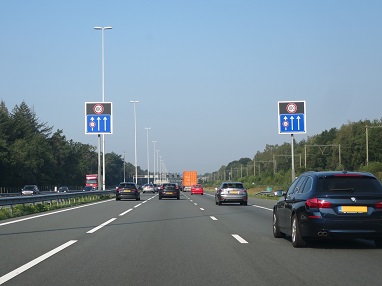
Source: © Justin Geistefeldt.
Figure 4. Photo. A left shoulder is available for travel on a dynamic part-time shoulder use facility in the Netherlands.
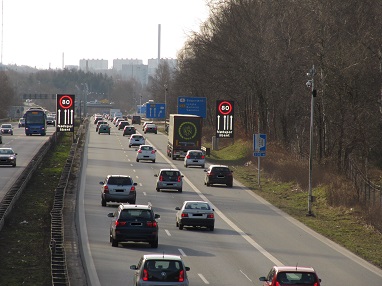
Source: © Danish Road Directorate (Vejdirektoratet).
Figure 5. Photo. A right shoulder is available for travel on a dynamic part-time shoulder use facility in Denmark.
Decision to Open/Close Dynamic Part-Time Shoulder
The decision to open a shoulder to traffic depends on several factors that can broadly be grouped into two categories: logistical or policy considerations and traffic operations considerations. Specific logistical or policy considerations for opening and closing a shoulder dynamically include:
- Core hours of operations. Many agencies always open the shoulder during the a.m. peak, the p.m. peak, or both on weekdays. Opening at these times is more a function of policy and driver expectancy than realtime speed and volume conditions on the roadway.
- Maximizing safety and driver compliance by not opening or closing the shoulder unnecessarily.
- Legislative restrictions on hours of operations or days of use (if any).
- Coordination and agreements with emergency responders.
- Coordination with an agency's own maintenance activities.
- The capabilities of the traffic management center (TMC). TMCs may not have sufficient staff at all hours of the day to open the shoulder. Additionally, a TMC that has full coverage of the shoulder via closed-circuit television (CCTV) may be able to open the shoulder more frequently and rapidly than an agency with limited CCTV coverage or a policy requiring a physical "sweep," or inspection, of the shoulder by a maintenance or law enforcement vehicle.
While safety is the primary reason to close the shoulder, the traffic engineering profession does not currently have sufficiently precise tools for predicting the safety effects of D-PTSU. Consequently, it is logically assumed there is a safety benefit to closing the shoulder to traffic during low volume periods when it has no meaningful impact on congestion, but the magnitude of this impact cannot be quantified at this time as there is little field data and predictive models haven't been completed. Specific factors that can help an agency determine when to open or close a shoulder dynamically include:
- Traffic volumes above or below a certain threshold.
- Vehicle operating speeds below/above a certain threshold.
- A combination of the two.
These conditions may be observed in realtime or anticipated based on historical performance. Typical thresholds and techniques for determining facility-specific values are presented in chapter 4.
The experience of the facility operators plays a key role in the decision to open and close the shoulder.
TMCs have generally relied on the experience of their operators to decide when to open and close D-PTSU lanes. This report is not intended to supplant that experience. Instead, this report provides information that inexperienced agency operators can use as a starting point for operating their D-PTSU, and which experienced operators can evaluate to see if they might improve the productivity of their D-PTSU.
Interviews were conducted with officials from State departments of transportation (State DOT) in the United States and agencies internationally as part of this project's research. Interviews provided the following observations:
- First and foremost, the experience of the facility operators plays a key role in the decision to open and close the shoulder. This is particularly true on older facilities where operators have many years of experience.
- For State agencies that use a decision-support algorithm to recommend D-PTSU open and close decisions, historical traffic volume information is considered before the thresholds are set within the software. These thresholds are based on either traffic volume or both traffic volume and vehicle speeds.
- The thresholds for traffic volume range from 1,400–1,500 vehicles per hour per lane (veh/h/ln) and the thresholds for vehicle speeds range from 45-55 miles per hour (mi/h). Agencies primarily use one of the following: a volume threshold, a flow threshold, or a combination of the two. The specifics of this were not obtained from agencies because they were contained within proprietary algorithms.
- Some agencies do not use any sort of realtime information to open and close D-PTSU. They maintain hours of operations that are nearly fixed, with planned deviations such as opening the shoulder earlier on Friday afternoon compared to other weekdays and opening for known special events. This is particularly true on shorter or newer facilities.
- For agencies that open the shoulder at any time in response to traffic conditions, such as the Hessen state in Germany, opening usually occurs within 5 minutes of speed and volume thresholds being exceeded.
- D-PTSU facilities on I-405 in Washington, US 23 in Michigan, and I-66 in Virginia use a combination of decision support algorithms, historical traffic volume information, and operator discretion to open and close the shoulder for traffic. D-PTSU was removed on I-66 as part of a permanent widening project during the time this report was being prepared.
- The criteria for opening and closing the shoulder on I-70 in Colorado is traffic volume, and the shoulder is only open during peak recreational periods such as weekends during ski season, Christmas week, and some summer weekends. Colorado legally limits the opening of D-PTSU to 100 days per year. Hence, historical traffic volume information and trends are greatly used in open-and-close decisionmaking for this facility, and once it is opened it is kept open all day unless an incident or inclement weather occurs. The shoulder is closed during heavy snowfall as a safety measure.
- Similar to the D-PTSU facilities in the United States, the criteria to open D-PTSU facilities in Europe is based on higher traffic volumes and lower vehicle operating speeds. Control systems recommend opening the shoulder before the expected breakdown. Shoulders are closed when volume decreases, crashes occur, or when disabled vehicles occupy the shoulder.
- European agencies do not usually have set hours of operations. There is little or no static part-time shoulder use in Europe, and agencies are more comfortable without core hours of operations.
- Positive or negative safety impacts have not been demonstrated clearly in the United States because many facilities opened recently and do not have enough data to carry out the analysis. The safety benefits from studies conducted on European D-PTSU facilities are reported later in this chapter. Highway agencies generally provide emergency turnouts along the roadway section with D-PTSU. These areas act as refuges for disabled vehicles and reduce the frequency of incident-related shoulder closures.
Known Deployments
The first known installation of D-PTSU was in the German state of Westphalia in 1996.
Table 2 lists known D-PTSU deployments in the United States as of May 2018.
D-PTSU was first implemented in the German state of North-Rhine Westphalia in 1996. It remains most common in Europe, with known applications in East Asia as well. The United Kingdom was once a key PTSU country but has migrated to a strategy called "All Lanes Running" that is more like converting the shoulder to a permanent lane. Table 3 lists known D-PTSU deployment internationally as of May 2018. Appendix B provides fact sheets for selected worldwide D-PTSU facilities and agencies.
| Location | Corridor | Length (mi) | Year | Shoulder Used | Max. Speed Allowed | Lane Width (ft) | Notes |
|---|---|---|---|---|---|---|---|
| Idaho Springs, Colorado | I-70 EB | 13.0 | 2015 | Left | Variable speed limit | 11 | Dynamically-priced lane, primarily used in ski season weekends and holidays and some summer weekends. Between US 40/Empire and Idaho Springs. Must be used less than 100 days a year per legislation. |
| Gwinnett County, Georgia | I-85 NB | 1.3 | 2015 | Right | Freeway posted speed | 11–12 | Initially opened with fixed hours of operations, now operated dynamically. Primarily used on weekday afternoons. Auxiliary lane between two interchanges. |
| Ann Arbor, Michigan | US 23 | 8.5 | 2017 | Left | Variable speed limit (~60 mi/h) | 11–12 | Between M-14 and M-36 in both directions. Primary used in morning and afternoon peaks |
| Minneapolis, Minnesota* | I-35W NB | 3.0 | 2009 | Left | Freeway posted speed | 11–12 | Priced Lane located at end of managed lane on I-35W northbound between 42nd Street and downtown Minneapolis was routinely opened on weekends and throughout daytime on weekdays. Now removed as part of a major widening project. |
| Fairfax County, Virginia** | I-66 | 6.5 | 2015 | Right | Variable speed limit | 12 | Was static from 1992–2015, and dynamic from 2015–2018. From 2015–2018 it was routinely opened in the off-peak direction and on weekends. Extended in both directions from US 50 to I-495 and roadway had HOV lane on the left side. Now removed as part of major widening project |
| Lynnwood, Washington | I-405 NB | 1.8 | 2017 | Right | Variable speed limit | 13 | Between SR 527 interchange and I-5 interchange. Open during core hours in afternoon peak. Core hours begin earlier on Friday year-round and on Thursday in the summer. |
| Chicago, Illinois | I-90 | 16 | 2017 | Both | Freeway posted speed | 12 | Shoulders are not routinely opened (except to buses) but can be opened any time for incident management purposes. Between I-294 and Barrington Road in both directions on Jane Addams Tollway |
* I-35W was removed in 2018 as part of major widening projects.
** I-66 was removed in 2018 as part of major widening projects.
| Location | Corridor | Length (mi) | Year | Notes |
|---|---|---|---|---|
| Germany:Baden–Wuerttemberg | A 8 | 2.6 | 2013 | Stuttgart interchange – Stuttgart–Moehringen (both directions) |
| Germany: Bavaria | A 8 | 6.1 | 2005 | Hofoldinger Forst – Holzkirchen |
| A 8 | 9.8 | 2007 | Holzkirchen – Munich–South interchange | |
| A 9 | 18.9 | 2012–2017 | Holledau interchange – Neufahrn interchange (both direct.) | |
| A 73 | 6.8 | 2008 | Forchheim-South – Erlangen–North | |
| A 99 | 11.1 | 2001–2005 | Munich–North interchange – Haar (both directions) | |
| Germany: Hessen | A 3 | 6.7 | 2001 | Hanau – Offenbach (both directions) |
| A 3 | 2.8 | 2004/2007 | Kelsterbach – Moenchhof interchange (both directions) | |
| A 3 | 4.9 | 2015 | Limburg-North – Diez | |
| A 5 | 11.5 | 2003 | Friedberg – Frankfurt North–West interchange (both direct.) | |
| A 5 | 2.1 | 2008 | Frankfurt interchange – Frankfurt–Niederrad | |
| A 5 | 3.9 | 2010 | Darmstadt–Eberstadt – Darmstadt interchange (both direct.) | |
| Germany: Lower Saxony | A 7 | 20.1 | 2005 | Soltau–Ost – Walsrode interchange (both directions) |
| Germany: North Rhine-Westphalia | A 4 | 1.0 | 1996 | Refrath – Cologne–Mehrheim |
| A 45 | 1.9 | 2014 | Schwerte/Ergste – Westhofen interchange | |
| A 57 | 1.9 | 2011 | Cologne–Longerich – Cologne–Bickendorf | |
| Germany: Rhineland–Palatinate | A 63 | 5.6 | 2011 | Saulheim – Mainz–South interchange (both directions) |
| The Netherlands | A1 | 2.9 | 2011 | Bussum – kp.Eemnes |
| A1 | 2.8 | 2011 | kp.Eemnes – Bussum | |
| A1 | 4.4 | 2008 | kp. Hoevelaken – Barneveld | |
| A2 | 9.5 | 2011 | kp.Vonderen – Urmond | |
| A2 | 10.2 | 2011 | Urmond – kp.Vonderen | |
| A4 | 0.9 | 2005 | Leidschendam – kp.Prins Clausplein | |
| A12 | 0.5 | 2005 | knp.Prins Clausplein – Voorburg | |
| A4 | 1.5 | 2011 | kp.Nieuwe Meer – kp.Badhoevedorp | |
| A10 | 1.7 | 2011 | kp.Amstel – kp.Nieuwe Meer | |
| A4 | 1.6 | 2011 | kp.Badhoevedorp – kp.Nieuwe Meer | |
| A10 | 2.2 | 2011 | kp.Nieuwe Meer – kp.Amstel | |
| A8 | 0.8 | 2007 | kp.Zaandam – kp.Zaandam | |
| A7 | 4.8 | 2007 | kp. Zaandam – Purmerend-Zuid | |
| A7 | 5.5 | 2015 | Purmerend – kp. Zaandam | |
| A8 | 0.9 | 2015 | kp. Zaandam – Oostzaan | |
| A9 | 3.9 | 2011 | kp. Rottepolderplein – Velsen | |
| A9 | 4.8 | 2011 | Velsen – kp.Raasdorp | |
| A9 | 5.5 | 2011 | Uitgeest – Alkmaar | |
| A9 | 6.2 | 2011 | Alkmaar – Uitgeest | |
| A13 | 3.1 | 2007 | Berkel en Rodenrijs – Delft – Zuid | |
| A15 | 0.5 | 1999 | Papendrecht – Sliedrecht–West | |
| A27 | 3.1 | 2011 | kp.Everdingen – Houten | |
| A50 | 11.7 | 2006 | kp.Waterberg – kp.Beekbergen | |
| A50 | 11.7 | 2006 | kp.Beekbergen – kp.Waterberg | |
| A1 | 8.6 | 2006 | kp.Beekbergen – Deventer – Oost | |
| A1 | 7.6 | 2006 | Deventer – Oost – knp.Beekbergen | |
| A12 | 14.6 5.1 |
2012 2009 |
Bunnik – Veenendaal West Veenendaal West – Ede |
|
| A12 | 4.3 15.1 |
2009 2012 |
Ede – Veenendaal West Veenendaal West – Bunnink |
|
| A12 | 6.6 | 2010 | Zoetermeer – kp.Gouwe | |
| A12 | 1.5 6.9 2.5 |
2010 2010 2011 |
Afrit Gouda – kp.Gouwe kp.Gouwe – Zoetermeer Zoetermeer – Zoetermeer–Centrum |
|
| A20 | 1.8 | 2006 | R'dam Pr. Alexander – kp.Terbregseplein | |
| A27 | 3.1 | 1999 | Houten – kp. Everdingen | |
| A27 | 3.4 | 2006 | kp.Gorinchem – Noordeloos | |
| A28 | 3.9 | 2004 | Zwolle–Zuid – Ommen | |
| A28 | 3.8 | 2004 | Ommen – Zwolle-Zuid | |
| A28 | 2.6 | 2013 | Leusden Zuid – kp.Hoevelaken | |
| A28 | 3.6 | 2013 | kp.Hoevelaken – Leusden Zuid | |
| A15 | 1.9 | 2015 | Trentweg – Welplaatweg | |
| A15 | 1.9 | 2015 | Welplaatweg – Trentweg | |
| Denmark | M13 | 1.2 | 2016 | Hillerød Freeway b/n Junction 8 and Junction 6 |
| South Korea | R 1 | 64.7 | Unknown | Gyeongbyu Expressway |
| R 100 | 1.3 | Unknown | Seoul Belt/Ring Expressway | |
| R 50 | 32.9 | Unknown | Yeongdong Expressway | |
| R 15, 50, 110 | 11.0 | Unknown | Seohaean Expressway | |
| R 10, 102 | 0.8 | Unknown | Namhae Expressway | |
| R 45 | 1.1 | Unknown | Jungbu Naeryuk Expressway | |
| R 55 | 6.2 | Unknown | Jungang Expressway | |
| United Kingdom | M42, J3, A7 | 11 | 2006 | 40 km deployed, 400 km of HSR identified by Highways Agency |
| France | A4 – A86 | 1.4 | 2005 | |
| A3 – A86 | Unknown | Unknown | ||
| A48 | Unknown | Unknown | ||
| A1 | Unknown | Unknown |
Note: German implementations in Baden-Wuerttemberg, Bavaria, and Hessen have a variable speed limit. The other German implementations have a maximum speed limit of 100 km/h (62.13 mi/h).
D-PTSU = dynamic part-time shoulder use.
Dynamic Part-Time Shoulder Use Research
This section includes a summary of the operational and safety analysis findings of the dynamic part-time shoulder deployment in the United States and internationally.
Operations
A study conducted in Germany reported a 20–25 percent increase in the capacity of a freeway after the implementation of D-PTSU (Geistefeldt J., 2012). The freeway has three general purpose lanes per direction, which the shoulder providing a fourth lane when it is open.
The German Highway Capacity Manual includes the design capacities for freeways with D-PTSU presence internal and external to the urban areas (FGSV, 2015). The design capacities in vehicles per hour (veh/hr) for basic freeway segments with a gradient of less than or equal to 2 percent with the presence of D-PTSU are:
- Two lanes plus PTSU in a rural area: 4,200 veh/hr to 4,700 veh/hr.
- Two lanes plus PTSU in an urban area: 4,400 veh/hr to 5,200 veh/hr.
- Three lanes plus PTSU in a rural area: 5,600 veh/hr to 6,300 veh/hr.
- Three lanes plus PTSU in an urban area: 6,000 veh/hr to 7,000 veh/hr.
In each case above, the lower capacity value reflects a heavy vehicle percentage of approximately 30 percent, and the higher capacity value reflects a heavy vehicle percentage of approximately 5 percent. The number of lanes reflects the number of lanes in one direction not including a part-time lane on the shoulder.
A study conducted in Denmark reported that the average travel time was reduced by 1-3 minutes on a 9.32-mile section from Allerod to Motorring 3, and 5 minutes on a 7.45-mile section towards junction 6. The traffic volume on the freeway increased after D-PTSU opened, and much of the traffic shifted from local roads onto the freeway (Danish Road Directorate, 2016).
Colorado DOT found there was a 14 percent increase in the throughput, a 38 percent improvement in travel time in general purpose lanes, and an 18 percent increase in the average vehicle speeds across all lanes of eastbound I-70 during high traffic volume periods on the weekends after D-PTSU was implemented (CDOT, 2017).
Safety
The study results in this section are categorized into three types based on findings: positive impacts on safety, negative impacts on safety, and challenges regarding the safety performance evaluation of D-PTSU facilities. The majority of safety studies conducted in Germany and the Netherlands indicated that D-PTSU has a positive effect on safety, but studies in the United States have had more mixed results.
A before-after safety study on freeway A3 in the Hessen state of Germany reported there has been a nearly constant crash rate on the D-PTSU segment, whereas fewer upstream crashes, specifically congestion-related (i.e., rear-end) crashes, occurred after D-PTSU implementation (Geistefeldt J., 2012). The crashes were disaggregated into personal injury and property damage only crashes for this analysis. By reducing queuing and increasing speed through a bottleneck area, researchers noted that D-PTSU can reduce upstream congestion-related crashes. This positive safety finding led Hessen to implement D-PTSU on other freeways. (Jones, Knopp, Fitzpatrick, & et. al., 2011).
The majority of safety studies conducted in Germany and the Netherlands indicated that D-PTSU has a positive effect on safety, and U.S. studies have had mixed results.
A study in the Netherlands in 2007 found that D-PTSU reduced crash frequency by 25-28 percent due to the reduction in the upstream congestion. During "low-" and "high-" volume situations, the study from the Netherlands found a D-PTSU lane on the right is more crash-prone than a general-purpose lane. Like the United States, drivers in the Netherlands drive on the right side of the road. However, D-PTSU has safety benefits when there is a "medium" traffic volume (the study does not specify what constitutes high, medium, and low volumes), which has been observed in other countries as well (Rijkswaterstaat, 2007). A later study in the Netherlands noted that traffic on a right shoulder tends to travel more slowly than traffic in general-purpose lanes, but traffic on a left shoulder tends to travel faster than traffic in general-purpose lanes. Despite the higher speeds, the left shoulder tends to have fewer crashes because there are no conflicts with ramp traffic.
A study conducted on a segment of I-66 in Virginia reached similar conclusions: crash frequency dropped by 8 percent after S-PTSU to D-PTSU conversion. This study involved a before-after safety analysis using crash data for 1 year before and after September 2015, when conversion of the facility from S-PTSU to D-PTSU occurred. The segment has a left-side high-occupancy vehicle (HOV) lane and right-side D-PTSU. The crash modification factors (CMFs) for all severities of crashes are:
- 0.75 for all crash types.
- 0.71 for multiple-vehicle crashes.
- 0.69 for rear-end crashes.
The CMFs for fatal and injury crashes are:
- 0.69 for all crash types.
- 0.59 for multiple vehicle crashes.
- 0.61 for rear-end crashes (Suliman, 2017).
Some safety studies concluded that there are negative effects in the safety performance between the hours when the part-time shoulder use was open and closed to traffic. An older study on the shoulder use segment on I-66 in Virginia when it was an S-PTSU facility stated that, for the crashes specific to the right shoulder, motorists' behaviors at the merge and diverge areas during adverse light conditions are significant, and there was an increase of about 38 percent in all crashes (Lee, Dittberner, & Sripathi, 2007).
Following the implementation of D-PTSU on I-35W, Minnesota DOT observed that rear-end crash frequency increased in certain roadway sections in the D-PTSU region. Additional analysis showed that the observed increase in the crash frequency was attributed to the change in traffic volume and traffic patterns. The analysis also indicated no direct effect on the likelihood of rear-end crashes due to the operations of the D-PTSU lane (Davis, 2017).
The challenges in evaluating safety performance of those segments with D-PTSU installations include a lack of crash data for evaluation and changes in volume after the D-PTSU opened. Most of the D-PTSU segments in the United States are relatively short and have been implemented in the last few years. Hence, there is limited crash data for identifying the trends in the safety performance of the roadway with D-PTSU. For example, Washington State DOT (WSDOT) reported that in the first 5 months of D-PTSU operations on northbound I-405 between SR 527 and I-5, 11 incidents were reported on the roadway section, including 4 crashes, 6 disabled vehicles, and 1 unclassified incident (Hanson & Westby, 2017). However, this is not enough data to identify the trends in the safety performance of the D-PTSU segment.
Currently, the National Cooperative Highway Research Program is conducting research under Project 17-89, Safety Performance of Part-time Shoulder Use on Freeways. A report on the findings is expected to be available in 2020.
Advantages and Challenges of D-PTSU Over S-PTSU
S-PTSU has several traffic operational benefits over a conventional shoulder that is closed to traffic at all times (24/7). These benefits apply to peak congestion hours, typically on weekdays. D-PTSU expands the operational benefits of S-PTSU beyond recurrent weekday peak congestion hours to the rest of the day and throughout the week, including weekends.
D-PTSU expands the operational benefits of S-PTSU beyond recurrent weekday peak congestion hours to the rest of the day and throughout the week.
S-PTSU requires adequate horizontal, vertical, and lateral geometry for traffic operations on the shoulder. The pavement structural section and drainage should be adequate to accommodate the expected traffic loads to the operating agency's satisfaction. S-PTSU reduces the shoulder space available for breakdowns, emergency response, incident clearance, enforcement, crash investigations, and emergency maintenance during the hours of the day when the S-PTSU is open. In addition, when snow is present S-PTSU increases the freeway cross-section that should be plowed and decreases the space available for temporary snow removal storage.
D-PTSU has the same needs and challenges as S-PTSU, extending those same challenges to additional hours and days of the week. In addition, D-PTSU requires a level of traffic management infrastructure and organization much greater than that required by S-PTSU. Agencies should have advanced facility monitoring, maintenance, and operations capabilities on the facility. In addition, facility operations, maintenance, emergency response, and enforcement operations should be well coordinated at all times when the possibility of opening the shoulder exists.
Costs of Dynamic Part-Time Shoulder Use
Table 4 provides a list of the potential cost component considerations for D-PTSU and S-PTSU. This list is based on a review of prior Federal Highway Administration (FHWA) documents and outreach to agencies operating D-PTSU facilities.
Part-time shoulder use is one of the strategies addressed by the Tool for Operations Benefit-Cost (TOPS-BC), a spreadsheet-based tool developed by FHWA for benefit-cost analysis. Part-time shoulder use is identified in TOPS-BC as "Advanced Transportation Demand Management Hard Shoulder Running." The user will likely need to modify default unit costs and add inputs to address the specifics of any particular location and application. See the FHWA report on the Use of Freeway Shoulders for Travel for more information on cost-benefit analysis.
| Cost Component | D-PTSU | S-PTSU |
|---|---|---|
| Capital Cost Component | ||
| System engineering process activities | Typically needed | Typically needed |
| Shoulder reconstruction, widening | Sometimes needed | Sometimes needed |
| Emergency turnout construction | Sometimes needed | Sometimes needed |
| Ramp widening/improvements | Sometimes needed | Sometimes needed |
| Gantry structure spanning roadway or cantilever structure | Typically needed | Sometimes needed |
| Pavement marking modifications | Typically needed | Typically needed |
| Initial training of operations/maintenance personnel, law enforcement, and others as needed. | Typically needed | Typically needed |
| Public outreach/communication campaigns | Typically needed | Typically needed |
| ITS Capital Cost Components | ||
| Speed sensors, vehicle detectors, travel time indicators | Typically needed | Not needed |
| Camera/surveillance system | Typically needed | Sometimes needed |
| Dynamic/Changeable Message signs | Typically needed | Sometimes needed |
| Overhead lane use control signals | Potentially needed to supplement dynamic/changeable message signs | Not needed |
| Variable speed limit sign system | Sometimes needed | Sometimes needed |
| Controllers | Typically needed | Not needed |
| Communications and power software | Typically needed | Not needed |
| Central hardware and TMC enhancements | Typically needed | Not needed |
| Ongoing Operations/Maintenance Components | ||
| Additional TMC staff or hours of staffing | Typically needed | Sometimes needed |
| Emergency patrols | Typically needed | Typically needed |
| Upgraded/enhanced level of enforcement | Typically needed | Typically needed |
| Training for operations/maintenance personnel and law enforcement | Typically needed | Typically needed |
| Pre-Opening Sweeps | Typically done in the field or remotely with CCTV | Typically done in the field or remotely with CCTV |
| Maintenance and snow removal similar to general purpose lane | Typically needed | Typically needed |
| Ongoing maintenance costs and replacement costs of signs, structures, pavement marking, etc. | Typically needed | Typically needed, but quantity of equipment may be less |
| Upgraded TMC operations – Integrated operator, first responder, maintenance, and enforcement communications | Typically needed | Sometimes needed |
| Upgraded operating procedures | Typically needed | Sometimes needed |
| Upgraded ITS maintenance program/ongoing maintenance and replacement costs of all ITS-related equipment and infrastructure | Typically needed | Sometimes needed |
CCTV = closed circuit television. ITS = intelligent transportation systems. TMC = transportation management center.
Source: Adapted from FHWA. 2015. Use of Freeway Shoulders for Travel – Guide for Planning, Evaluating, and Designing Part-Time Shoulder Use as a Traffic Management Strategy, FHWA-HOP-15-023, Washington, DC. Tables 8 and 9, available at: https://ops.fhwa.dot.gov/publications/fhwahop15023/index.htm, last accessed February 20, 2019.
Michigan DOT (MDOT) and WSDOT provided general cost estimates from their experiences with D-PTSU. MDOT provided the research team with the bid tab summary report for the US 23 project. The research team also reviewed the 2018 Weighted Average Item Price Report on MDOT's website. MDOT found that for a 17 mile-project on US 23 that used 1/2-mile gantry spacing, the overall ITS system cost approximately $17 million. This translates to roughly $500,000 per gantry location (Palmer, 2018). WSDOT reported an estimated cost of $200,000-$300,000 per location using a signal pole/mast arm system instead of gantries. WSDOT's advanced transportation management software was written and modified for dynamic shoulder lane use in-house and was not included with the estimated costs (Dang, 2018). According to WSDOT's 2010 Congestion Report Gray Notebook Special Edition, a "smarter highways" gantry with variable message and speed signs like those often used with D-PTSU included can range from $650,000 to $900,000 (FHWA, 2018).
The research team also reviewed Virginia DOT's pay item list of statewide averages for May 1, 2016, through June 1, 2018, and the FHWA Intelligent Transportation Systems Joint Program Office Cost database.
Table 5 lists some estimated cost ranges associated with some of the main items necessary for D-PTSU projects. Each project and location will have unique characteristics and design requirements, but these ranges can provide an initial or planning-level viewpoint for agencies as they consider this strategy.
| Component | Estimates | Sources/References |
|---|---|---|
| Gantry structure spanning roadway or cantilever structure | $200,000–$400,000 each | MDOT |
| Speed sensors, vehicle detectors, travel time indicators | $5,000–$20,000 each | MDOT; FHWA-HOP-13-029; ITS-JPO Costs Database for Roadside Detection |
| Camera/surveillance system | $10,000–$20,000 each | MDOT; VDOT; ITS-JPO Costs Database for Roadside Detection |
| Dynamic/changeable message signs | $160,000–$220,000 each | MDOT; VDOT |
| Overhead lane use control system | $30,000–$60,000 each (1-panel system) $100,000–$170,000 each (3-panel system) |
MDOT |
| Variable speed limit sign system | $50,000-$250,000 | Rural Intelligent Transportation Systems (ITS) Toolkit, Variable Speed Limit |
| Controllers | $15,000–$25,000 | ITS-JPO Cost Database – DMS sign controller (Colorado DOT); MDOT |
CDOT = Colorado Department of Transportation. DMS = dynamic message signs. ITS-JPO = Intelligent Transportation Systems Joint Program Office. MDOT = Michigan Department of Transportation. VDOT = Virginia Department of Transportation.
Note that these cost estimates are based on averages reported in the FHWA JPO Costs Data Base and construction on specific projects completed in Michigan and Virginia over the period 2010 to 2016. They reflect the specific conditions of those designs, localities and periods of time.