National Work Zone Awareness Week
Work Zone Safety: Drive Like You Work Here
Printable version [PDF 2.4 MB]
You may need the Adobe® Reader® to view the PDFs on this page.
Contact Information: Operations Feedback at OperationsFeedback@dot.gov

U.S. Department of Transportation
Federal Highway Administration
Office of Operations
1200 New Jersey Avenue, SE
Washington, DC 20590
ops.fhwa.dot.gov
FHWA-HOP-19-027
January 2019
April 8–12, 2019
Work Zone Awareness Campaign
Since 2000, the Federal Highway Administration (FHWA) and its partners have sponsored National Work Zone Awareness Week, an annual spring campaign held at the start of construction season to encourage safe driving through highway work zones.
Work zones play a key role in maintaining and upgrading our Nation's roadways. Unfortunately, daily changes in traffic patterns, narrowed rights-of-way, and other construction activities often create a combination of factors resulting in crashes, injuries, and fatalities. These crashes also cause excessive delays, especially given the constrained driving environment.
Each year, National Work Zone Awareness Week brings attention to these safety, mobility, and constructability issues. The key message is that, as a driver, you must use extra caution in work zones to keep yourself and others safe. In short: Drive like you work here.
Speed and Safety in Work Zones
Speed is a contributing factor in almost 29 percent of 2017 fatal work zone crashes.†

- Speeding endangers everyone on the road, particularly in work zones. Speeding drivers are less likely to respond to traffic control devices or safely navigate the roadway conditions, lane closures, lane shifts, rough surfaces, and other conditions that are common in work zones. To stay safe, you should always slow down and proceed with caution whenever you see signs of highway work.
Safety Tips for Driving in Work Zones
- Plan ahead. Work zones account for an estimated 10 percent of overall congestion and nearly 24 percent of unexpected freeway delays.* Expect delays, plan for them, and leave early to reach your destination on time. When you can, avoid work zones altogether by using alternate routes.
- Obey road crews and signs. When approaching a work zone, watch for cones, barrels, signs, large vehicles, or workers in bright-colored vests to warn you and direct you where to go.
- Slow down. Look for signs indicating the speed limit through the work zone. Keep a safe distance from the vehicle ahead of you and follow the posted speed limit.
- Move over. Most state move-over laws apply when passing work crews and official vehicles parked on the shoulder with flashing warning lights.
- Avoid distractions. Keep your eyes on the road and off your phone.
- Watch for sudden stoppages. In 2017, 25 percent of fatal work zone crashes involved rear-end collisions.†
- Watch for large vehicles. Don't make sudden lane changes in front of trucks that are trying to slow down. In 2017, 50 percent of fatal work zone crashes involving large trucks or buses occurred on rural roadways.† Between 2013 and 2017, fatal work zone crashes involving large trucks increased by 43 percent.§
Visit the FHWA Work Zone Management website at https://ops.fhwa.dot.gov/wz/index.asp and the National Work Zone Safety Information Clearinghouse website at www.workzonesafety.org/ for access to resources, guidance, and training.
Total Work Zone Fatalities by transportation mode††
| 2016 | 2017 | % Change | |
|---|---|---|---|
| 782 | 799 | +2% | |
| Drivers and passengers |
652 | 658 | +1% |
| Pedestrians and bicyclists |
125 | 136 | +9% |
| Others |
5 | 5 | 0% |
| 2016 | 2017 | |
|---|---|---|
| Worker fatalities in road construction sites** |
143 | 132 |
| Fatal work zone crashes involving large trucks and buses†† |
189 | 222 |
| Fatal work zone crashes where speeding was a factor†† |
194 | 203 |
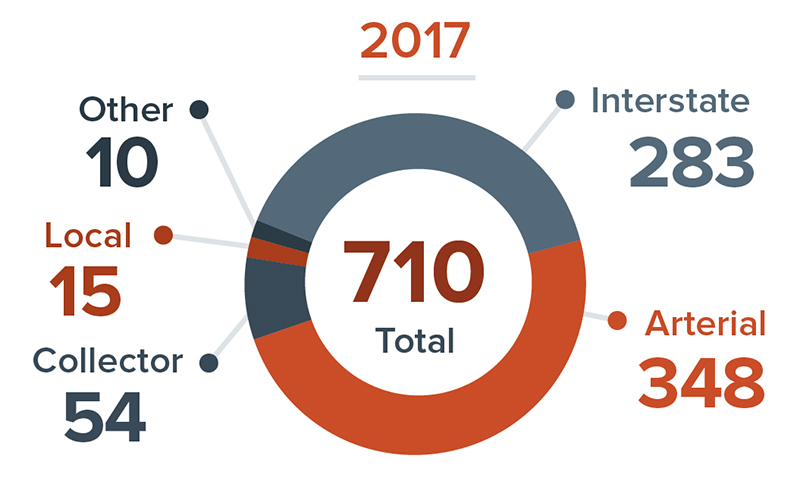
Total Work Zone Fatal Crashes by type of highway††

Sources:
†Fatality Analysis Reporting System (FARS) 2017 Annual Report File, National Highway Traffic Safety Administration (NHTSA). FARS data shown here are from the 50 States, District of Columbia, and Puerto Rico. [Return to † ]
*FHWA, “Facts and Statistics—Work Zone Mobility.” Available at: https://ops.fhwa.dot.gov/wz/resources/facts_stats/mobility.htm. [Return to * ]
§Fatality Analysis Reporting System (FARS) 2013 Final and 2017 Annual Report File, National Highway Traffic Safety Administration (NHTSA). FARS data shown here are from the 50 States, District of Columbia, and Puerto Rico. [Return to § ]
**2016 and 2017 U.S. Department of Labor, Bureau of Labor Statistics, in cooperation with State, New York City, District of Columbia, and Federal agencies, Census of Fatal Occupational Injuries. [Return to ** ]
††Fatality Analysis Reporting System (FARS) 2016 Final and 2017 Annual Report File, National Highway Traffic Safety Administration (NHTSA). FARS data shown here are from the 50 States, District of Columbia, and Puerto Rico. [Return to †† ]
Note: Figures are subject to revision, as values reported in FARS may be updated intermittently. Values shown here reflect what is reported by NHTSA as of November 2018.