Freight and Land Use Travel Demand Evaluation: Final Report
Appendix C: Freight/Land Use Travel Demand Evaluation Literature Review
Section 3: Literature Scan
The literature scan researched foundational resources and supplementary material to assess the state of practice in research and development/applications for freight demand evaluation using information produced since the QRFM was published. The literature scan will guide the development of detailed discussions with key stakeholders and aid in identifying user needs.
Much information exists on current gaps; however, not much is available in terms of how to close those gaps. Additionally, in an environment where new techniques are ever-evolving, the question becomes, "What is the best way to document the state of the practice?"
There is a continuing cycle of research and synthesis (see Table 1), which is described in more detail below. The QRFM was produced in 2007 as the results of prior research were incorporated into similar synthesis documents. Additionally, NCHRP and second Strategic Highway Research Program (SHRP2) Capacity 20 (C20) program efforts have aimed to develop the next generation of research needs. Both SHRP2 initiatives and FTG analyses (summarized in NCFRP Report 37) reflect key advances in the freight planning process.
QRFM (2007)
Model Types
The QRFM describes several types of models:
- Four-Step Travel Forecasting: Addresses how the traditional "four-step" transportation forecasting process (trip generation, trip distribution, mode split, and network assignment) is used to forecast goods movement in traditional urban transportation planning models, in State transportation planning models, and in site planning.
- Commodity Modeling: Discusses how commodity flow surveys can be used in freight forecasting in place of traditional trip tables.
- Economic Activity Modeling: Discusses how freight forecasting can be included within more comprehensive economic/land use/ecological models.
- Hybrid Modeling: Discusses how different freight models can be combined with multimodal commodity methods to better understand goods movement flows.
Model Application
QRFM Chapters 8-11 focus on application-ready updates from recent research reports including:
- Model validation: Considers how to calibrate freight models and forecasts, and how to validate models.
- Existing data sources: Discusses the availability of data, the content of that data, and the advantages and disadvantages of using existing freight data.
- Data collection methods: Discusses why existing data may be insufficient and why new data sources may be required to support freight modeling.
- Application issues: Discusses why freight forecasts are needed, their attributes, and how forecasts are used in the transportation planning process.
Case Studies
This section of the QRFM covers how methodological and data issues were addressed at various government levels and in different regions, including by States and multistate partnerships, large and small urban areas, and individual sites such as ports, airports, industrial parks, and intermodal railroad terminals. Models discussed include:
- Southern California Association of Governments heavy-duty truck model (Los Angeles, California)
- Freight Action Strategy truck forecasting model (Seattle, Washington)
- San Joaquin Valley truck model (Central California)
NCHRP Syntheses
TRB released a series of relevant summary documents after publication of the QRFM. These documents generally supported both the current state of the practice as reflected in QRFM and helped define a framework for the subsequent wave of travel demand-related research advanced by SHRP2. Relevant summary NCHRP documents include the following:
- NCHRP Synthesis 384 (2008), Forecasting Metropolitan and Commercial Freight Travel
- NCHRP Synthesis 406 (2010), Advance Practices in Travel Forecasting
- NCHRP Synthesis 410 (2010), Freight Transportation Surveys
These reports contributed to the base of freight travel demand literature, but have not been explicitly included in this literature review as their contents are reflected and updated in subsequent NCHRP and NCFRP reports developed after 2010.
SHRP and SHRP2 Initiatives
In the 1987 highway bill, U.S. Congress authorized the original SHRP as a five-year, $150-million research program. At that time, the U.S. transportation and public works system was in the public spotlight due to its state of deterioration. SHRP was proposed as a highway research program that would concentrate efforts on a short list of high-value activities. These fell under four major technical research areas, including:
- Improved performance of asphalt materials
- Improved concrete and the protection of reinforced concrete structures
- Efficient methods of highway maintenance, including control of snow and ice
- Long-term durability of pavements
SHRP2 was authorized in 2005. Its focus was to find strategic solutions to three national transportation challenges:
- Improving highway safety.
- Reducing congestion
- Improving methods for renewing roads and bridges
There has been a recommendation for a future SHRP comprised of several primary research program areas:
- Accelerating the renewal of America’s highways
- Making significant improvement in highway safety
- Providing a highway system with reliable travel times
SHRP2 C20 - Freight Demand Modeling and Data Improvement (2013)
The SHRP2 C20 initiative assesses the state of the practice of freight demand modeling and freight data as related to highway capacity planning and programming. While passenger travel modeling is moving toward more activity-based modeling techniques, freight demand models have remained relatively unchanged. However, new information technology advances have greatly improved how transportation planners access freight data.
Land Use and Demographic Considerations with QRFM Elements
Table 2 below identifies land use and demographic considerations with QRFM elements.
Element B: Establish techniques and standard practices to review and evaluate freight forecasts. This element directly addresses the objective of improving and expanding upon the current state of the practice.
Elements D, E, H, I, and J address topics beyond the QRFM:
- Element D: Develop methods that predict mode shift and highway capacity implications of various what-if scenarios (scenario planning).
- Element E: Develop a range of freight forecasting methods and tools that address decisionmaking needs that can be applied at all levels (national, regional, State, metropolitan planning organization (MPO), municipal (geographic scales).
- Element H: Determine how economic, demographic, and other factors and conditions drive freight patterns and characteristics. Document economic and demographic changes related to freight choices (economic/demographic trends).
- Element I: Develop freight data sources for application at subregional levels (geographic scales).
- Element J: Develop and standardize a portfolio of core freight data sources and data sets that supports planning, programming, and project prioritization (data sources).
Table 2: Sample Research Initiatives from SHRP2
Source: SHRP2
| Sample Research Initiatives2 | Research Dimensions |
Strategic Objectives |
||||||||
|---|---|---|---|---|---|---|---|---|---|---|
Knowledge |
Models |
Data |
1. Improve and expand knowledge base |
2. Develop modeling methods to reflect actual supply chain management practices. |
3. Develop modeling methods based on sound economic and demographic principles. |
4. Develop standard freight data to smaller geographic scales |
5. Maximize use of freight tools by public sector for planning and programming. |
6. Improve availability and visibility of data between public and private sectors. |
7. Develop new and enhanced visualization tools and techniques. |
|
| A: Determine the freight and logistics knowledge and skill requirements for transportation decision makers and professional and technical personnel. Develop the associated learning systems to address knowledge and skill deficits. | • | ◼ | ||||||||
| B: Establish techniques and standard practices to review and evaluate freight forecasts. | • | ◼ | ◻ | ◻ | ||||||
| C: Establish modeling approaches for behavior-based freight movement. | • | • | ◼ | |||||||
| D: Develop methods that predict mode shift and highway capacity implications of various what-if scenarios. | • | • | ◼ | ◼ | ||||||
| E: Develop a range of freight forecasting methods and tools that address decision-making needs and that can be applied at all levels (national, regional, state, metropolitan planning organization, municipal). | • | • | ◼ | ◼ | ◻ | |||||
| F: Develop robust tools for freight cost-benefit analysis that go beyond financial considerations to the full range of benefits, costs, and externalities. | • | • | ◻ | ◼ | ||||||
| G: Establish analytical that describe how elements of the freight transportation system operate and perform and how they affect the larger overall transportation system. | • | • | ◼ | ◻ | ||||||
| H: Determine how economic, demographic, and other factors and conditions drive freight patterns and characteristics. Document economic and demographic changes related to freight choices. | • | ◼ | ||||||||
| I: Develop freight data resources for application at subregional levels. | • | ◻ | ◻ | ◼ | ||||||
| J. Establish, pool, and standardize a portfolio of core freight data resources and data sets that supports planning, programming, and project prioritization. | • | ◼ | ◼ | ◻ | ||||||
| K: Develop procedures for applying freight forecasting to the design of transportation infrastructure, particularly pavement and bridges. | • | ◼ | ||||||||
| L: Advance research to effectively integrate logistics practices (private sector) with transportation policy, planning, and programming (public sector). | • | ◻ | ◼ | ◼ | ||||||
| M: Develop visualization tools for freight planning and modeling through a two-pronged approach of discovery and addressing known decision-making needs. | • | • | • | ◼ | ||||||
Note: Directly Addresses Objective ◼; Indirectly Addresses Objective ◻.
2 The sample research initiatives outlined as part of the SHRP2 C20 research project demonstrate how the strategic objectives could be advanced. Each initiative also applies to one or more of the three research dimensions (Indicated by •). [ Return to tablenote 2 ]
Freight Decisionmaking Needs and Gaps
SHRP2 has also advanced research on behavior/agent-based supply chain modeling that will allow State DOTs and MPOs to better understand freight travel behavior as it relates to industry decisionmaking processes used for logistics and freight movement.
Table 3 highlights freight decisionmaking needs, gaps between those needs and the current modeling and data practices, and data and modeling requirements to meet those needs. Essentially, it is a comprehensive list of knowledge gaps.
Table 3: Freight Decision-Making Needs and Gaps from SHRP2
Source: SHRP2
Decision-Making Needs |
Gaps Between Needs and Current Practices |
Data or Modeling Requirements to Close Gaps |
|---|---|---|
| Standardized data sources with common definitions |
|
|
| Statistical sampling of truck shipments |
|
|
| Standardized analytic tools and applications |
|
|
| Inclusion of behavior-based elements in freight models |
|
|
| Data development to understand the nature, volume, and trends of intermodal transfers |
|
|
| Industry-level freight data development at a subregional level and within urban areas |
|
|
| Incorporation of local land use policies and controls for better local forecasting accuracy |
|
|
| Development of a correlation between freight activity and various economic influences and macroeconomic trends |
|
|
| Better accuracy of freight forecasts |
|
|
| Development of a process to routinely generate new data sources and problem-solving methods |
|
|
| Use of ITS resources to generate data for freight modeling |
|
|
| Development of a universal, multimodal, network-based model for various geographic scales |
|
|
| Development of benefit-cost analysis tools that go beyond traditional financial measures |
|
|
| Development of funding assessments resulting from freight forecasts |
|
|
| Creation of tools to support the infrastructure design process |
|
|
| Development of knowledge and skills among the freight planning community as a foundation for improved analysis |
|
|
SHRP2 C20 Subsequent Studies
The SHRP2 Implementation Assistance Program has funded pilot projects in 11 States to develop state-of-the-art tools for freight modeling and data analysis. This includes development of behavior/agent-based supply chain models, methods for understanding freight delivery patterns in urban areas, testing emerging technologies to collect data on freight traffic, interactive mapping and visualization of freight data, platforms for sharing data on a regional level, and tools for greater insight into the linkage between industry and infrastructure needs.
Four pilot projects focus on modeling and seven focus on data. Several of these studies are expected to be directly applicable to QRFM. Other studies show some potential for new techniques, or may just provide good sources for up-to-date case study information; the ones at the bottom of the list tend to focus less on travel demand practices but may also have potential as case studies. Table 4 provides additional information about the 11 pilot projects.
NCFRP Report 24: Smart Growth and Urban Goods Movement (2013)
NCFRP Report 24 summarizes contemporary literature on the impacts of smart growth on goods movement and identifies areas for further research. The effort included outreach to a variety of goods movement practitioners and urban planners. The Puget Sound region was used as a testbed for incorporating several emerging practices for goods movement and smart growth scenario planning.
NCFRP Report 25: Freight Data Sharing Guidebook (2013)
NCFRP Report 25 provides a series of guidelines for sharing freight data, primarily between public and private freight stakeholders. The report recognizes the difficulties of obtaining data from private entities as well as the significant costs associated with data collection. The report provides examples of how to overcome these barriers. Additionally, it highlights 18 different public and commercial data sources that practitioners can access without restrictions.
NCFRP Report 739: Freight Trip Generation and Land Use (2013)
NCHRP Report 739 identified the need to make an important distinction between FG, FTG, and STG. FG is an expression of economic activity performed at a business establishment. Input materials are processed and transformed generating an output that, in most cases, is transported elsewhere for further processing, storage, distribution, or consumption. In contrast, FTG is the result of the logistic decisions concerning how best to transport the FG in terms of shipment size, frequency of deliveries, and the vehicle/mode used. STG is the travel made by local service industry personnel, such as craftsman and technicians who deliver, install, and maintain goods or services at their final destinations. The separation of FTG and STG by industry is important for understanding and predicting total freight travel demand. For instance, a fabricating plant that makes bathroom fixtures has a high ratio of FTG to STG, whereas a local plumber has a high ratio of STG to FTG.
NCFRP Report 37: Using Commodity Flow Survey Microdata and Other Establishment Data to Estimate the Generation of Freight, Freight Trips, and Service Trips: Guidebook (2017)
NCFRP Report 37 describes how industry-specific land classification systems such as the Standard Industrial Codes (SIC) or North American Industry Classification System (NAICS) provide a much better framework for forecasting freight generation (total flow of goods) than do more generalized codes, for example those defined by ITE for total vehicle trip generation or use in MPO forecasts (i.e., office, commercial, industrial jobs).
NCFRP Report 37 describes how industry-specific codes better link FTG (the flow of goods expressed in terms of vehicle trips) and service trip generation (truck trips generated primarily to provide services rather than delivering goods). New models to reflect these approaches have been developed through studies sponsored by TRB, with a focus on the New York City and Albany regions. The comparison of different types of freight demand models in a database (as described by NCHRP Report 739) is now being replaced by a single FTG software tool. This tool is in development and can be accessed here: https://coe-sufs.org/wordpress/ncfrp33/appendix/ftg/.
Developed by the Rensselaer Polytechnic Institute, the software applies FTG models at the ZIP code and two-digit NAICS code levels and made available during 2017.
ITE Trip Generation Handbook (2014)
The ITE Trip Generation Handbook provides guidance for site-specific trip generation with a special focus on person and vehicle trips by land use code. The handbook provides guidance on NCRFP Report 26 and NCHRP Report 739/NCFRP Report 19.
Additional Resources for "Thinking Beyond QRFM"
The foundational documents described in this report form the primary basis for considering updates to the QRFM. The following additional areas of interest reflect subjects that were not addressed in the QRFM, but are of increasing interest to the transportation industry. The initial exploration of these topics in the literature review includes best practices from other agencies, references to the QRFM in peer-reviewed literature beyond the foundational resources, and current agency and institutional consideration of the broader topics described as "thinking beyond QRFM." The initial findings below were expanded on during the peer exchanges.
Automated and Connected Vehicles (AV/CV)
The topic of automated vehicles for goods movement has generated significant research on a wide range of topics including highway safety, institutional and legal policies, just-in-time deliveries, and regulations enforcement. The initial review of the foundational literature indicates that industry consensus has not yet resulted in practical guidance for the application of AV/CV technologies into goods movement forecasting or transportation planning practices. The peer exchange events included this as an area of focus; there is a need to confirm the hypothesis that the specific role (or absence thereof) of the truck driver is not yet valued as a discriminator in freight travel demand analysis. Such analysis would be needed for more effective jurisdictional programmatic or facility planning. To evaluate this hypothesis, the definition of "automated" vehicle can be extended to concepts like last-mile deliveries by drones and robots.
Congestion Pricing
The QRFM recognized that users may need to realize tolls could create a dampening effect on demand. However it did not provide guidance on this issue beyond the use of time and cost impedance variables common to statewide or metropolitan travel demand models. Congestion pricing for facilities (such as with managed lanes) is an area of increased importance for truck trip assignment, considering the increased use of tolling for revenue generation and travel demand management both by location and time of day. This is an area where both attitudinal research and operational research has been robust, but the initial literature scan did not find compelling consensus on emerging or best practices specific to the freight industry.
FTG Survey Recommended Practices
The ITE Trip Generation Handbook is one of the foundational resources for this project. As described in the annotated bibliography, the handbook is a best practice that is periodically updated and adopted by ITE through a rigorous peer-review process. The 10th edition of the ITE Trip Generation Handbook was released in 2017. The ITE Trip Generation Handbook covers a wide range of topics beyond goods movement. One of the key freight recommendations is an application for a truck data collection survey, as from Thompson, Yarbrouh, Anderson, Harris, and Harrison in Transportation Research Record Number 2160 (p. 163) published in 2010.
Land Use Context
Two key documents provide useful context for considering the integration of land use context into the freight planning process. NCHRP Project 08-96 summarizes a wide range of strategies for accommodating goods movement demand and operations given the context-sensitivity of particularly freight-sensitive land uses (see Figure 2). It focuses on strategies for areas that are in the process of transitioning from freight-intensive to mixed use.
Related work has been done by Brian Hunter et al. at on identifying freight roadway design considerations (2017 TRB paper 17-01016; this was recognized as a best paper by TRB Committee AT025). This work also builds upon the City of Portland Street Design Guidelines (2008) for Trucks, and elements from Massachusetts DOT on encroachments and Virginia DOT on design vehicle concepts.
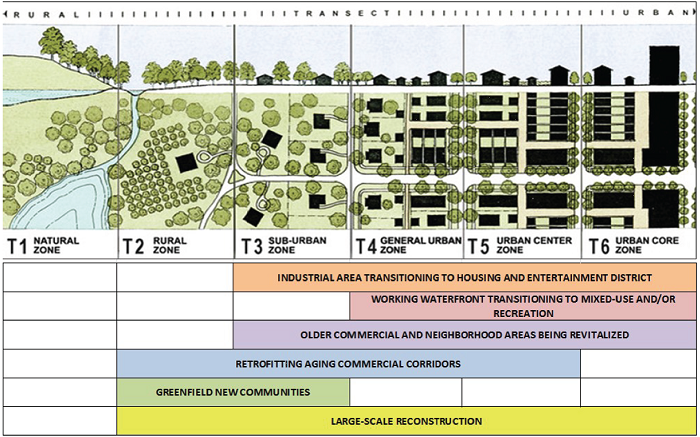
Figure 2: Relationship of Smart Growth Classification to the Rural-to-Urban Transect
Source: NCHRP Project 08-96
Megaregions
The concept of scenario planning for megaregions was examined by Weidner et al. in 2013 TRB paper 13-2236 examining a high energy price scenario for a multistate, multi-MPO region in the mid-Atlantic region. This examination demonstrated the value of scenarios for planning applications below the national commodity flow model. It also showed the ability of megaregion scenarios to link economic, land use, transport, and fiscal models. Overall it showed how decisions made by an MPO within a megaregion can have otherwise unanticipated effects elsewhere in the same megaregion. The applicability of this type of model to the QRFM will depend on the degree to which potential QRFM users gain value in the megaregion scale, which may be of greatest value to coalitions of transportation agencies such as the I-95 Corridor Coalition.
Reliability
Reliability is a topic of growing importance. While data are becoming increasingly more detailed and observed data are more precisely captured, this may still be limited in terms of its value to the freight industry for operations and planning. The QRFM states that reliability has increasingly been viewed as an important element to travelers, but does not provide guidance on how reliability might be incorporated into goods movement planning. Subsequent work by Xia Jin et al. at Florida International University on identifying stated value of reliability (at roughly 50 percent greater than travel time) was recognized as a best paper by TRB Committee AT015 (2017 TRB paper 17-00847). This effort builds upon prior meta-analysis by the same team in 2016 TRB paper 16-2051.
Scenario Planning
Scenario planning is a topic of increasing importance given the recognition that any transportation forecasting process has a range of uncertain, and often uncontrollable input variables and that investment decisions should encompass the widest range of likely futures as reflected in a risk-management approach to forecasting. For this particular topic, one of the foundational documents, NCHRP Report 750 Volume 1, is dedicated to the topic of scenario planning for freight transportation investment. That report is further described in the annotated bibliography.
Other QRFM References and Potential Case Studies
Additional resources were identified through the compendium of TRB annual meeting papers and presentations that cite the QRFM II and may serve as case studies for key topics and/or case studies for use in the next edition of the QRFM. Table 5 describes those additional resources.