Strengthening Linkages between Transportation Demand Management and Traffic Management
Context 3. Incorporating Transportation Demand Management as Part of a Major Road Reconstruction Project
Typically, when roadway reconstruction activities are being planned, traffic managers plan a host of diversions, detours, and other roadway-based alternatives to alleviate the impacts from a closed or limited-access road. When the reconstruction project is anticipated for a long duration (from several weeks to several years), any opportunity to reduce the number of vehicles on the road at any given time can help alleviate the congestion induced by construction. Active traffic management can do this by providing real-time information such as camera views of traffic, anticipated travel times on variable message signs (VMSs), or even text message alerts customized to a traveler's specific route. Transportation demand management (TDM) professionals look at all the different modes available to travelers and help them find the best one to take, in light of construction activity.
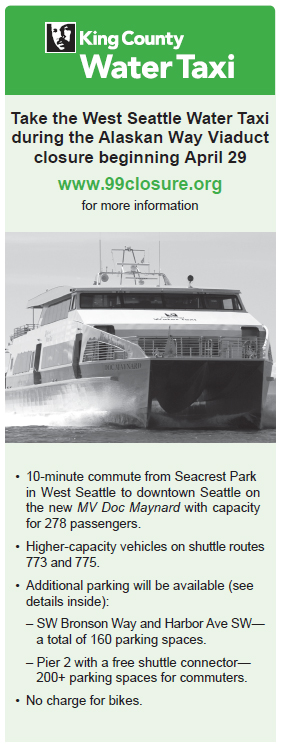
An example of where TDM and traffic management have been linked in an attempt to better mitigate the impacts of a major construction project is the Alaskan Way Viaduct Replacement Program in Seattle, WS (figure 10). This project included full closure for two weeks of a vital artery through the heart of Seattle. The Viaduct Program website provides real-time information related to traffic in the region (via Twitter feed) and construction and lane closure information to users. Because the Seattle Terminal and ferry dock are impacted by this program, the ferry section of the Washington State Department of Transportation website (and Twitter feed) provides comprehensive information related to ferry operations, including live camera feeds, real-time vehicle holding space capacity, and other information to help travelers make the most appropriate choices related to trips—including times—involving the ferries. King County also increased its water taxi service and expanded parking to an additional 200 parking spaces (with free shuttle connector) to accommodate more water taxi passengers.
 Figure 10. Excerpt from a pamphlet. Increased ferry service during a major road reconstruction project.(22)
(Source: King County).
Figure 10. Excerpt from a pamphlet. Increased ferry service during a major road reconstruction project.(22)
(Source: King County).
The case studies in this chapter show different ways to share and disseminate construction-related information to travelers so they can use it to make the most informed travel decisions. In the New Jersey Pulaski Skyway Reconstruction, the State DOT and other agencies needed to mitigate the impacts from a complete shutdown of traffic going one way for almost two years, and it would not have been prudent to just find ways to divert existing traffic. In the Texas I-36 Freight Trip Optimization project, the construction heavily affects a popular freight corridor, so providing real-time information is instrumental in helping freight managers and drivers determine the best time for their trip. In the Atlanta I-85 bridge collapse and recovery, the emphasis was on rapid response to an unanticipated event.
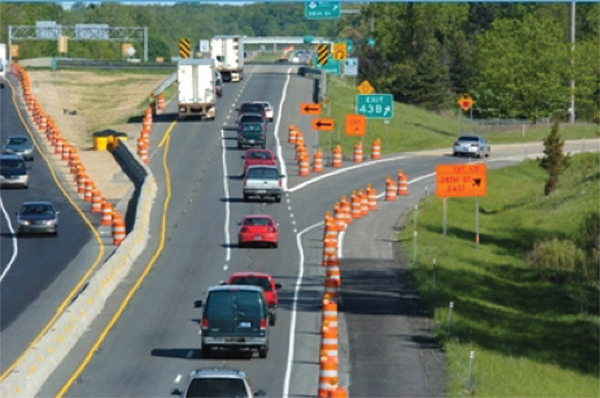 Figure 11. Photo. Traffic directed through a work zone.(23)
(Source: Michigan Department of Transportation).
Figure 11. Photo. Traffic directed through a work zone.(23)
(Source: Michigan Department of Transportation).
For any reconstruction project, providing as much information ahead of the project and during the project is crucial to help travelers plan ahead and around the construction, but could also help travelers see what the final impacts of the construction could be once regular travel resumes. To help travelers make informed decisions on all aspects of their trip chains, information should include road-related information (e.g., real-time traffic information and lane closures), travel options via other modes, other travel times, and even alternative destinations. It is also equally important that either traffic management decisions are relayed to TDM managers as soon as they are made, or TDM managers are included in the conversation about those decisions. TDM managers have not always been informed of these decisions, and there are opportunities to leverage TDM managers' local knowledge to appropriately message traffic management decisions to the right audiences.
For Las Vegas, Nevada's Project Neon construction project to widen a 3.7-mile section of I-15, RTC partnered with Waze, a real-time traffic app, to share information on Project Neon traffic and alternative route options. Under this partnership, RTC, which operates transit in the region, feeds the Waze app travel speed and incident data. Waze incorporates the data into its traffic and speed travel algorithm and reports the most efficient current route to Waze users. RTC also benefits from this partnership: Waze shares crowdsourced incident response data with RTC, adding new information to help RTC better understand regional travel patterns.

 Case 5. New Jersey Pulaski Skyway Reconstruction
Mitigating the impact of complete shutdown of northbound traffic on a major connector
Since April 2014, the New Jersey Department of Transportation (NJDOT) has been undertaking a $1.5 billion rehabilitation program of the Pulaski Skyway, a four-lane bridge-causeway on US Route 1/9 in northeastern New Jersey. The 3.5-mile-long bridge crosses two rivers, connects Newark and Jersey City with the New Jersey Meadowlands sports complex, and serves as a link to Newark Airport and New York City (via the Holland Tunnel).
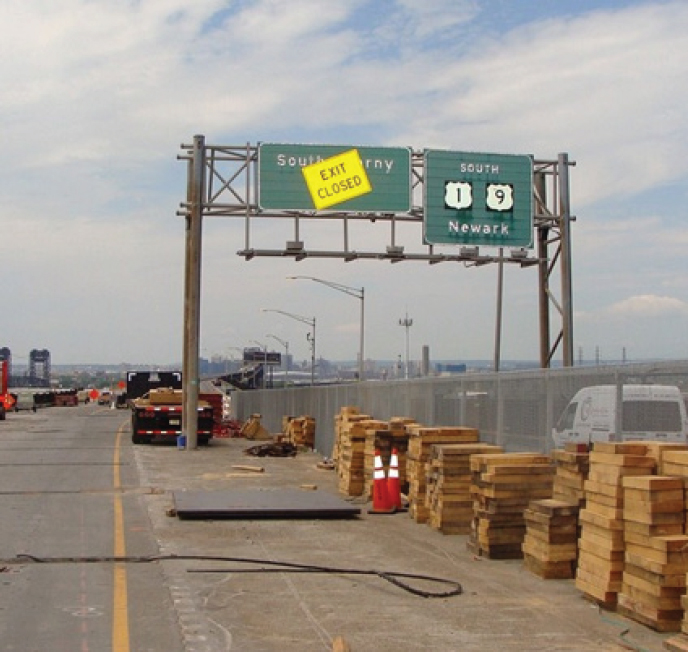
From the start, the project was anticipated to cause significant travel disruption. Prior to the construction, the roadway carried 67,000 vehicles daily, including 10,500 northbound vehicles during the 6:00 a.m. to 9:00 a.m. peak period. More than 60 percent of the northbound traffic was destined for employment destinations in the Jersey City waterfront or New York City. Following discussions with other transportation organizations and local officials, NJDOT selected a construction approach to completely shut down northbound traffic for approximately two years while the existing deck was replaced (figure 12). Two southbound travel lanes were maintained during this phase. This approach was chosen because it was expected to reduce the duration of the construction work, avoid overlap with night and weekend construction closures on other roads, and minimize commuter confusion, safety issues, and daily backups that would have resulted from an approach that implemented daily lane reversals.
 Figure 12. Photo. Center ramps closed to traffic, providing access to construction and emergency vehicles.(24)
(Source: NJDOT).
Figure 12. Photo. Center ramps closed to traffic, providing access to construction and emergency vehicles.(24)
(Source: NJDOT).
NJDOT served as the lead organization and was responsible for overall project planning, coordination with other organizations, and management of the construction. Due to the broad range of road users, including commercial/freight, commute, tourist, and local travelers, NJDOT conducted extensive coordination and outreach, beginning nearly two years before construction began. NJDOT communicated with major stakeholders, including NJ Transit, the Port Authority of New York and New Jersey (PANYNJ), New Jersey transportation management agencies, the North Jersey Transportation Planning Authority, and the New Jersey Turnpike Authority. NJDOT also held informational meetings with municipal and county elected officials, business groups, State legislative committees, port and trucking freight operators and users groups, and citizens groups.
Due to the high traffic volume on the road and the number and importance of destinations served, NJDOT along with NJ Transit, PANYNJ, and numerous other organizations implemented numerous traffic mitigation and TDM strategies to address traffic impacts during the construction. This integrated approach was to be expected, given NJDOT's Traffic Mitigation Policy and corresponding guidelines, which together guide the selection and implementation of traffic mitigation and TDM activities for road construction projects. Under the policy, which was developed in 2007, traffic mitigation is integrated throughout the project concept and planning stages, and NJDOT develops an individual transportation management plan (TMP) for each project. High-impact, multi-phase construction projects, such as the Skyway, receive extensive coordination, with a transportation management task force to facilitate intra-DOT and cross-agency coordination. A TMP task force for a high-impact project typically includes numerous NJDOT bureaus, transit agencies, other State transportation authorities, police and emergency services, elected officials, and business, commercial, and citizens groups. The Pulaski Skyway opened in July 2018, so the project has not yet undergone an overall traffic mitigation evaluation.

Noteworthy Strategy
A traffic mitigation policy and guidelines integrate traffic mitigation and TDM strategies into a reconstruction project concept and planning stages.
Strategies Providing Time Choice
During the reconstruction project, several strategies were implemented to help travelers decide when to travel. NJDOT temporarily located 40 VMSs at strategic points to provide current trip time information to help motorists
choose the fastest route for their current trip. The transportation management associations (TMAs) offered commuters short message service traffic alerts customized for the routes they used regularly. They also worked with employers, particularly those located in the Hoboken and Jersey City waterfronts, to develop telework and commuter flextime programs to shift travel out of the peak travel period.
Strategies Providing Mode Choice
Communication and outreach were essential elements to providing transportation options during this closure project. TMAs and transit agencies offered online and individual assistance to commuters to identify mode options and transit itineraries (NJ Transit, Port Authority Trans-Hudson trains, ferries, and private buses). Two TMAs had a central role in commuter and business outreach for the project. Hudson TMA and Meadowlink worked extensively with employers and commuters to identify alternative travel options, encourage taking a trial run of various options prior to the closure, provide links on their websites to transit, ferry, and other travel alternatives. The TMAs offered ongoing information on road detours and transit route adjustments through their websites and text message alerts, while NJDOT created a Pulaski Skyway Rehabilitation website, with accompanying television and radio advertisements to inform travelers of project progress, detours, alternate routes, and travel mode options. NJDOT, the TMAs, and media outlets provided information about NJDOT's 1-800-245-POOL ridematch service to help commuters form carpools.
NJDOT and the Hudson TMA worked with two ferry operators to develop and promote ferry options for coastal commuters traveling to the New Jersey waterfront and lower Manhattan destinations. NJDOT and PANYNJ even contracted with one of the operators for new ferry service for the duration of the construction. The various transit service providers expanded their rail and bus seating and service capacity, some particularly focusing on increased capacity during peak periods.
NOTEWORTHY STRATEGY
A $325 monthly subsidy for new vanpools was created during the construction project phase.
Success Supportive of the Integration of TDM and Traffic Management
The close coordination and partnerships between NJDOT, the TMAs, and the various mass transit service providers in the area enabled each agency to leverage each other's information on their own communications channels (e.g., websites, television, radio, and text message) and also find opportunities to enhance multimodal options for travelers in the corridor, even if they were temporary options. By offering a wealth of alternatives to use while the Pulaski Skyway was closed, the agencies helped spread travelers across many modes.
District of North Vancouver—Development Construction Traffic Mitigation Plans
In an effort to minimize traffic disruption in communities affected by building construction activity, the District of North Vancouver established guidelines for development of Construction Impact Mitigation Strategies (CIMS). The objective of CIMS is to provide safe passage for pedestrians, cyclists, and personal and transit vehicle traffic around construction sites with minimal inconvenience, impact, and delay. The guidelines particularly focus on strategies and steps to maintain safe access for pedestrians and cyclists, preserve and improve transit access, and develop early communication and coordination with a wide range of business, resident, and community stakeholders. CIMS requires developers to provide a plan that maps sidewalks, bike paths, and transit routes around the site; describes the likely impact of construction on travelers of each mode; defines mitigation measures that will be implemented to minimize mobility impacts; outlines stakeholder communication approaches and coordination with neighboring communities; and describes monitoring activities to ensure that the plan is effective.
Source: District of North Vancouver.(25)
 Case 6. Texas I-35 Freight Trip Optimization with Construction Information
Combining two data-sharing systems to provide information to help freight route or time choice
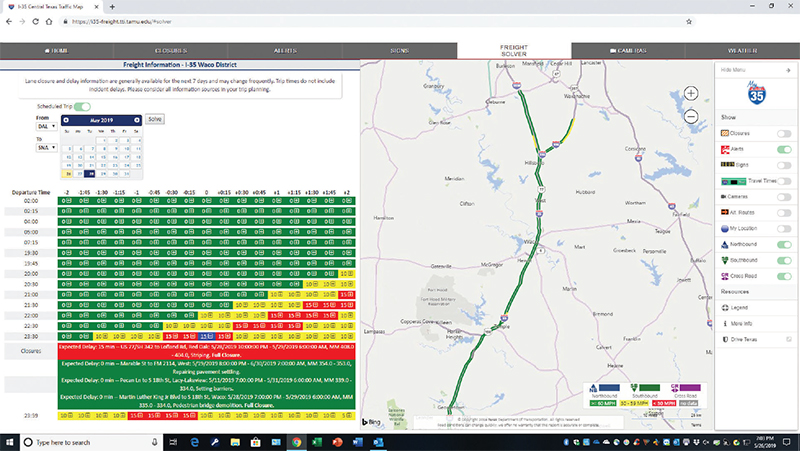
Since 2010, the Texas Department of Transportation (TxDOT) has been constructing improvements to 96 miles of the I-35 corridor between Salado and Hillsboro in Central Texas, expanding the facility from four-lane freeway sections to six-lane sections in rural areas and to eight-lane sections in Temple and Waco, TX. The corridor is a critical freight corridor through Texas. The construction project's length, rural environment, and influence on multiple jurisdictions create a unique challenge to traffic operations and traveler information. Throughout the construction, TxDOT has embraced the use of intelligent transportation systems to provide innovative traveler information to the driving population. Construction is complete on some parts of the corridor, with additional segments anticipated to be complete in 2019. Several years of additional expansion efforts though Waco are expected to start in late 2019 (figure 13).
The Federal Highway Administration (FHWA) is working with interested transportation agencies to make information available that allows trucking companies to more efficiently schedule and route their truck movements to avoid delays, through a system known as the Traveler Information during Construction (TIDC) data feed, which was integrated with FHWA's freight data program, the Freight Advanced Traveler Information Systems (FRATIS) program. For the I-35 project, this combined system provides information on current and forecasted travel conditions across multiple construction zones on I-35 with a focus on construction-related impacts. Information provided includes lane closures, estimated lane closure impacts, current roadway conditions, comparative travel time for alternate routes, and incidents. This project will help freight managers and drivers make the best route or time choices.
Prior to the launch of the project, trucking firms must obtain traveler information through a variety of independent sources and compile that information manually to incorporate into their corporate systems. The pilot project for the FRATIS-TDIC effort assembles multiple information sources and types to prepare a freight-carrier-specific distribution for consumption by dispatch and/or drivers. This additional and non-publicly available information enhances their trip planning, routing, and overall efficiency by minimizing delay. Corresponding savings in fuel and shipping costs are being evaluated separately under this pilot project.
While the project is ongoing, the companies in the pilot program have stated the new information has increased their efficiency and awareness of corridor conditions and have requested that the information availability be permanent. A full analysis of the overall economic benefits is in progress.
 Figure 13. Illustration. Example of using FRATIS optimization engine customized for I-35 corridor.(26) (Source: TxDOT).
Strategies Providing Route Choice
TIDC provides roadway condition information, which enables trucking companies to assess roadway conditions and incidents and determine the best route through the corridor: I-35 or alternate routes around Temple (using Loop 363) and Waco (using Loop 340). Through TIDC's data feed, freight companies are also able to obtain lane closure information (e.g., main lanes, ramps, frontage roads, and cross streets) and the estimated impacts of those closures on travel times. Freight drivers can make route choice decisions en route in response to these dynamic changes coming from the various construction activities.
Strategies Providing Time Choice
Freight drivers can adjust departure times in response to these dynamic changes coming from the various construction activities. This wealth of information is helpful for freight companies who have a variable time window (plus or minus the scheduled time) in which they can actually depart to be on schedule.
Successes Supportive of the Integration of Transportation Demand Management and Traffic Management
TxDOT had the following successes:
The ability of the freight carriers to adjust their departure time based on estimated conditions contributes to increased traffic stability, less delay, and more stable traffic flow by removing slower-moving vehicles from the roadway during heavy construction times.
While benefits from the pilot are still being evaluated to provide quantitative economic data, the advanced freight information has been an unparalleled qualitative success based on feedback from the pilot companies about the benefits the information provides to dispatching, drivers, and company efficiency.
Case 7. Atlanta's I-85 Bridge Collapse
Leveraging the TDM partnerships sees a 300 percent increase in TDM program registration rates during an unplanned disruption
On March 20, 2017, a large section of the I-85 bridge outside of Atlanta, GA, collapsed, forcing approximately 2 miles of road to be closed for reconstruction. I-85 is a primary connector to downtown Atlanta and carries approximately 250,000 vehicles per day. The Georgia Department of Transportation (GDOT) was forced to simultaneously accomplish two tasks: fix the bridge as quickly as possible, and minimize the increases in congestion and travel times in the meantime. In addition to increased traffic on I-85, spillover traffic occurred on surrounding routes, and alternative modes risked becoming overcrowded. Since no singular mode or strategy could accommodate the traffic typically on I-85, a range of different complementary strategies were deployed. GDOT developed a website dedicated exclusively to updates on the I-85 bridge, which compiled all press releases and updates. The Atlanta Regional Commission (ARC) leveraged its network of employers and city government partners to provide resources on alternative modes and carpools, helping travelers learn about their alternatives. GDOT also employed traffic management strategies, such as reconfiguring traffic lanes.
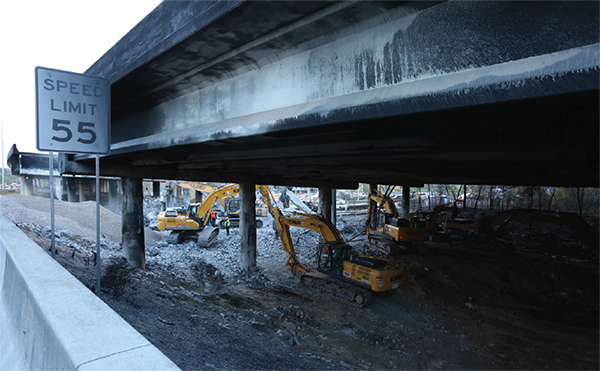 Figure 14. Photo. The I-85 bridge collapse near Atlanta.(27)
(Source: GDOT).
Figure 14. Photo. The I-85 bridge collapse near Atlanta.(27)
(Source: GDOT).
Engagement in all aspects of ARC's TDM program increased after the collapse. ARC had an existing program Gimme Five, which offered qualifying new commuters $5 per day and up to $150 in total for trying new modes other than personal vehicles.(28) Registration rates for new participants in Gimme Five increased by more than 300 percent in the weeks following the bridge collapse.1
The strategies enacted were made possible in part by active communication across agencies. GDOT, ARC, and executives from major transit agencies held recurring meetings. The meetings continued after the bridge collapse and were critical in determining leadership and creating a consistent strategy. The partnership found signs of overall success in mitigating such a devastating strain on the network: total traffic at peak rush hour shifted earlier and remained at normal levels except for on I-85 (where there were still increases), indicating some teleworking, alternate modes, or flex-scheduling occurred to compensate for reduced I-85 capacity.(29)
Strategies Providing Mode Choice
Multiple agencies worked to promote mode shift by means of promoting and improving transit. The Metropolitan Atlanta Rapid Transit Authority (MARTA) experienced a 25 percent increase in passengers the day after the bridge collapse because many commuters sought rail as an alternative. In response, MARTA extended service hours and increased capacity. MARTA also negotiated with businesses and churches near the ends of its commuting rail lines to allow some of their parking to be used for MARTA riders, thereby meeting the increased demand for park-and-ride lots. GDOT complemented these efforts by highlighting in press releases and on its website the value of carpooling or taking transit. MARTA also informed local news organizations of various travel alternatives (in terms of both route and mode choice) so that the organizations could inform the public. The Georgia Regional Transit Authority changed bus routes and ran additional coaches from park-and-ride lots to MARTA stations.(30)
ARC, GDOT, and local TMAs leveraged a network of over 800 employers, who were a part of existing TDM programs, to provide updates and recommendations, and to encourage additional signups in their existing TDM programs. Prior to the collapse, the TMAs offered employers a discounted monthly transit pass beyond what was available to the general public. After the collapse, TMAs re-opened the purchase window for passes (because they would normally have been closed at the time of the collapse). Additionally, the Georgia Commute Options program, which was under GDOT's purview at the time of the collapse, leveraged an existing program that provided an opportunity for commuters to try a new mode. Intensified promotion of the program in the aftermath of the bridge collapse served as a viable means to mitigate traffic surges in the near term and potentially increase awareness of alternate modes in the long term.

Noteworthy Partnership
The transit agency partnered with businesses and churches to get permission to use their parking lots for park and ride (transit).
GDOT and ARC actively encouraged teleworking, both in communication to the public and in conversations with employers. Many employers acted on this advice and facilitated teleworking for their employees, using the guidance that ARC disseminated. GDOT and ARC leveraged their Streetlytics-powered data to target very specific populations with their messaging.(31) Knowing which neighborhoods were most likely to have impacted commutes, they provided neighborhood-specific alternatives and shuttle route adjustments.
While not arranged by government agencies, Uber and Lyft offered promotional subsidies of their shared ride services, UberPOOL and LyftLine. Rides were 25 percent off in the broader region and 50 percent off when connecting to MARTA stations. Uber noted that 10 percent of its commuter hour trips during the subsidy period began or ended at MARTA stations, and 8,000 riders took their first ride to a MARTA station.(32) (Lyft impacts are not available.) The subsidies were exclusively for their shared-ride services, which reduced overall traffic but, just as importantly, reduced parking strain at MARTA stations, which had been overcrowded since the collapse.(33)
Virginia I-66 Construction Commuter Program
The 22.5-mile Northern Virginia I-66 corridor project, Transform 66 Outside the Beltway, was anticipated to create significant traffic delays as construction accelerated. In May 2018, the Virginia Department of Transportation (VDOT) and local government transportation provider partners considered how transit, carpool, vanpool, and telework could provide commuters with options to improve their commutes through the construction zone. New programs for bus services, vanpools and carpools, and telework policy expansions were initiated by VDOT and its partners across Northern Virginia and the Washington metropolitan region for the duration of the construction project. To raise awareness of these options, VDOT used a wide variety of media, including bus wrapping, community events, social media, targeted media campaign, and meetings with employers in the corridor.
Sources Used: VDOT.(34)
Strategies Providing Route Choice
GDOT spearheaded several measures to change route choice. The agency kept travelers aware of current congestion levels and route alternatives by posting continuous video status updates, and by directing travelers to 511 call centers. GDOT also advised travelers to use a favorite wayfinding app. GDOT contacted trucking industry members to give advice on routing options.
Successes Supportive of the Integration of Transportation Demand Management and Traffic Management
GDOT and ARC had the following successes:
ARC's ability to quickly model impacts from the bridge collapse was valuable for planning. Additionally, this event provided an opportunity to test the accuracy of the regional travel model's ability to predict network impacts from linkage breaks. In the aftermath of the event, due to the usefulness of the model, ARC is bolstering its efforts to use the model for scenario planning, testing the impacts of possible system breaks, and planning the sorts of TDM messaging that could accompany various situations.
GDOT and ARC's position as a central information hub that provides resources to local governments and employers was critical. This allowed localities to narrowly target their outreach and make tailored adjustments, such as placing more traffic officers at impacted facilities or posting information on transit options at key office buildings.
While some indicators of TDM program participation returned to normal levels after reconstruction, there were some examples of programs that retained participants even after the bridge was reconstructed, such as ARC's employer-based program encouraging transit ridership, which continues to see program use at levels 7 percent higher than before the bridge collapse.2
Transit Enhancements for Duluth, MN's Mega Project
In 2010, the Minnesota Department of Transportation (MnDOT) initiated a three-year Mega Project to renovate and improve a 12-mile section of I-35 and related access roads in Duluth, MN, a regional shipping and manufacturing hub located on the western shore of Lake Superior. Due to topography constraints that limit parallel road options, I-35 carries a significant portion of both freight and commuter traffic traveling to and through downtown. To address the expected substantial travel impacts, MnDOT planned several typical approaches, including promotion of alternate driving routes, coordination with emergency services to address road incidents quickly, outreach to businesses and travelers to provide information before construction, and real-time delay messaging during the project.
Because removing vehicles from the roadway was a particular goal, MnDOT, in cooperation with the Duluth Transit Authority (DTA), also developed a comprehensive package of strategies to shift commuters to transit. DTA expanded both the span and frequency of bus service, extended some routes to serve more distant communities, and established five new temporary park-and-ride lots each with free, peak-period express bus service to and from downtown. MnDOT and the City of Duluth designated peak-period bus-only lanes on primary downtown arterials to provide a time advantage to mainline and express buses in the corridors. And DTA undertook an aggressive media campaign to promote the new transit options. These strategies attracted new riders and benefitted existing riders who now had more departure/arrival time options.
Ridership for the seven months of 2010 when the transit enhancements were at their peak increased about 4 percent over the previous year. A rider survey conducted in 2010 found that 14 percent of riders had “just started” using transit; another 50 percent rode before and had increased their bus use. About one quarter of riders said they chose transit to avoid freeway traffic, and a similar share wanted to avoid traffic on city streets. But six in ten chose transit because they could ride for free, demonstrating the traffic mitigation value of the fare-free service combined with enhanced service from new park-and-ride lots; 58 percent of the increased ridership was from free rides. A follow-up survey conducted with the same riders in 2012 found that 85 percent of commuters who had usedtransit during the enhanced service period continued to use transit for work or school travel, even though 60 percent of them had a personal vehicle available.
Sources Used: University of Minnesota.(35)