Behavioral/Agent-Based Supply Chain Modeling Research Synthesis: Model ApproachesPrintable Version [PDF 1.6 MB]
U.S. Department of Transportation FHWA-HOP-18-005 March 2018 BACKGROUND AND CHALLENGEA handful of public agencies in the United States are in the process of developing—or have already developed—behavioral/agent-based models of supply chain decisions and freight movements. The uptick in development of these new models is largely attributable to the planning need for better freight forecasts. Federal Highway Administration (FHWA) Broad Agency Announcement awards and the Strategic Highway Research Program (SHRP2) C20 program provided funding for these new approaches to designing and implementing freight demand modeling. These include agent-based supply chain freight models currently in use in Baltimore Metropolitan Council (BMC), Chicago Metropolitan Agency for Planning (CMAP), Florida Department of Transportation (FDOT), Metro (Portland, Oregon), Phoenix's Maricopa Association of Governments (MAG), and Wisconsin Department of Transportation (WisDOT). A number of these agencies additionally funded their own efforts, including Metro who added funding for data collection, and CMAP who added funding beyond the initial research. MODELING NEEDSAgencies expressed the need to answer questions posed as part of their planning processes that were beyond the capabilities of their current freight and truck modeling tools. For example, the following policy analysis needs and issues were identified by one or more agencies as a reason for implementing a supply chain freight model:
In most cases, the freight models used by agencies were designed to support the needs of multiple stakeholders in large and complex regions, which added to the diversity of policy needs and issues. For example, several of the freight models were designed to cover megaregions with multiple metropolitan areas, or large single-MPO regions, or were jointly developed by state and regional agencies. In several cases, modal agencies, such as port authorities, were involved in the development of the freight models. This expansion beyond a more historically typical highway-focused use of travel models added to the need to cover all freight transportation modes rather than, for example, a truck-only model. Agencies' freight modeling needs (economic impact, land use, policies, infrastructure, and environmental) and their freight modeling elements are summarized in Table 1.
APPROACHESApproaches to freight travel demand modeling in the United States range from conventional 4-step planning models to more advanced integrated supply chain, economic-based, and tour-based models. The traditional 4-step freight demand modeling approach is defined by its four sequential stages of trip generation, trip distribution, modal split, and traffic assignment. In these models, the demand modeling process is aggregate and trip-based or commoditybased with limited analysis of individual trip behavior. Four-step models are relatively weak in terms of behavioral foundation, which often leads to limited model capabilities and model accuracy issues. These models fail to model the underlying economic behaviors from which the demand is derived. The main drawback of these aggregate models is their inability to capture the complexity of freight policy systems and their failure to replicate the supply chains and logistics decisions made by individual players in the freight supply chain. In recent years, to address some of the limitations mentioned above, advanced freight demand forecasting models have been proposed. Disaggregate freight models are also termed advanced models, since they provide more capabilities than aggregate models to evaluate policies and investments. These advanced models are disaggregate models that incorporate supply chain or truck touring procedures. Figure 1 shows the supply chain modeling process including firm synthesis, buyer-supplier matching, distribution channel and vehicle choice, shipment size, mode choice, and truck touring models. The models in Chicago, Florida, Baltimore, Oregon, Portland, and Phoenix are summarized in Table 2. 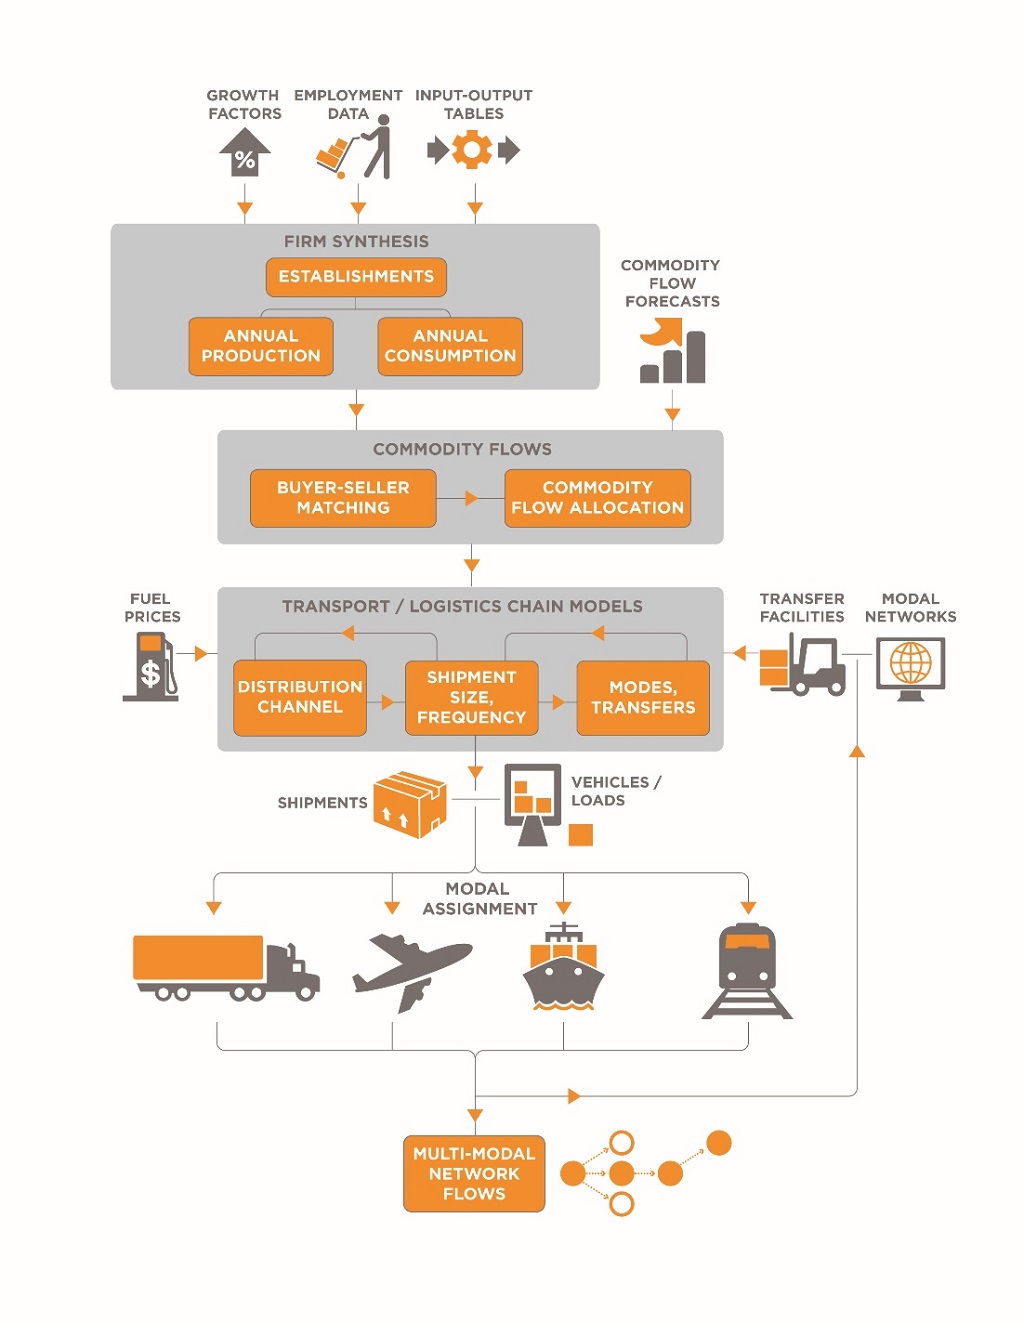
Figure 1. Behavioral Supply Chain Modeling Process.
1Multinomial Logit [Return to Table Note 1] FREIGHT MODEL DESIGNAn agency's decision to transition to a more advanced freight model structure must weigh the investment cost of transitioning against the importance of answering detailed policy and planning questions. The models of agencies examined as part of this synthesis were relatively limited trip-based models that analyzed —at most— grouped commodities and often represented only trucks. In these cases, the models provided little of the market coverage and policy sensitivity required to answer complex policy questions. Most supply chain model components reviewed as part of this synthesis were based on multinomial or nested logit choice model formulations. The first step of these supply chain models is an enumeration of establishments, typically called firm synthesis, based on iterative proportional fitting methods. The buyer-supplier matching model component is based on different methods, with the most advanced being a game theory application. Buyers consider several transportation, logistics, risk, capacity, and productivity factors for sellers when selecting a seller. Tour-based truck models primarily use the multinomial logit choice approach. In several cases, the stop-sequencing element of the truck touring models used a different approach, such as the greedy algorithm and the hurdle/count model. FOR MORE INFORMATION
Kaveh Shabani
Maren Outwater
Colin Smith
Jeffrey Purdy Learn more about the SHRP2 program, its Capacity focus area, and Freight Demand Modeling and Data Improvement (C20) products at www.fhwa.dot.gov/GoSHRP2/
| |||||||||||||||||||||||||||||||||||||||||||||||||||||||||||||||||||||||||||||||||||||||||||||||||||||||
|
United States Department of Transportation - Federal Highway Administration |
||

 The second Strategic Highway Research Program is a national partnership of key transportation organizations: the Federal Highway Administration, the American Association of State Highway and Transportation Officials, and the Transportation Research Board. Together, these partners conduct research and deploy products that help the transportation community enhance the productivity, boost the efficiency, increase the safety, and improve the reliability of the Nation's highway system.