Comparing the Models: Insights from Freight Behavior Data Improve Wisconsin's Freight Models - Freight Demand Modeling and Data Improvement Implementation Support
Printable Version [PDF 3.3 MB]
You may need the Adobe® Reader® to view the PDFs on this page.
Contact Information: Operations Feedback at OperationsFeedback@dot.gov

U.S. Department of Transportation
Federal Highway Administration
Office of Operations
1200 New Jersey Avenue, SE
Washington, DC 20590
FHWA-HOP-17-035
December 2017
Table of Contents
Executive Summary
Challenges
In 2013, the Wisconsin Department of Transportation (WisDOT) began updating its statewide travel demand model. In conjunction with this, WisDOT was also updating the conventional, trip-based freight component of the statewide model. With the recent advances in behavior-based freight modeling, WisDOT was interested in learning what benefits could be derived if future updates to the freight component of the model were behavior- based rather than trip-based.
Approach
To identify how a more advanced freight model could support transportation planning and decisionmaking beyond conventional, trip-based freight models, WisDOT applied for and was awarded second Strategic Highway Research Program (SHRP2) C20 implementation assistance to develop a proof-of-concept behavior-based freight demand model and compare the model against its traditional model. The project team developed the new model based on one previously developed and implemented by the Chicago Metropolitan Agency for Planning (CMAP). WisDOT developed six real-world scenarios to compare the new behavior-based model with the existing trip-based model.
Outcomes
Results of this comparison showed WisDOT that behavior-based models excelled at evaluating mode shifts, but that these models, as currently implemented, have deficiencies in evaluating changes in truck volume. The modeling project allowed WisDOT to come to a consensus on the most effective freight model applications for the State: forecasting future truck volumes on the roadways it maintains. Output from the behavior-based model also provided WisDOT with new insight into how freight trucking operated within Wisconsin. Finally, the updated model code developed as part of the WisDOT project can now be more easily shared with other agencies wishing to develop and implement a behavior-based freight model.
Integration Into Business Practices
Results from this project confirmed to WisDOT that the trip-based freight model currently being maintained in the State is sufficient to meet the agency's transportation planning goals. As such, WisDOT will continue to spend resources on advancing its trip-based freight model.
Introduction
Background
Changes in shipping patterns driven by advances in logistics platforms and increases in shipment volumes are limiting the accuracy of traditional freight modeling methodologies. Further, traditional data sources are not providing the level of detail required to accurately depict freight shipment behavior. In recent years, the state of the practice for passenger demand modeling has advanced toward activity-based modeling; however, the state of the practice for freight demand modeling had been relatively unchanged.
Several challenges limit the accuracy of traditional freight models. Typically, these models are aggregated models that do not provide adequate ability for sensitivity testing with regard to fine-grain changes, such as changes in specific economic drivers or different land-use scenarios. These traditional freight models are often limited to goods shipped via truck and do not account for the multi-modal aspect of supply chains.
Finally, many traditional freight models do not address regional or international supply chains, and if they do, these supply chains are limited to simple scenarios. Without accurate, reliable tools and methods, transportation planners in State departments of transportation (DOTs), metropolitan planning organizations (MPOs), and the private sector have struggled to make sound decisions on a variety of issues in the realm of freight transportation. One approach to overcoming the limitation of traditional freight models is to develop behavior-based freight demand models.
In 2013, Wisconsin DOT (WisDOT) began updating the passenger component of its statewide travel demand model. This process included developing a new statewide roadway network, a traffic analysis zone set, as well as base and future year socioeconomic datasets. Around that time, WisDOT also completed a process to update the urban travel demand models that it administers. In conjunction with these updates, WisDOT was updating the conventional, trip-based freight component of the statewide model. Given recent advances in behavior-based freight modeling, WisDOT was interested in learning what benefits could be derived if future updates to the freight component of the model were behavior-based rather than trip- based. To identify how a more advanced freight model could support transportation planning and decision making beyond conventional, trip-based freight models, WisDOT applied for and was awarded SHRP2 C20 implementation assistance to develop a proof-of-concept behavior-based freight demand model and compare it against the agency's traditional model.
Project Team
Table 1 describes the various partners and their roles on this project.
| Project Partner | Role |
|---|---|
| Wisconsin Department of Transportation | Led overall project management. |
| Representatives from the Milwaukee, Eau Claire and Fox Cities metropolitan planning organizations, as well as a representative of the North Central Wisconsin Regional Planning Commission. | Participated on the technical advisory committee. |
| Federal Highway Administration | Provided coordination support as well as technical and administrative guidance. |
Objectives
The main objective of this project was to develop a proof-of-concept for a statewide freight forecasting framework that would:
- Address deficiencies in WisDOT's current statewide freight forecasting practice.
- Represent characteristics of firms, shipments, supply chains, and distribution channels.
- Describe trip chaining with a single truck tour making multiple stops for delivery of goods.
Secondary objectives for this project were to improve and expand WisDOT knowledge on freight activity in the State, standardize analysis through tools and models, and serve as a channel to discuss freight-related policies, needs, and issues with the State's freight stakeholders.
Process
Project Management
WisDOT selected a consulting firm with extensive experience with freight data and modeling to lead the research. In addition, WisDOT organized a technical advisory committee to provide input to the project team, review work products, and facilitate information exchange. The committee consisted of representatives from the region's MPOs.
Project Implementation
The sections below discuss major project components as well as related activities completed by the project team to develop, test, and implement a behavior-based freight model. This case study provides a brief overview of the most significant of these activities. The development of any behavior-based freight model consists of many tasks, including thorough testing, calibration, and validation. For brevity, not all of these tasks are discussed in this case study. For more information, please consult the project's technical documentation as referenced in this case study's Resources section.
Data Identification and Collection
The foundation for the model implemented in this project was developed through the Broad Agency Announcement (BAA) program run by the Federal Highway Administration (FHWA). In response to this BAA, the Chicago Metropolitan Agency for Planning (CMAP) developed a model code for the Chicago region. The project team obtained this CMAP model code and began collecting the required data. The team initially identified important data sources that other agencies used as input for behavior-based freight modeling. While some of these data sources were publicly available with nationwide coverage (e.g., Freight Analysis Framework), other sources were not (e.g., data on Wisconsin industries). Table 2 shows the primary data sources used in this project.
| Dataset | Data Source | Primary Use |
|---|---|---|
| Input/output tables. | U.S. Bureau of Economic Analysis. | Supply chain model. |
| County business patterns. | U.S. Census. | Supply chain model. |
| Wisconsin industry data. | Wisconsin Department of Transportation (WisDOT). | Supply chain model. |
| Freight analysis framework. | Federal Highway Administration. | Supply chain model. |
| TRANSEARCH. | IHS Global Insight. | Supply chain model. |
| Center for Transportation Analysis Railroad Network. | Oak Ridge National Laboratory. | Supply chain model. |
| Vehicle inventory and use survey. | U.S. Census Bureau. | Supply chain model. |
| County-to-county distance matrix. | Oak Ridge National Laboratory. | Supply chain model. |
| Registration data. | Wisconsin Division of Motor Vehicles. | Truck touring model. |
| Truck Global Positioning System data. | American Transportation Research Institute. | Truck touring model. |
| Transportation network shapefiles. | WisDOT. | Both models. |
Publicly available datasets with nationwide coverage make up a significant portion of the datasets used by the project team. This category included multimodal freight network, commodity flow, economic, and employment data.
The project team also obtained local data for input, calibration, and validation of the model. Examples of local data obtained include highway networks, truck global positioning system (GPS) data, and freight facility locations. This project did not include data collection activities for behavior data (e.g., establishment surveys); however, future collection of behavior data can be used in the model to improve results.
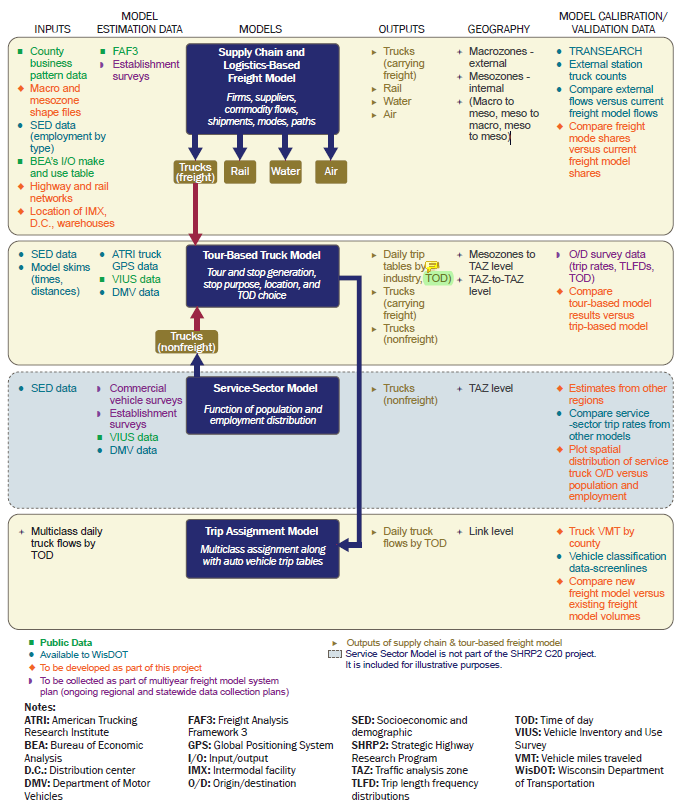
Model Design
As developed during the CMAP project, the BAA model consists of three main components:
- Supply chain and logistics-based freight model.
- Tour-based truck model.
- Service-sector model.
The supply chain and logistics-based freight model's primary purpose is to estimate freight shipments where the origin of the vehicle transporting the goods differs from the destination. These types of shipments are typically long-haul movements. The tour-based truck model estimates truck movements when the truck completes a "tour" that ends at the point of origin, such as leaving a distribution center to make deliveries before returning to the distribution center at the end of the day. The final component, the service-sector model, describes truck travel behavior for trucks that do not carry freight (e.g., construction vehicles). As originally implemented, the BAA project did not implement the service-sector model, and the service sector model was not implemented in this WisDOT project. Table 3 provides a comparison of the two models implemented in this project, and the following sections provide more detail on each.
| Characteristic | Supply Chain | Truck Touring |
|---|---|---|
| Tour type. | Open (start location is not the same as end location). | Closed (start location is the same as end location). |
| Origins and destinations. | One may end outside of the region. | Both ends are inside the region. |
| Distance. | May be hundreds of miles. | Typically less than 100 miles. |
| Duration. | One or more days. | Less than one day. |
| Shipments included. | One. | One or more. |
| Cargos/commodities included. | One. | One or more. |
| Modes included. | Truck, rail, water, air. | Truck. |
| Vehicles included. | One or more. | One. |
A graphical representation of the model framework is shown in Figure 1.
Supply Chain Model
The supply chain model can be used to estimate freight shipments where the origin of the vehicle transporting the goods differs from the destination. The specific steps taken by this model are shown in Table 4.
| Step | Description |
|---|---|
| 1. Firm Synthesis. | Produce a list of all firms (i.e., buyers and supplier) within the United States as well as a sample of international firms. |
| 2. Suppler Firm Selection. | Match buyer firms with supplier firms based on commodity produced and consumed. |
| 3. Goods Demand. | Estimate the annual commodity demand in tonnage between each buyer and supplier pair. |
| 4. Firm Allocation. | Allocate appropriate firms to the traffic analysis zone within the study region. |
| 5. Distribution Channels. | Estimate how goods are shipped between each buyer and supplier (e.g., shipped directly, shipped through a distribution center). |
| 6. Shipment Size and Frequency. | Convert total tonnage shipped between buyer and supplier to discrete shipments. |
| 7. Modes and Transfers. | Estimate the travel mode for each leg of the shipment as well as any applicable transfer locations. |
| 8. Trip Assignment. | Assign shipments to the multimodal network and any applicable transfer centers (e.g., a distribution center). |
The supply chain model consists of several steps beginning with developing a list of businesses both within and outside of the model's study area. With the list of businesses established, suppliers and buyers are connected based on supplier production and buyer consumption. Commodity flows are then distributed among the pairs and a determination is made as to whether the shipments are direct or go through intermediate handling (e.g., a distribution center). With the shipment path determined, the model next calculates the size and frequency of shipments between each buyer and supplier pair. The shipment mode is then determined for each leg of the trip. Finally, the trip is assigned to the multimodal network.
The firm allocation step was not implemented in this project. This step was originally developed in the BAA model to allow CMAP to allocate firms to sub-county zones due to the smaller geographic study area in the Chicago implementation. For WisDOT's implementation, the project team only sought to allocate firms to the county-level, so this step was deemed unnecessary.
Truck Touring Model
The tour-based truck model estimates truck movements where the truck's destination is the same as its origin. The specific steps taken by this model are shown in Table 5.
| Step | Description |
|---|---|
| 1. Ports of Entry/Exit. | Determine how and where the shipment entered the truck touring model's region. |
| 2. Vehicle Choice and Tour Pattern. | From the port of entry, determine tour pattern (e.g., direct to destination, truck tour) as well as vehicle class (e.g., heavy truck). |
| 3. Stop Clustering. | Shipments delivered on a truck tour are grouped. |
| 4. Arrive Time at First Stop. | Estimate delivery time for the first stop on the tour. |
| 5. Routing Sequence. | Sequence stops using the "Traveling Salesman" algorithm* on travel time combinations. |
This model estimates the truck activity within the model's study area. Direct shipments— i.e., shipments without intermediate handling—are modeled as out-and-back trips. Shipments involving a distribution center are modeled as truck tours to simulate actual pickup and delivery activity within the region. For each truck tour simulated, departure and arrival times are estimated.
The project team determined that the truck touring model would focus only on the tours that served to complete shipments generated in the supply chain model. In other words, these tours would only include the short-haul portion of shipments that began as a long-haul movement, stopped at a distribution center, and concluded with a short-haul movement. The new framework developed as part of this project converted daily tons of goods into truckloads using typical payload factors, aggregated flows from each distribution center by commodity group, determined total stops per tour, and completed the tour.
The project team had initially planned to set the maximum stops per tour as equal to one less stop than the number required to make the cumulative truckloads of the tour exceed one truckload. However, this approach caused an unrealistically large number of stops per tour and, when coupled with travel times, often made tours exceed 24 hours. Instead, the project team reviewed the truck GPS data to estimate a distribution of truck stops per tour and used this distribution to assist in selecting the number of stops per tour in the model.
Before implementing the new truck touring model, the project team compared results of this model against results in which no truck touring behavior was used (i.e., instead of grouping deliveries from distribution centers, each delivery would be independent). The project team found that, in this implementation, the addition of a truck touring model increases daily truck trips less than 4 percent when compared to the alternative. The project team determined that the value added by the truck touring model in the Wisconsin application was not worth the effort it took to convert commodity origin and destination to truck origin and destination. As such, the truck touring model was not used in the final implementation of this project.
Model Comparison
The project team developed six scenarios to compare the proof-of-concept with the traditional freight model component. These were developed based on actual scenarios that WisDOT had encountered in recent years. The scenarios were:
- Enactment of truck size and weight increase legislation.
- Introduction of a fulfillment center.
- Reintroduction of an intermodal rail terminal.
- Construction of a rail-truck transload facility serving a large trucking company.
- Construction of a new distribution center.
- Abandonment of a rail line in northern Wisconsin.
The project team evaluated each scenario using the behavior-based model described above and the existing trip-based statewide model. Results of the model comparison are shown in Table 6.
| Scenario | Advantage | Rationale |
|---|---|---|
| Truck size and weight increase. | Neither. | A number of assumptions were needed to use both models for this scenario, and as such model results were not expected to be precise. Further, neither model can address the legal, environmental, safety, nor other impacts of this policy change as these models were not designed to address those issues. Neither model has an advantage when addressing this scenario. |
| Construction of a fulfillment center. | Existing statewide model. | The behavior-based model can forecast mode shift, but does not do well forecasting changes in truck volume. As such, results of the behavior-based model provide no significant improvement over the existing model in analyzing a new fulfillment center. |
| Reintroduction of intermodal rail terminal. | Behavior-based model. | The behavior-based model can forecast mode shift, including usage at other intermodal rail terminals in Wisconsin. |
| Construction of a transload facility. | Existing statewide model. | The scenario selected includes adding a second transload facility in a county that currently has only one. Because the behavior-based model's analysis is no finer than the county level, and the additional transload facility does not change the supply chain's utility, forecasts from the behavior-based model are not affected by the development of this facility. The statewide model does allow users to enter a special generator for the new facility. |
| Construction of a distribution center. | Existing statewide model. | The behavior-based model can forecast mode shift, but does not do well forecasting changes in truck volume. As such, results of the behavior-based model are not especially useful in analyzing a new distribution center. |
| Track abandonment. | Either. | While the behavior-based model did show a reduction in rail mode share (and an increase in truck mode share), the statewide model indicated rail demand that was not being assigned given the absence of the track. These are equivalent conditions, as one could assume that the unassigned rail tons would shift to truck. |
The scenario comparison results show preference for the existing statewide model, as that model was found to have the advantage in three scenarios where the new proof-of-concept had the advantage in one scenario. Neither model had a clear advantage in the remaining two scenarios. For the scenario focused on truck size and weight increases, neither model was able to address the issues external to estimation (e.g., legal, environmental). For the track abandonment scenario, the behavior-based model showed a mode shift while the existing model showed decrease in rail demand that planners would assume corresponded to a shift in truck demand.
Outcomes
Project Benefits
A main objective of this project was to determine the utility of behavior-based freight modeling in Wisconsin when compared to traditional, trip-based freight modeling. As a result of this effort, the project team was able to develop an operational, behavior-based freight model and compare both the new and existing models in six real-world scenarios to determine the effectiveness of each model. Outcomes of this comparison showed WisDOT that behavior-based models excel at evaluating mode shifts given a change in transportation system intermodalism, but that these models, as currently implemented, do not provide much advantage over traditional models in evaluating changes in truck volume. The project allowed WisDOT to come to a consensus on purposes for which the State should use freight models: i.e., forecasting future truck volumes on the roadways it maintains.
Several parts of the model development process also directly benefited the project team. A key question the project team answered at the very beginning of the process was that of data availability. Before developing the behavior-based model, the project team needed to determine if the required data would be available for the model. The project team was able to confirm that, between public and WisDOT- maintained data sources, the data to run the model were indeed readily available. This will ultimately streamline the process for future model development and updates.
In addition, this project provided WisDOT with ancillary benefits. Output from the behavior-based model provided WisDOT with new insight into how freight trucking operated within Wisconsin. For example, like the trip-based model, the behavior-based model confirmed that the majority of freight shipped within Wisconsin is moved by truck. The behavior-based model provided additional insight into these shipments and suggested that nearly half of the truck tons used a regional distribution center. While these truck-to- truck transfers are likely accounted for in the trip-based model outputs, this linkage was not specifically identified in the output.
Transferability of the Project
As discussed earlier, the foundation for the behavior-based model developed for this project was the BAA model previously implemented in the Chicago region. Before beginning the project, the project team had assumed the model code would be transferable to Wisconsin. During implementation, the team determined that several components of the code needed to be modified for the Wisconsin implementation, and other portions could not be used, so new code would need to be written. Some of the original programming code from the Chicago Metropolitan Agency for Planning (CMAP) project was written for data available specifically in the Chicago region, and the project team had to rewrite these sections of the programming code to accept nationally available datasets. Further, the project team found instances where CMAP completed calculations outside of the programming code in the Chicago implementation, so the team developed programs during this project to conduct those calculations in association with the model. As a result, the output of this project includes updated code that can be more easily passed to another agency wishing to develop and implement behavior-based freight models.
Lessons Learned
The WisDOT team shared the following lessons, based on the process and outcomes of this project:
- Allow sufficient time and resources to personalize and adapt a model, even if using an off- the-shelf solution. Through the course of this project, the team learned not to underestimate the amount of personalization required when implementing a behavior-based model, even when the code that serves as the model's foundation was available from a previous implementation. While the project team's initial assumption was that the code would be easily transferable to the Wisconsin study area, they found this was not entirely true. Changes were required to both of the major model components: the supply chain model and the truck touring model. The project team was able to successfully transfer the majority of the supply chain model. However, a portion of the supply chain model required input in a format specific to the Chicago implementation, which was not available in Wisconsin. In addition, several processes and equations had to be modified by the project team to ensure that the model met the needs in Wisconsin.
- Benchmark new models against existing models to evaluate the benefits of making a shift. The truck touring model as implemented by CMAP was limited to two commodities and limited in geography to the Chicago metropolitan area. To implement this model in Wisconsin, the project team first broadened the model to include all commodities and broadened the geographical scope to include all of Wisconsin. However, the team found that this method did not lead to a feasible approach to implementation. Further, it was intended that the closed tour concept would include several metropolitan travel demand models. However, after examining the truck GPS data, the project team determined these tours should not be confined to a single metropolitan area. Because of these two issues, the project team developed a new concept to implement truck touring behavior in the model. The project team found that, with the new concept, only a small difference occurred between output using the truck touring model and that using the truck trip model. As such, the project team did not believe that the effort to run the closed tour model outweighed the benefits of using it, so ultimately it was not used in the project.
- Engage the metropolitan planning organization (MPO) and local partners throughout the model development process. This project assembled a Technical Advisory Committee to provide insight and support to the project. Changes in the project (e.g., removal of the truck touring model) limited some of the need for input from committee members representing the region's metropolitan planning organizations. In addition, the issues faced during the project were not within the purview of the committee members. As such, while the Technical Advisory Committee provided critical input during the kickoff meeting and deliverable review, the level of committee involvement in other aspects of the project was less than what was expected at the start of the project.
Next Steps
This project confirmed to WisDOT that its existing trip-based freight model is suitable for the agency's needs. While the implementation of a supply chain choice model did provide more detailed changes in mode share, the need for such changes by WisDOT is minimal, and the factors that most significantly influence mode share do not appear to be under the jurisdiction of WisDOT. At the current time, there are no WisDOT-specific next steps with regard to behavior-based freight modeling.
Conclusion
This project represents the successful implementation of a behavior-based freight model as well as an in-depth comparison of the new model with the State's existing trip-based freight model. Key outcomes of this project include a better understanding of the benefits of a behavior-based freight model for WisDOT and updates to the BAA behavior-based freight model code that will facilitate future implementation for other agencies.
The project team determined that, as implemented, the behavior-based freight model succeeded in evaluating mode shift, but did not outperform WisDOT's existing trip-based freight model in determining information critical to the agency's mission, such as truck volumes on WisDOT-maintained roadways. This better understanding of the model capabilities allows WisDOT to focus funding on maintaining and improving its existing trip-based freight model.
Improvements made to the BAA behavior-based freight model will make it easier for other State and local agencies to implement and continue refining the model. As other State and local agencies around the country begin to test and implement behavior-based freight models, the state of the practice will continue to be pushed toward a national model. That is the point at which the behavior-based models will make improvements in volume estimation and better fit WisDOT's needs.
Product Information
Product Title: SHRP2 C20: Behavior-based Freight Demand Model
Agency Name: Wisconsin Department of Transportation
Contact Information:
Name: Jennifer Murray
E-mail: jennifer.murray@dot.wi.gov
Phone: 608-264-8722
Resources
This section includes resources and related project documentation.
Technical Documentation
Wisconsin Department of Transportation (2016). SHRP2 C20 Behavioral Freight Modeling: Application and Testing of a Supply Chain Model. Madison, WI.
1 Wisconsin Department of Transportation (2016). SHRP2 C20 Behavioral Freight Modeling: Application and Testing of a Supply Chain Model. Madison, WI. [ Return to note 1. ]

The second Strategic Highway Research Program (SHRP2) is a partnership of the Federal Highway Administration (FHWA), the American Association of State Highway and Transportation Officials (AASHTO), and the Transportation Research Board (TRB). TRB completed the research, and now FHWA and AASHTO are jointly implementing the resulting SHRP2 Solutions that will help the transportation community enhance productivity, boost efficiency, increase safety, and improve the reliability of the Nation's highway system.
FOR MORE INFORMATION
Jennifer Murray
Wisconsin Department of Transportation
Phone: 608-264-8722
E-mail: jennifer.murray@dot.wi.gov
Jeffrey Purdy
Federal Highway Administration
Office of Freight Management and Operations
Phone: 202-366-6993
E-mail: Jeffrey.Purdy@dot.gov
Learn more about the SHRP2 program, its Capacity focus area, and Freight Demand Modeling and Data Improvement (C20) products at www.fhwa.dot.gov/GoSHRP2/
STRATEGIC HIGHWAY RESEARCH PROGRAM
U.S. Department of Transportation Federal Highway Administration
American Association of State Highway and Transportation Officials – Transportation Research Board