Modeling a Multi-Modal Megaregion: Arizona's Sun Corridor Sheds Light on What Drives Industry and Freight
Printable Version [PDF 1.9 MB]
You may need the Adobe® Reader® to view the PDFs on this page.
Contact Information: Operations Feedback at OperationsFeedback@dot.gov

U.S. Department of Transportation
Federal Highway Administration
Office of Operations
1200 New Jersey Avenue, SE
Washington, DC 20590
FHWA-HOP-17-033
December 2017
Freight Demand Modeling and Data Improvement Implementation Support
Table of Contents
Executive Summary
Challenges
The Arizona Sun Corridor megaregion encompasses portions of five counties that comprise the metropolitan areas served by the Maricopa Association of Governments (MAG) and the Pima Association of Governments (PAG). This megaregion is home to approximately 8 out of every 10 Arizonans and includes one of the busiest freight ports on the United States-Mexico border. State and local transportation planners in the region have researched and maintained state-of-the-practice truck transportation models for many years; however, these models have typically focused only on a few metropolitan planning areas.
Approach
MAG, PAG, and the Arizona Department of Transportation (ADOT) collaborated to develop a regional freight model that can be integrated within regional and statewide travel forecasting models to support decision- making and analysis across the Sun Corridor megaregion. To develop the megaregional freight model, the project team first completed a comprehensive review of freight data sources to determine what data were available and appropriate for the model.
With the available data sources identified, the project team developed a number of major model components (including innovative firm synthesis, supply chain, mode choice and transport, and truck tour models). Together these sub-models formed the megaregional freight model. The process included a supply chain model as well as innovative approaches such as accounting for an evolving market of buyers and sellers and a truck touring model that captured trip chaining activities of freight deliveries of differing classes.
Outcomes
As a result of this project, the Sun Corridor megaregion has advanced its ability to develop more coordinated policies and improve freight operations. The new regional freight model provides planners in the region with the ability to test different transportation planning, economic, and policy scenarios and understand the impacts of each. MAG and PAG now have the ability to integrate the freight model with regional transportation forecasting models, including an activity-based model and a four-step model. In addition, the model framework makes future integration with regional economic models possible.
Integration Into Business Practices
The new model provides planners in the region with the ability to conduct new and more detailed analyses. Planners can use the model to test different scenarios and understand how they affect freight movement through the megaregion. MAG and PAG will continue to use, refine, and build on this new model to add additional functionality that improves the ability to describe and forecast such activity.
Introduction
Background
Changes in shipping patterns driven by advances in logistics platforms and increases in shipment volumes are limiting the accuracy of traditional freight modeling methodologies. Further, traditional data sources are not providing the level of detail required to accurately depict freight shipment behavior. In recent years, the state of the practice for passenger demand modeling has advanced toward activity-based modeling to more closely replicate actual traveler decisions and behavior; however, the state of the practice for freight demand modeling had been relatively unchanged over the same timeframe.
Several challenges limit the accuracy of traditional freight models. Typically, these models are aggregated models that do not provide adequate ability for sensitivity testing with regard to fine-grained changes, such as changes in specific economic drivers or different land use scenarios. These traditional freight models are often limited to goods shipped via truck and do not account for the multi-modal aspect of supply chains. Finally, many traditional freight models do not address regional or international supply chains, and if they do, they are limited to simple scenarios. Without accurate or reliable tools or methods, transportation planners at State departments of transportation (DOTs), metropolitan planning organizations (MPOs), and the private sector struggle to make sound decisions on a variety of issues in the realm of freight transportation. One approach to overcoming the limitation of traditional freight models is developing behavior-based demand models.
As metropolitan regions continue to expand in the United States, a new scale of geography is beginning to emerge. More than just an overlap of multiple regions, "megaregions" are areas that share infrastructure, economic linkages, environmental systems, topography, and culture. Further, these megaregions cover thousands of square miles and are found in every part of the United States (see Figure 1).
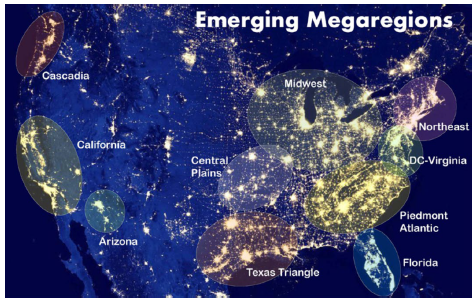
Source: The Center for Quality Growth and Regional Development (CQGRD) with modification of Night Lights from NASA Ross and Lee (2013)
Figure 1. Image. Map of emerging megaregions.1
Located in the Southwestern United States, Arizona's Sun Corridor megaregion begins at the United States-Mexico border and stretches north, encompassing portions of five counties that include the metropolitan areas served by the Maricopa Association of Governments (MAG) and the Pima Association of Governments (PAG). This region is home to approximately eight out of every ten Arizonans and includes one of the busiest freight border crossings between the United States and Mexico. Further, the region's population is expected to increase dramatically in the coming years, with experts forecasting a more than 100 percent population growth between 2010 and 2050.2
Along with this forecasted population increase, an increase in business activity is likely as well as in passenger and freight movement along the region's infrastructure. State and local transportation planners in the region have researched and maintained state-of-the-practice truck transportation models for many years. However, these models are typically specific to each agency, and together they provide only a patchwork of freight movement in the megaregion. In an effort to advance behavior-based freight modeling research and to develop a regional freight model that can be integrated within regional and statewide travel forecasting models, MAG applied for and was awarded funding from the Strategic Highway Research Program 2 (SHRP2) C20 Implementation Assistance Program.
Project Team
While the project was led by MAG, it was a joint effort that included significant support from PAG and the Arizona Department of Transportation (ADOT). Further, MAG, PAG, and ADOT staff compiled a technical advisory group (TAG) to provide additional guidance and oversight. Table 1 describes the various partners and their roles on this project.
| Project Partner | Role |
|---|---|
| Maricopa Association of Governments | Led overall project management, assisted in model development, and served on the technical advisory group (TAG). |
| Pima Association of Governments | Provided technical support and input to the project, served on the TAG. |
| Arizona Department of Transportation | Provided technical support and input to the project, served on the TAG. |
| Federal Highway Administration | Provided coordination support, guidance, and served on the TAG. |
Objectives
The project team set several objectives for developing an improved freight model for the region. It looked to complete the project in close coordination among Federal, State, and local agencies with input and support from both a TAG and team of consultants. Major project objectives included:
- Conducting a comprehensive review of freight data sources to increase capabilities in freight data collection and data analysis.
- Developing innovative models (e.g., firm synthesis, supply chain, truck tour).
- Developing an operational, multimodal freight model for the megaregion.
- Emphasizing a behavioral approach to model development to assist in coordinated policy development and provide an effective tool for improving freight operations.
- Taking into consideration the MAG activity-based passenger modeling framework to facilitate future integration of the models.
Process
Project Management
In addition to the TAG, the project team determined there was a need for a consultant team to support the model development. MAG established on-call contracts with a number of prime consultants who had expertise in freight modeling. The project team divided the project into individual tasks and used these on-call contracts to assign the most qualified consultant to each specific task, leveraging their specific experiences and skill sets.
Project Implementation
The sections below discuss major project components as well as related activities completed by the project team to develop, test, and implement a behavior-based freight model. This case study provides a brief overview of the most significant of these activities. The development of any behavior-based freight model consists of many tasks, including thorough testing, calibration, and validation. For brevity, not all of these tasks are discussed in this case study. For more information, please consult the project's technical documentation as referenced in the Resources section.
Data Identification and Collection
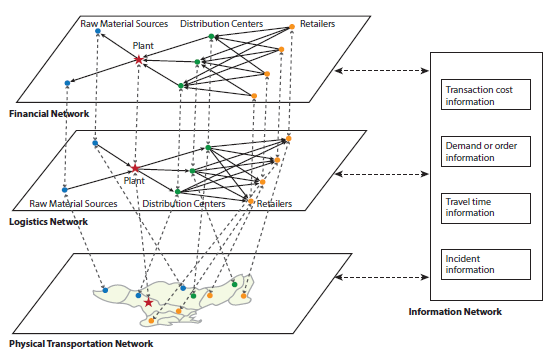
Soon after the project began, the team held a kick-off meeting to begin planning for task management and model development. Consensus from meeting attendees was to focus on three "layers" of model hierarchy: finance, logistics, and transportation. Interaction between these layers is shown in Figure 2.
On the basis of this discussion, the project team sought to develop a series of models to represent all three layers:
- The financial layer, as represented by a firm synthesis model that looks at production, consumption, the evolution of firms (businesses), and the various factors that influence the birth, growth, location, and dissolution of firms.
- The logistics layer, as represented by a supplier selection model that determines the transfer of goods between entities. It is this layer that generates the "buyers" and "suppliers" of all shipments.
- The physical transportation layer, as represented by two models: a supply chain model that describes how goods are moved from origin to destination and a truck tour model that captures any touring behavior (i.e., making multiple deliveries in a single day) by trucks in the region.
After refining the model framework, the project team conducted a thorough investigation of the availability and applicability of data to use in the model. Publicly available datasets made up a significant portion of the datasets used by the project team. A list of these datasets and their applicability is shown in Table 2. Many of the data sources identified through this effort have the potential to be applied for model estimation, calibration, and validation. However, data such as TRANSEARCH, the Freight Analysis Framework, and other private socioeconomic data sources (e.g., Woods & Poole) provide information about future freight flows and socioeconomic scenarios. The study noted that it may be necessary to fuse multiple data sources for the purposes of model development and validation.
| Dataset | Data Source | Primary Use | Data Use | ||
|---|---|---|---|---|---|
| Estimation | Calibration | Validation | |||
| Input/Output Tables | U.S. Bureau of Economic Analysis | Financial Layer | Yes | Maybe | No |
| County Business Patterns | U.S. Census | Financial Layer | Yes | Yes | Yes |
| National Establishment Time-Series | Walls & Associates | Financial Layer | Yes | Maybe | Yes |
| Longitudinal Business Dynamics | U.S. Census Bureau | Financial Layer | No | No | Yes |
| Annual Survey of Manufacturers | U.S. Census Bureau | Financial Layer | No | No | Yes |
| Business Dynamics Statistics | U.S. Census Bureau | Financial Layer | No | Yes | Yes |
| Business Employment Dynamics Statistics | U.S. Bureau of Labor | Financial Layer | Yes | Yes | Yes |
| Statistics of U.S. Businesses | U.S. Census Bureau | Financial Layer | Maybe | Yes | Yes |
| Nonemployer Statistics | U.S. Census Bureau | Financial Layer | Yes | Yes | Yes |
| Commodity Flow Survey | U.S. Census Bureau | Logistics Layer | No | Yes | Yes |
| Freight Analysis Framework | Federal Highway Administration (FHWA) | Logistics Layer | Yes | Yes | Yes |
| TRANSEARCH | IHS, Inc., Global Insight | Logistics Layer | Yes | Yes | Yes |
| Carload Waybill Sample | Surface Transportation Board | Logistics Layer | No | Yes | Yes |
| Air Carrier Statistics | U.S. Department of Transportation (DOT) Office of the Secretary (OST) – Research | Logistics Layer | No | Yes | Yes |
| Trans-border Freight Database | US DOT OST – Research | Logistics Layer | No | Yes | Yes |
| Port Import/Export Reporting Service | IHS, Inc. Port/Import Export Reporting Service | Logistics Layer | Yes | Yes | Yes |
| National Highway Planning Network | FHWA | Transportation Layer | Yes | Yes | Yes |
| Center for Transportation Analysis Railroad Network | Oak Ridge National Laboratory | Transportation Layer | Yes | Yes | Maybe |
| Vehicle Inventory and Use Survey | U.S. Census Bureau | Transportation Layer | No | Yes | Yes |
| Vehicle Travel Information System | FHWA | Transportation Layer | No | Yes | Yes |
| Truck GPS Data | American Transportation Research Institute, StreetLight Data | Transportation Layer | Yes | Yes | Yes |
| National Performance Management Research Dataset | FHWA | Transportation Layer | Yes | Yes | Yes |
Model Design
As described, the model hierarchy developed by the project team included three layers, each containing one or more models. This section provides an overview of the components of each model within the layers.
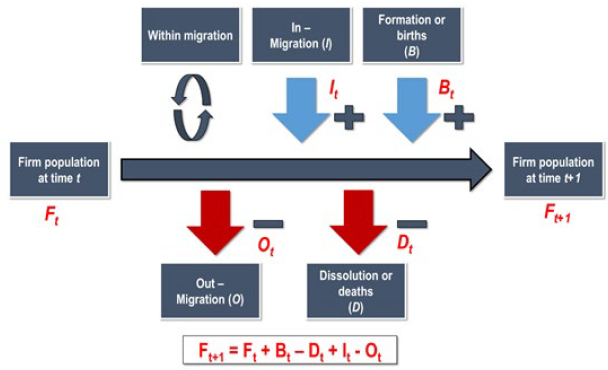
Firm Synthesis Model
The firm synthesis model falls within the financial layer and serves to describe the buyer businesses and seller businesses that generate freight shipments. The purpose of this model is to understand how freight buyers and suppliers (i.e., firms) evolve or change over time and space. A basic overview of this process is shown in Figure 3.
This firm synthesis model improves on many past efforts as it accounts for firm formation, relocation, and dissolution; similar past models often assume a constant distribution of firms. To support this model, the project team developed a series of models to estimate firm dissolution and relocation, growth, and location choice.
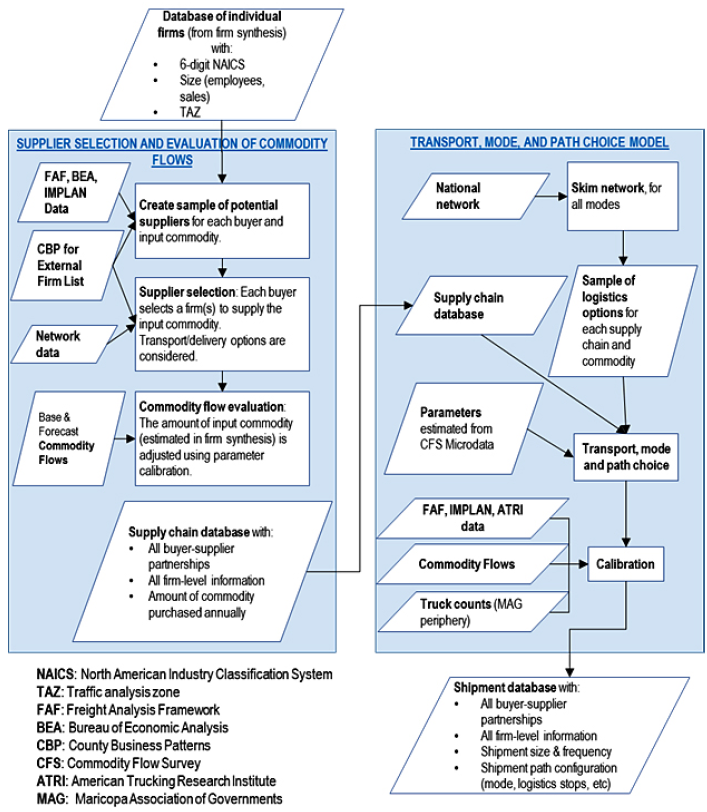
Supply Chain Model
The supply chain model consists of two main components: a (1) supplier selection model and evaluation of commodity flows, and (2) transport, mode, and path choice model. Figure 4 illustrates the two components as well as their relationship to each other.
The supplier selection model and evaluation of commodity flows began with the list of businesses that was developed in the firm synthesis model. Next, production and consumption was calculated for all firms in the study area to determine the quantity of freight to be moved. Finally, the Roth-Peranson market- clearing algorithm5 was used to select all buyer-supplier pairs and provide origin-destination pairs for the freight shipments.
With these origin-destination pairs, the transport, mode, and path choice models will produce the path used by each individual shipment as an output, including modes and multimodal stations used. These models are sensitive to several policy variables, such as travel time, transportation cost, shipment size, travel time reliability, and expected cost of loss and damage. They also address the existence of different transportation modes and logistic nodes as well as other relevant infrastructure for each analyzed commodity identified during model development.
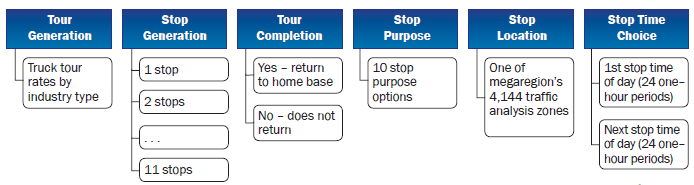
Truck Tour Model
The truck touring model estimates the truck activity within the model's region. The project team developed this model to include heavy, medium, and light trucks using GPS data from two vendors. Figure 5 shows the truck tour-based model structure. The model uses the following process for each truck tour: determine the industry, the number of stops, the stop purpose, stop location, and, finally, stop time.
Model Integration
New model components were integrated using the R programming language, an open source programming language commonly used for statistical and data analysis. Once integration had been completed, MAG initiated activities to incorporate the new model into their existing travel demand models. For both MPOs, this process primarily consisted of converting the output and extracting the information on shipments starting or ending within their jurisdiction. Finally, traffic assignment and validation activities were completed by each MPO.Outcomes
Project Benefits
Benefits of this project align directly with the overall goals of SHRP2. Freight planners and decision makers in the region will benefit from having a consistent approach to evaluating transportation projects that affect freight movement. The new model bridges the separate models previously maintained by the agencies in the region. The new model also provides a single framework to allow planners at different agencies to work with the same temporal and spatial constraints to coordinate projects and policies.
The agent-based multimodal nature of the model provides for development of advanced application scenarios. The new model can provide insight into supply chain decisions, including distribution channels, models, and shipment sizes. This capability allows planners to have a better understanding of potential mode shifts due to different scenarios, such as the development of a new regional distribution center.
Obtaining establishment data from industry partners is often challenging. Many industry partners prefer to keep information on what is being shipped where and when proprietary to maintain their competitive edge. As such, MPOs and State DOTs typically borrow this type of data from other areas or estimate it from other sources. A benefit of this project is that the team developed modeling methods based on sound economic principles. Rather than borrowing data or developing a basic estimate for extrapolation to future model years, the project team developed a model that uses an established match algorithm and can estimate changes in firm growth and dissolution over time and space.
Finally, this project improved and expanded the project team's knowledge base and enabled a number of collaboration opportunities that can continue to benefit freight planning efforts at MAG, PAG, and ADOT, improving their ability to model freight movement in the region. By increasing the range of modeling and forecasting applications that can be analyzed, planners in the region can use the model to support solutions for future planning challenges.
Transferability of the Project
While this project included a long list of data sources, the majority are publicly available with nationwide coverage. Implementation of this project took significant staffing and financial resources. However, the majority of the work accomplished was not region-specific and could be replicated by other agencies with comparable data access and resources. As the project team continues to refine and use this model, it is also looking for ways to continue to improve model transferability.
Lessons Learned
The project team shared a number of lessons learned during the process of developing this model:
- Ensure strong project management with staffing redundancies. This project included a large project team including staff from two MPOs and several consultants. To ensure the project ran smoothly, MAG emphasized strong in-house project management activities and ongoing communication between the project team and the technical advisory group. With regard to project management, MAG assigned staff in project manager and deputy project manager roles to ensure that the large project team remained coordinated. While the project team did not experience any issues with coordination of the project, consultant staff turnover did present a staffing challenge. Fortunately, the consultant team had enough depth to replace lost staff, but it is important to keep in mind the need for redundancy at the single point of failure if relying on outside support.
- Maintain an emphasis on team coordination. Modeling projects have many moving parts, and it is important to make sure that project components are being developed in coordination. MAG staff took a very hands-on approach to project development and often communicated with the consultant team daily during the development of significant model components. It is important to understand the key strengths of different team members; MAG occasionally found it useful to supplement consultant-led activities with technical support from MAG staff.
- Develop a clear process for quality assurance and quality control. Throughout the course of the modeling project, different components were being developed by different authors. As such it was critical that all pieces could be easily integrated to produce valid results. The project team found that in-house expertise at MAG and PAG was critical to complete quality assurance and quality control (QA/QC) activities on the project.
- Utilize visualization to support QA/QC and communications. The development of visualization tools was not included in the original scope for this project. As the project progressed, however, the project team realized the critical need for visualization outputs. The project team used in-house staff to develop these tools and found that these contributed significant value to both QA/QC and communications activities. For example, the visualizations helped staff more quickly identify potentially erroneous results and more effectively communicate key model outputs with non-technical staff and decisionmakers.
- Consider data licensing requirements before data acquisition. The data licensing agreement used by the project team proved to be very restrictive, and some of the data purchases required for the project were costly. The project team believed that procuring vendor-supplied data was beneficial in providing higher-quality data at a lower cost than comparable in-house data collection activities; however, arranging for data licensing can be challenging. Before obtaining the data, agencies and partners must agree to data use agreement and licensing. Some agreements can be very restrictive (e.g., requiring that all data be deleted following project completion), and others can limit how the data are used and shared. It is important to understand how a project team envisions using data before completing these licensing agreements in order to make best use of any purchased data.
- Ensure adequate resources for model development. The development of behavioral,agent-based freight demand forecasting models that are both fully fledged and operational requires much greater funding support than was provided through the SHRP2 C20 program for conceptual development. Given the project team's experience in freight modeling, the team fully understood that the scope of work for this project would require staff and financial resources above the SHRP2 funding level to ensure the project's success. Project teams working on similar efforts should carefully consider the levels of resources needed for project activities.
Next Steps
As a follow-up to this modeling project, the project team has worked to make further refinements to the model, assess different applications, and develop new model functionality. MAG plans to continue to refine the model by advancing the stop identification algorithms in truck GPS data, incorporating land- use and other criteria and completing light truck data collection to improve the model's accuracy for that vehicle class. MAG also intends to fully integrate the freight model with the regional transportation forecasting models, including the activity-based model and the four-step model. MAG also wants to develop new model functionality, such as forecast and future application scenarios as well as new visualization tools, to use with the model outputs.
While the model developed in this project enhances the state of the practice for behavior-based freight models, improving on research was only one of MAG's objectives. Facilitating economic development is important to MAG; the project team believes that the new behavior-based freight model will give the overall region more flexibility to test different policy and planning scenarios than traditional travel models. MAG is also evaluating the possibility of future integration of the behavior-based freight models with regional economic models to provide more insight into how goods movement affects the region's economy.
Conclusion
This project represented a step forward in behavior-based freight modeling. Together, MAG, PAG, and ADOT were able to develop a fully-operational megaregion model. Other notable outcomes of this project included:
- Significant data collection, review, and analysis activities.
- Implementation of new modeling approaches (e.g., a firm synthesis model that estimates business population over time and space, implementing the Roth-Peranson algorithm for buyer and supplier matching).
- Development of visualization tools used to better understand and communicate model output.
This new model will assist MAG, PAG, and ADOT planners in coordinating policy development. It will also be an effective tool for improving freight operations across the Sun Corridor megaregion. In addition, this model provides planners in the region with a new tool to better understand different transportation planning and policy scenarios. As the model is used and refinement continues, the project team hopes that future integration with the regional economic models will help PAG, MAG, and ADOT understand how freight movement interacts with other transportation factors and economic indicators in supporting the region's economic development.
Product Information
Product Title: SHRP2 C20: Behavior-based Freight Demand Model
Agency Name: Maricopa Association of Governments
Contact Information:
Name: Vladimir Livshits
E-mail: vlivshits@azmag.gov
Phone: 602-254-6300
Resources
This section includes resources and related project documentation.
Technical Documentation
- Maricopa Association of Governments (2017). Mega-Regional Multi-Modal Agent-Based Behavioral Freight Model: MAG Next Generation Freight Demand Model (Final Report). Phoenix, AZ. Available on-line at: Available on-line at: http://azmag.gov/Portals/0/Documents/MagContent/TRANS_2017-02-13_SHRP2-TRANS_2017-06-06-C20-MAG-Next-Generation-Freight-Demand-Model-Update.pdf last accessed May 22, 2017.
1 Federal Highway Administration (2016). Megaregions and Multi-Jurisdictional Planning. Washington, DC. Retrieved from https://www.fhwa.dot.gov/planning/megaregions/case_studies/, last accessed November 29, 2016. [ Return to note 1. ]
2 Regional Plan Association. America 2050: Arizona Sun Corridor. New York, NY. Retrieved from http://www.america2050.org/arizona_sun_corridor.html, last accessed November 29, 2016.. [ Return to note 2. ]
3 J. Xu, K. L. Hancock, and F. Southworth. (2003) "Simulation of Regional Freight Movement with Trade and Transportation Multinetworks," Transportation Research Record 1854. [ Return to note 3. ]
4 Maricopa Association of Governments (2017). Mega-Regional Multi-Modal Agent-Based Behavioral Freight Model: MAG Next General Freight Demand Model (Final Report). Phoenix, AZ. [ Return to note 4. ]
5 Alvin Roth and Elliott Peranson (1999). "The Redesign of the Matching Market for American Physicians: Some Engineering Aspects of Economic Design." The American Economic Review 89 (4): 756–757. [ Return to note 5. ]
6 Maricopa Association of Governments (2017). Mega-Regional Multi-Modal Agent-Based Behavioral Freight Model: MAG Next General Freight Demand Model (Final Report). Phoenix, AZ. [ Return to note 6. ]
7 Ibid. [ Return to note 7. ]

The second Strategic Highway Research Program (SHRP2) is a partnership of the Federal Highway Administration (FHWA), the American Association of State Highway and Transportation Officials (AASHTO), and the Transportation Research Board (TRB). TRB completed the research, and now FHWA and AASHTO are jointly implementing the resulting SHRP2 Solutions that will help the transportation community enhance productivity, boost efficiency, increase safety, and improve the reliability of the Nation's highway system.
FOR MORE INFORMATION
Vladimir Livshits
System Analysis Program Manager
Maricopa Association of Governments
Phone: 602-254-6300
E-mail: vlivshits@azmag.gov
Jeffrey Purdy
Federal Highway Administration
Office of Freight Management and Operations
Phone: 202-366-6993
E-mail: Jeffrey.Purdy@dot.gov
Learn more about the SHRP2 program, its Capacity focus area, and Freight Demand Modeling and Data Improvement (C20) products at www.fhwa.dot.gov/GoSHRP2/
STRATEGIC HIGHWAY RESEARCH PROGRAM
U.S. Department of Transportation Federal Highway Administration
American Association of State Highway and Transportation Officials – Transportation Research Board