A Climate of Choice: Understanding the Environment that Shapes Decisions in Washington's Food and Grain Supply Chain - Freight Demand Modeling and Data Improvement Implementation Support
Printable Version [PDF, 3.1 MB]
You may need the Adobe® Reader® to view the PDFs on this page.
Contact Information: Freight Feedback at FreightFeedback@dot.gov

U.S. Department of Transportation
Federal Highway Administration
Office of Operations
1200 New Jersey Avenue, SE
Washington, DC 20590
FHWA-HOP-17-016
August 2017
Table of Contents
Executive Summary
Challenges
Representing more than 1.4 million jobs and nearly $130 billion in regional domestic product, freight-related industries make up a significant portion of Washington State's economy.1 Within the transportation sector, several opportunities exist to reduce greenhouse gas emissions, including converting from traditional to alternative fuels, diesel retrofits, emission treatment technologies, or idle reduction devices. However, planners traditionally had little insight how State policy scenarios aimed at reducing freight emissions would affect the freight system. Given the importance of the State's freight industry and lack of understanding regarding different policy scenarios, the Washington State Department of Transportation (WSDOT) completed a study to collect both qualitative and quantitative data from two of the State's major supply chains: wheat production and food delivery.
Approach
A literature review was conducted to identify key actors within the supply chains and provide insight into the data collection plan. Qualitative interviews were conducted to understand the wheat– and food–related supply chain responses to market conditions and potential policy changes aimed at reducing freight emissions. Surveys were developed to explore hypothetical policy and market scenarios focused on financial incentives/disincentives for alternative fuels, changes in fuel costs, and changes to alternative fuel technologies. Finally, truck counts were conducted at grocery stores in the Puget Sound area to understand truck behavior at the user-end of the food supply chain.
Outcomes
This project provided insight into the characteristics and transportation practices of key contributors within two important supply chains in Washington. In addition, the project collected data on past experiences and helped focus thought on long-term strategies regarding market-related (e.g., supply and demand, fuel prices) and policy-related (e.g., greenhouse gas reduction) scenarios, helping to improve WSDOT's ability to plan freight movement under a variety of potential future conditions.
Integration Into Business Practices
Findings and data collected during this project can be used to improve and refine the Washington State Supply Chain Model as well as to understand supply chains' behavioral responses to various State policy scenarios. WSDOT will apply information gleaned during this project to its 2017 State Freight Mobility Plan update.
Introduction
Background
Approximately 44 percent of Washington State's jobs were in a freight-dependent industry in 2012, making it one of the most trade-dependent U.S. States.2 Shown in Figure 1, freight-dependent industries represent more than 1.4 million jobs and nearly $130 billion in regional domestic product. In an effort to guide cost effective capital and operating investments in Washington's freight system, Washington State Department of Transportation (WSDOT) completed a multi-year effort consisting of significant stakeholder outreach, data collection, and data analysis to develop the State's Freight Mobility Plan. Completed in 2014, WSDOT's Freight Mobility Plan aligns State policy and plans with national freight goals and helps ensure maximum benefit and efficient movement of goods.
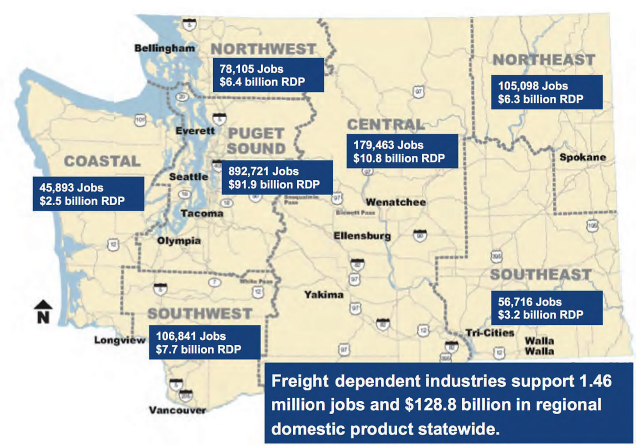
Figure 1. Freight-related Economic Benefits in Washington State.3
Source: Washington State Department of Transportation
At the same time that Washington State's Freight Mobility Plan was being developed, the State was also developing Results Washington, a statewide strategic framework for defining goals and managing performance. One of the five high-level goals within this new framework is sustainable energy and a clean environment by reducing transportation-related greenhouse gas emissions. Further, the Governor signed Executive Order 14-04 in April 2014 to reduce carbon pollution in Washington State.4
The Freight Mobility Plan lists three major components of Washington State's freight system:
- Global Gateway (international trade).
- Made in Washington (domestic trade).
- Delivering Goods to You (the last-mile).
The Freight Mobility Plan also highlights major statewide supply chains, such as aerospace components, apples, wheat, milk, and potatoes.
To improve the State's freight system and investigate opportunities to reduce freight-related greenhouse gas emissions, WSDOT applied for and was awarded SHRP2 C20 implementation assistance. The assistance allowed WSDOT to provide the necessary information to support ongoing development and refinement of the Washington State Supply Chain Model. It also allowed WSDOT to collect data to understand supply chains' behavioral responses to different State policy scenarios aimed at reducing freight emissions and their impacts on the freight system. Consistent with the State's Freight Mobility Plan, the project focused on two of Washington State's important supply chains: the food distribution supply chain in the central Puget Sound and the cross-state wheat supply chain. Selecting these supply chains helped WSDOT better understand both rural (wheat) and urban (food delivery) freight issues and needs.
Project Team
Led by WSDOT, the core project team included the Federal Highway Administration (FHWA) and two universities. A description of each partner's role is shown in Table 1.
| Project Partner | Role |
|---|---|
| Washington State Department of Transportation | Provided project management and coordination. |
| Federal Highway Administration | Provided coordination support as well as technical and administrative guidance. |
| University of Washington | Led research on the food distribution supply chain. |
| Washington State University | Led research on the wheat supply chain. |
Objectives
The project team identified four project objectives to better understand the impact of congestion on freight shipments in the MARC region. Key objectives and the work approach are detailed in Table 2.
| Objective | Work Approach | Outcomes |
|---|---|---|
| Understand the wheat and food distribution supply chains. | Literature review. | Identified major actors and characteristics of the State's wheat and food supply chains. |
| Collect data relevant to the supply chains. | Collect data via interviews, surveys, and truck counts. | Insight from major contributors in the relevant supply chains, better understanding of last- mile truck movements and issues. |
| Draw conclusions. | Review and analyze collected data. | Understanding of the target supply chains and the impact of public policy and market forces on them. |
Process
Project Management
As described in the introduction, significant background efforts had been completed leading up to the start of this project. WSDOT secured the support of two universities to conduct research, with each focusing on a single supply chain (e.g., wheat and urban food delivery). While each university focused on its specific research questions, WSDOT held frequent project meetings to discuss overarching project needs and issues and integrate findings from each of the research questions to understand how they would affect and could be used by WSDOT following the completion of the project.
Project Implementation
The research approach is detailed below, with the following representing significant research activities:
- Literature review.
- Data collection.
- Data analysis.
Literature Review
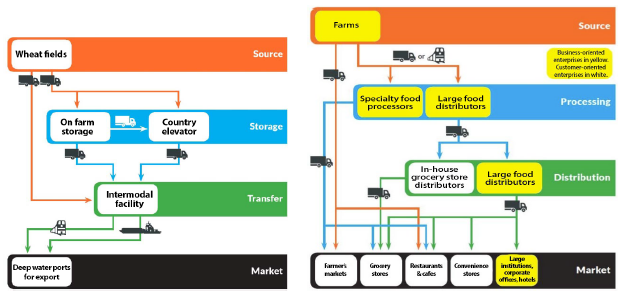
The main objective of the literature review for the wheat supply chain was to characterize the supply chain and identify available data. The literature review documented that most wheat produced in Washington is grown in the rural Eastern part of the State and shipped to West Coast ports for export. Typically, trucks move wheat from the source to the storage and transfer locations and then barges or trains move it to the deep water ports. For the food distribution supply chain, goods flow from farms to food retailers, in many cases stopping at food processors and food distributors. An illustration of the typical wheat and food distribution supply chains is shown in Figure 2.
The literature review for the food distribution component of the project also focused on data collection methods for freight transportation and the topic of natural gas conversions for heavy vehicles. The most commonly used methods of data collection on truck activity found in the literature were travel diaries or surveys, manual counts, and Global Positioning System (GPS) data collection. Travel diaries and surveys are most commonly used due to their simplicity, however, research has shown that these methods can be plagued with issues due to low response rates and underreported trips. Manual counts were useful when the study area could be limited to a few entrance and exit points. GPS data provides very detailed information about truck movements, but can be difficult to obtain as trucking companies typically prefer to keep their routes and delivery information proprietary to avoid losing any competitive advantage.
Data Collection and Results
Wheat Suppliers: A wheat supplier typically consolidates wheat from nearby farms, identifies markets, and promotes the sale of wheat. While there are thousands of wheat farms in Washington State, there are 26 major wheat suppliers. The combination of these two facts made wheat suppliers an ideal source for data. A survey was developed to collect data from the wheat suppliers, focusing on several topic areas: responses to market conditions, responses to policy conditions, fuel alternatives, technological barriers, and logistical barriers.
The project team was successful in obtaining survey responses from 73 percent of the State's major wheat suppliers (19 of 26). In terms of modal choice, the data showed that wheat moved in Washington is typically moved from the farm by truck, and then loaded onto a train or barge for longer distance moves, and that cost and location are often the primary factors for transportation mode choice. While these truck movements are short, they are dispersed over large regions and often include many roadways that are not typically considered freight corridors based on freight volume.
Within the three years prior to this project, about half of the surveyed wheat suppliers modified transportation decisions based on market conditions (e.g., changes in transportation costs, changes in market demand). Of those that responded, most shifted goods from rail to barge and most also changed the timing of one or more shipments. These transportation changes are examples of wheat suppliers' attempting to minimize the impact of market-based fluctuations on their operations. Other examples included hedging against fuel surcharges, improving facilities to handle larger trucks, improving warehousing to enhance efficiency, and transporting shipments via a specific mode or carrier (e.g., shortline) to support future availability of that mode or carrier.
Slightly fewer wheat suppliers indicated changes to transportation decisions based on government policies (43 percent vs. 47 percent based on market conditions). Responses to questions related to policy conditions varied with the respondents, and no single policy was identified as most likely to cause changes in transportation decision-making. Half of the respondents have changed shipment timings due to policy conditions (e.g., seasonal weight restrictions). Few wheat suppliers indicated any mode shift due to policy conditions.
Survey responses from the wheat suppliers provided great insight into the use of alternative fuels for wheat shipments. Respondents who have considered alternatives to gasoline or diesel fuel cited the cost and availability of the fuel and unit power to navigate the hilly region as significant concerns for alternative fuels and corresponding equipment. The fact that most wheat in Washington is moved in rural areas away from major freight corridors makes it difficult to establish infrastructure required to support fueling alternative fuel vehicles. The power output from these vehicles is typically less than that of traditional diesel trucks. With the current state of the practice for wheat shipment moving toward larger trucks making fewer trips, the need for high power output from alternative fuel vehicles is critical, especially when navigating the hilly terrain that makes up much of Washington's farmlands.
Food Distribution: Multiple approaches were taken to collect data on the State's food distribution supply chain: interviews, surveys, and manual truck counts. Qualitative interviews were conducted to understand the food industry's response to potential policy and market condition changes aimed at reducing freight emissions. The surveys were developed based on findings from the interviews and provided the respondents hypothetical policy and market scenarios focused on financial incentives/ disincentives for alternative fuels, changes in fuel costs, and changes to alternative fuel technologies. Finally, truck counts were conducted at grocery stores in the Puget Sound area to understand truck behavior at the user-end of the food supply chain.
The project team interviewed a diverse sample of distributors, retailers, and producers at the local and national geographic scales. Candidates were selected through online research as well as existing contacts. Selection criteria included physical location within the Puget Sound region, willingness to be interviewed, availability, and involvement in the food distribution supply chain. Interviewed individuals typically fell into one of two categories: (1) those with knowledge regarding company long-term strategies, and (2) those with knowledge of day-to-day operations.
Interview findings aligned with the type and size of company interviewed. The two types of businesses were described as business-oriented distributors and consumer-oriented distributors. Business-oriented distributors typically serve other businesses. Because business-oriented distributors typically have fewer customers that buy in higher quantities than consumer-oriented distributors, each customer has more input into transportation-related actions and decision-making. The project team defined small companies as those managing a fleet of 40 or fewer trucks with a single facility and large companies as those managing more than 40 trucks and multiple facilities.
Findings from the interviews with those involved in day-to-day operations provided insight into last-mile issues, such as navigating delivery trucks in the urban Puget Sound region as well as parking to make deliveries. Drivers indicated that they typically would only make one trip around the block to find parking for a delivery; if no parking was available, drivers would park where convenient for the delivery (e.g., turn lane, thru traffic lane), whether or not it was an acceptable parking location. Drivers also indicated that they preferred to avoid locations with narrow travel paths or limited visibility (e.g., narrow streets with on- street parking, loading areas within parking structures).
Responses to interview questions regarding company history and thoughts on alternative fuels differed based on company size. Larger companies more commonly considered or had tested alternative fuel vehicles than smaller companies. Both of the large grocery store chains interviewed had experimented with natural gas delivery vehicles, and both reported hesitations in using the technology on a widespread basis due to the lack of power when compared to traditional diesel engines as well as the limited availability of refueling stations. Two major food distributors did not purchase any alternative fuel vehicles; however, they did conduct a cost-benefit analysis and determined that at the time of the analysis, benefits of using alternative fuel vehicles did not outweigh the costs. Smaller companies had not seriously considered testing or adding alternative fuel vehicles to their fleet, citing the high costs of conversion equipment and new vehicles.
Other common concerns cited by interviewees included Hours of Service regulations, fuel efficiency and fuel use reduction, and particulate matter filter regulation. All of the large food distributors interviewed cited Hours of Service regulations restricting worker hours as affecting their businesses due to larger service areas and longer distribution routes. Small food distributors were less affected by these regulations as drivers for smaller food distributors typically spent a large percentage of their time conducting non-driving related tasks, such as unloading goods or interacting with store employees, and these distributors typically have smaller service areas than large distributors. Fuel efficiency was the second most commonly cited cost concern among all of the food distribution companies. Larger firms reported giving more attention to maximizing efficiency (e.g., minimize trips, ensure fully-loaded trailers, incorporate loaded return trips) than smaller firms. Smaller firms typically did not have the resources to purchase newer, more fuel-efficient vehicles or to calculate and optimize efficiency across delivery routes. Similar to responses for fuel efficiency, larger companies more commonly considered vehicle emissions when purchasing equipment. Several responses indicated that regulations on vehicle emissions affected their operations by reducing vehicle performance or complicating vehicle maintenance.
After completing the interviews, the project team developed an online survey to assess stakeholder reactions to hypothetical policy scenarios. The scenarios were designed to address the negative aspects of previous policies discussed during the in-depth interviews and incorporated any suggestions given by the supply chain firm or grocery store employees. Scenarios included public financial incentives or disincentives, changes in the cost of diesel and natural gas, and competitors' actions on natural gas technology.
The project team identified 224 companies involved with food production, food distribution, or food sale in the Puget Sound region through a business database. Of those 224 companies, contact information was included in the database for 61 individuals. The project team sent the online survey by e-mail to the 61 individuals. The project team received only five survey responses, preventing the team from conducting any worthwhile review or analysis of the results; low response rates are typical for this type of surveys.
To understand truck behavior at the last-mile of the food distribution supply chain, the project team conducted truck counts at 12 grocery stores in the Puget Sound region. Locations were selected to include a mix of rural, suburban, and urban locations. Given the complexity of truck maneuvers around grocery stores (e.g., multiple entrances and exits, multiple parking locations and/or loading bays), truck counts were completed by human observers. Observations occurred on weekdays between 6:00 AM and 1:00 PM to capture periods of most significant truck activity. Data collectors were stationed at locations where the loading dock and parking lot were visible; if such a location did not exist, a data collector would watch the entrances to the facility and follow trucks to their destination. Data collectors took time- stamped photographs of all vehicles as well as notes about vehicle dwell time and other details deemed important.
Table 3 shows the results of the truck count data collection. Across all grocery store types, the peak average truck arrival rate began at 9:00 AM, and deliveries occurred most frequently between 7:00 AM and 11:00 AM. With a median dwell time of 24 minutes, both urban and suburban stores both had similar truck dwell times. However, the data collection found that rural stores had longer dwell times, with the median dwell time being 36 minutes. This longer dwell time can be explained by the fact that deliveries to rural stores were spread out during the day allowing drivers more time to unload goods.
| Type | 6:00 AM | 7:00 AM | 8:00 AM | 9:00 AM | 10:00 AM | 11:00 AM | 12:00 PM | Total Average |
|---|---|---|---|---|---|---|---|---|
| Overall Average | 1.4 | 2.1 | 2.2 | 2.5 | 2.3 | 1.4 | 0.2 | 11.1 |
| Urban Average | 0.7 | 3.7 | 2 | 2 | 2 | 1.7 | 0.3 | 12.3 |
| Suburban Average | 2.7 | 2 | 2.7 | 3.7 | 2.7 | 0.7 | 0 | 14.3 |
| Rural Average | 1 | 1 | 2 | 2.3 | 2.3 | 1.3 | 0 | 9.8 |
The combination of truck counts and interviews also uncovered several differences in how deliveries are made between small and large distributors. Large distributors were more likely to make fewer deliveries each week, use step-vans and semi-trailer trucks, and unload at the store's loading dock. Small distributors were more likely to make daily deliveries, use box trucks and vans, and make their deliveries through the grocery store's front door.
Outcomes
Project Benefits
This project provided insight into the landscape, characteristics, and transportation practices of a range of key contributors within the wheat and food supply chains, two important economic engines in Washington. In addition, the project collected data on past experiences and helped focus thought on long-term strategies regarding market-related (e.g., supply and demand, fuel prices) and policy-related (e.g., greenhouse gas reduction) scenarios, helping to improve WSDOT's ability to plan for freight movement under a variety of potential future conditions.
The project team successfully collected interviews, surveys, and site-specific truck counts at twelve grocery stores in the Puget Sound area. Interview results provide the project team with insight into urban and rural supply chains, willingness to change to alternative fuels, and truck trip activity in support of food distribution.
Interviews, surveys, and truck counts resulted in good coverage of the regional grain suppliers as well. From this data collection effort, truck origin and destination information could be used for planning purposes and identification of data needed and available to support the inclusion of wheat supply chain information in a statewide freight model.
Transferability of the Project
The methodology developed during this project can be applied to gain an understanding of food-related supply chains in other regions of the United States. Findings and results from this project have been grouped by population density (e.g., urban, rural) and food distributor size. These groupings will allow transportation planners to use results most relevant to their location.
Lessons Learned
Having an established relationship with the individuals or organizations to be interviewed or surveyed is important. Conducting "cold calls" and initially contacting organizations via e-mail often ended up as a dead end or took several weeks to identify the correct individual to interview. The project team found more success with in-person interviews as those interviewed were more likely to elaborate on their responses and volunteer additional information. In addition, holding the interviews at the interviewee's facility often provided the project team with the ability to tour the facility and gain additional insight into the company's operations.
Respecting the interviewee's time and privacy is important. Interview questions should be direct and easily answered without needing to look up data. Interview responses should be anonymized. Much of the valuable information came from open-ended questions, so allowing interviewees to go off-script as they feel comfortable can provide valuable knowledge.
Although the use of human data collectors physically located at the facility is labor intensive, characteristics of food deliveries to grocery stores do not allow effective deployment of automated sensors to accurately capture truck deliveries. Further, human data collectors were able to collect more detail and context than automated sensors could have. It is important to position dedicated data collectors at each facility; the project team piloted a data collection procedure that involved data collectors rotating between multiple facilities daily, but found that this method had a 30 percent margin of error. It should be noted that the project team is developing a data collection approach using a laser scanner to overcome some of the data collection challenges and capture truck counts, but the technology was not available at the time of this project.
Next Steps
Several research needs were identified through this project. Future work should build upon the findings of this project. Information collected through interviews with wheat and food distribution supply chain actors shed light on their thoughts with regard to changes due to State policies regarding alternative fuels. More research is needed to quantify effects of these type of policies on freight movement in the State. Further, while the data sample size collected for this project was sufficient to meet the project's objectives, expanding the sample size would further improve WSDOT's understanding of the supply chains. WSDOT will be rolling information learned during this project into their 2017 State Freight System Plan update.
Conclusion
This project took an in-depth review of two of Washington State's important supply chains: the food distribution supply chain in the central Puget Sound region and the cross-state wheat supply chain providing the project team with an understanding of current practices and characteristics of these supply chains both in the rural (wheat) and urban (food distribution) settings.
The wheat supply chain in Washington contains thousands of participants, however, nearly all wheat farmed in the State flows through less than 30 buyers/shippers. While buyers/shippers can provide great insight into the movement of wheat and spend a significant amount of time arranging for the transportation of wheat, they often do not maintain a large fleet of trucks. Rather, buyers/shippers typically draw from a variety of independent owners and operators of trucks. As such, any policy aimed at incentivizing the conversion to alternative fuels for trucks carrying wheat should be aimed at owners with no more than a few trucks. In addition, interview findings show that potential shifts in wheat transportation practices will be more likely to come based on market conditions than policy changes. Data collected from the food distribution supply chain highlighted the similarities and differences between actor size, type, and location. Findings included details on the types and frequencies of food deliveries, and common issues felt by those involved with day-to-day operations as well as those involved with long-term company strategy.
At the current time, interviews with organizations involved in the wheat supply chain and the urban food delivery supply chain indicated that technology for alternative fuel vehicles has not matured enough to replace traditional engines. Specifically, interviewees cited the equipment cost, lack of engine power when compared to traditional engines, additional complexities these new technologies would add to fleet maintenance, and the lack of widespread fueling infrastructure as hurdles to adopting alternative fuels. Findings and data collected during this project can be used to improve and refine the Washington State Supply Chain Model as well as understand supply chains' behavioral responses to different State policy scenarios aimed at reducing freight emissions and the policies' impacts on the freight system in the State.
Product Information
Product Title: SHRP2 C20: Innovations in Local Freight Data
Agency Name: Washington State Department of Transportation
Contact Information:Name: Matthew Pahs
E-mail: PahsM@wsdot.wa.gov
Phone: 360-705-7139
Resources
This section includes resources and related project documentation.
Technical Documentation
Goodchild, A., Ukrainczyk, L., Sage, J., Casavant, K., Ivanov, B., and Pahs, M. (2016). Data Collection for Two Distinct Supply Chains: Food Distribution and Wheat. Olympia, WA. Retrieved from http://www.wsdot.wa.gov/NR/rdonlyres/4869900F-9E88-4B2E-968B-EF2CA3B3D1FD/111987/SHRP2C20WSDOT20160322.pdf, last accessed July 26, 2016.
1 Washington Department of Transportation (2014). Washington State Freight Mobility Plan: Executive Summary, Olympia, WA. [ Return to note 1. ]
2 Washington Department of Transportation (2014). Washington State Freight Mobility Plan, Olympia, WA [ Return to note 2. ]
3 Washington Department of Transportation (2014). Washington State Freight Mobility Plan: Executive Summary, Olympia, WA. [ Return to note 3. ]
4 Washington State Office of the Governor (2014), Executive Order 14-04: Washington Carbon Pollution Reduction and Clean Energy Action, Olympia, WA. [ Return to note 4. ]
5 Goodchild, A., Ukrainczyk, L., Sage, J., Casavant, K., Ivanov, B., and Pahs, M. (2016). Data Collection for Two Distinct Supply Chains: Food Distribution and Wheat. Olympia, WA. [ Return to note 5. ]
FOR MORE INFORMATION
Matthew Pahs
Washington State Department of Transportation
Phone: 360-705-7139
E-mail: PahsM@wsdot.wa.gov
Jeffrey Purdy
FHWA - Office of Freight Management and Operations
Phone: 202-366-6993
E-mail: Jeffrey.Purdy@dot.gov
Learn more about the SHRP2 program, its Capacity focus area, and Freight Demand Modeling and Data Improvement (C20) products at https://www.fhwa.dot.gov/GoSHRP2/

The second Strategic Highway Research Program (SHRP2) is a partnership of the Federal Highway Administration (FHWA), the American Association of State Highway and Transportation Officials (AASHTO), and the Transportation Research Board (TRB). TRB completed the research, and now FHWA and AASHTO are jointly implementing the resulting SHRP2 Solutions that will help the transportation community enhance productivity, boost efficiency, increase safety, and improve the reliability of the Nation's highway system.
STRATEGIC HIGHWAY RESEARCH PROGRAM
U.S. Department of Transportation Federal Highway Administration
American Association of State Highway and Transportation Officials – Transportation Research Board