The Cost of Congestion: An Innovative Approach to Utilizing Waybill Data to Support Freight Transportation Planning and Analysis - Freight Demand Modeling and Data Improvement Implementation Support
Printable Version [PDF, 1.7 MB]
You may need the Adobe® Reader® to view the PDFs on this page.
Contact Information: Freight Feedback at FreightFeedback@dot.gov

U.S. Department of Transportation
Federal Highway Administration
Office of Operations
1200 New Jersey Avenue, SE
Washington, DC 20590
FHWA-HOP-17-015
August 2017
Table of Contents
Executive Summary
Challenges
A challenge with collecting and using freight shipment data is the proprietary nature of the freight industry. Freight stakeholders, such as shippers and carriers, keep the details of their shipments proprietary to maintain a competitive edge in an industry with extremely slim margins. As such, little research has been completed to understand the correlation between congestion and freight shipment costs.
Approach
The emergence of two relatively new datasets, the private sector Real-time Freight Intelligence (RTFI) commercial freight waybill dataset and the Federal Highway Administration's National Performance Measure Research Dataset (NPMRDS) have allowed researchers an opportunity to better understand the correlation between freight shipment costs and congestion. A project proposed by the Mid-American Regional Council (MARC) was one of seven projects selected to develop and pilot innovations in local freight data under the Strategic Highway Research Program 2 (SHRP2) C20 program. This project developed an analytical approach to identify common commodities and shipment routes originating in the MARC region, extracted pertinent information from freight waybill data, and calculated performance measures for selected shipment routes to understand how highway congestion affects freight shipment costs.
Benefits
The new analytical approach defined through this project allows transportation planners to conduct analysis by distance and specific route to correlate cost and freight movement on congested roadways. This information provides planners the ability to understand how localized congestion can affect the region's freight industry. Insight into the correlation between freight shipment costs and congestion strengthen MARC's ability to identify and prioritize transportation infrastructure investments.
Integration Into Business Practices
This project allows MARC and other regional partners to assess the economic competitiveness of their most relevant highway networks. In this initial stage, outcomes from the project allow the region to examine competitive advantage, disadvantage, and efficiency on freight lanes that connect the region to its most significant markets.
Introduction
Background
When congestion delays a freight shipment, the extra labor cost incurred due to the delay is either passed on to the consumer or absorbed by the freight carrier. Research to quantify the cost of congestion has been successful in developing some estimates (e.g., lost wages or excess fuel consumption), but data limitations had previously prevented researchers in detailing the specific links between freight shipment costs and congestion. As such, it is difficult to understand the direct economic impacts of congestion to freight carriers and other related businesses. The Mid-America Regional Council (MARC), the metropolitan planning organization (MPO) for the Kansas City region, traditionally used freight data available from the United States Department of Transportation (USDOT) and United States Census Bureau for transportation planning. To better inform transportation project prioritization, MARC investigated the possibility of using new data to establish regional performance measures that quantify the impact of congestion on the cost of freight movement. With these performance measures, MARC could better estimate the economic impact of potential projects in an effort to understand how these projects would improve the region's economic vitality.
The availability of new datasets, such as the Federal Highway Administration's (FHWA) National Performance Management Research Data Set (NPMRDS) and the private sector Real-time Freight Intelligence (RTFI) commercial freight waybill dataset, allow researchers to begin to calculate the impact of congestion on cost of freight movement. Together, these datasets provide detailed and specific cost information on freight shipments as well as average travel times along major highways. MARC applied for and was awarded SHRP2 C20 assistance to use these datasets to address future freight planning needs and to establish targets that properly demonstrate congestion-related impacts to the cost of freight movement.
Project Team
MARC and their consulting team utilized a proprietary commercial freight waybill dataset. The project team also worked with the University of Maryland's Center for Advanced Transportation Technology (CATT) laboratory to gain access to the laboratory's advanced analytical tools. The project team used these tools to examine the large volumes of NPMRDS data needed for the project as well as identifying, extracting, and calculating measures of highway performance.
| Project Partner | Role |
|---|---|
| Mid-America Regional Council | Provided project management, coordination, and ultimately will integrate findings into their planning process. |
| University of Maryland | Provided access to advanced analytical tools to process National Performance Management Research Data Set data. |
| Federal Highway Administration | Provided coordination support as well as technical and administrative guidance. |
Objectives
The project team identified four project objectives to better understand the impact of congestion on freight shipments in the MARC region. Key objectives and the work approach are detailed in Table 2.
| Objective | Work Approach | Outcomes |
|---|---|---|
| Identify study area. | Identify major freight activity generators in the region. | A defined area to and from which shipments are tracked. |
| Identify commodities and origin/ destination pairs for analysis. | Review the freight waybill dataset to identify clusters of locations to and from which similar commodities are being shipped. | Eight origin/destination pairs used to calculate shipment costs. |
| Measure performance. | Analyze the NPMRDS data to calculate highway performance between select origins and destinations. | Performance of selected routes. |
| Draw conclusions. | Determine correlation between cost profiles and performance indexes. | Correlations, if present, between shipment costs and highway performance. |
Process
Project Management
MARC selected a consulting team to lead the research based on the ability to source a proprietary freight waybill dataset maintained in the private sector. The waybill dataset includes specific origins and destinations at the street address level, as well as specific commodity codes. This data resource also contains details not found in other, similar sources, such as current shipment costs.
Project Implementation
Prior to starting, the project team developed a research approach and hypotheses to determine the extent to which variation in shipment costs can be attributed to congestion. The research hypotheses are shown in Table 3.
| Research Hypothesis | Description |
|---|---|
| Research Hypothesis #1. | A definitive relationship exists between the actual costs incurred to move goods and the amount of recurring delay that exists on the segments of roadway on which shipments are completed. |
| Research Hypothesis #2. | Variations in actual costs (due to factors that cannot be attributed to delay) can be identified and controlled for in a repeatable manner. |
| Null Hypothesis. | No definitive relationship can be identified between the actual cost incurred to move goods and the amount of recurring delay that exists on the segments of roadway on which shipments are completed. |
The research approach is detailed below, with the following representing significant research activities:
- Determine the geographic footprint of the study area.
- Select origin/destination pairs to study.
- Measure highway performance over selected origin/destination pairs.
- Determine correlations between cost and performance.
Study Area
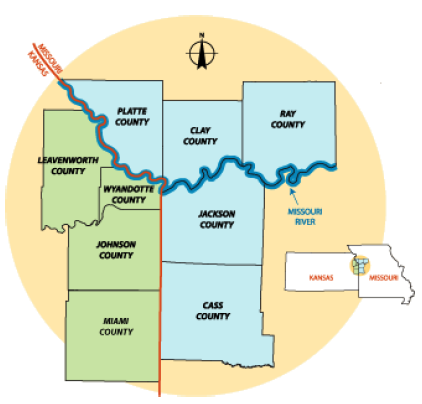
First, the project team defined the study area for the MARC region based on the locations of major freight activity generators in the region. The final geographic footprint represented 13 counties spanning both Kansas and Missouri. Defining the study area was a critical task as it defined the region through which the project team would identify originating freight shipments.
Determine Origin and Destination Pairs
With the study area selected, the project team next sought to determine origin and destination pairs for analysis. For the purpose of this project, the project team determined that all analysis be focused on a sample of freight shipments originating from the study area. To determine what shipments make up this sample, the project team queried the waybill dataset to select all freight shipments originating in the study area during the one-year study time period.
The project team next applied filters to assist in selecting destinations to allow the most robust analysis. Any null or obvious outlier data were filtered out from the dataset. Then the project team applied three filters to the data: only truckload data was used, trip distances must be greater than or equal to 50 miles, and shipment weight must be greater than or equal to 2,000 pounds. Less-than-truckload shipments are often routed differently than truckload shipments, and there is less consistency in costs across industries. As such, the project team determined that separating truckload and less-than-truckload data and focusing on the truckload data was likely to provide the most useful findings. The minimum trip distance of 50 miles was selected to filter out very short trips as short trips can vary greatly in cost, especially if a minimum charge is applied to the shipment. Further, NPMRDS was selected as the data source for measuring performance, which focuses on the National Highway System (NHS) and is not as useful in measuring performance over short distances. Finally, a minimum shipment weight was assigned for similar reasons; heavier shipments produce more uniformity in costs since many carriers apply a minimum charge regardless of shipment weight.
Shipments originating from the study area and meeting the query constraints were clustered by destination zip code. The study area was divided into four quadrants to assist in identifying candidate destination locations. For each quadrant, the project team queried all shipments originating in the quadrant and clustered the destination zip codes to identify destinations that had large enough sample sizes to support the analysis. To assist in filtering the potential destinations, the project team only reviewed those destinations that were less than 1,000 miles from the study area.
The project team carefully selected commodity types before choosing the shipment destinations to ensure that costs profiles were developed with like shipments. The waybill dataset includes the North American Industry Classification System (NAICS) code for each shipment. The project team used this field as a method for grouping like commodities. In addition to the NAICS code, the project team looked at shipment volume, variety in shipper/carrier combinations, and cost variance to narrow the pool of candidate commodities and shipment destinations. The team used these criteria to rank all available commodities and destinations and selected commodity and destination pairs with the largest volumes, most combinations of shippers and carriers, and most consistent costs.
The project team selected two commodities per quadrant of the study area. For each commodity, two destinations of similar distance from the study area were selected to compare costs. Table 4 lists each of the selected commodities and destination pairs.
| Quadrant | Commodity | Destination |
|---|---|---|
| 1 | Automobile Manufacturing | 1. Detroit, Michigan 2. Cleveland, Ohio |
| Automobile Manufacturing | 1. Memphis, Tennessee 2. Chicago, Illinois |
|
| 2 | Soft Drink Manufacturing | 1. Omaha, Nebraska 2. Wichita, Kansas |
| Paper, except Newsprint, Mills | 1. Omaha, Nebraska 2. St. Louis, Missouri |
|
| 3 | Chemical Manufacturing | 1. Dallas/Ft. Worth, Texas 2. Indianapolis, Indiana |
| Chemical Manufacturing | 1. Houston, Texas 2. Columbus, Ohio |
|
| 4 | Paper, except Newsprint, Mills | 1. Emporia, Kansas 2. Marshall, Kansas |
| Chemical Manufacturing | 1. Chicago, Illinois 2. Dallas/Ft. Worth, Texas |
Next, the project team developed a cost profile for each pair. The destination pairs for each commodity were selected to be similar in terms of route distance and geographic diversity. This allowed the project team to develop a cost profile for each destination and determine which routes involved significantly more cost than others, under the assumption that congestion may be a factor driving increased cost. Cost profiles were developed using average and median cost per ton (CPT) and cost per ton-mile (CPTM). As an example, a cost profile for automobile manufacturing shipments to Detroit, Michigan and Cleveland, Ohio is shown in Table 5.
| Category | Measure | Destination | Percent Difference | |
|---|---|---|---|---|
| Detroit, Michigan | Cleveland, Ohio | |||
| Cost | Average cost per ton. | $178.80 | $114.60 | 35.9% |
| Median cost per ton. | $164.43 | $111.96 | 31.9% | |
| Percent difference: average vs. median. | 8.73% | 2.36% | Not applicable | |
| Average cost per ton-mile. | $0.25 | $0.15 | 39.3% | |
| Median cost per ton-mile. | $0.23 | $0.15 | 37.8% | |
| Percent difference: average vs. median. | 4.93% | 2.36% | Not applicable | |
| Performance | Buffer index. | 0.24 | 0.19 | 19.9% |
| Planning time index. | 1.36 | 1.3 | 4.2% | |
| Travel time index. | 1.17 | 1.16 | 1.3% | |
| Average travel time (minutes). | 732.6 | 804.1 | Not applicable | |
| Average travel speed (miles per hour) | 58.69 | 59.49 | -1.4% | |
| Distance | Trip distance (miles) | 710 | 800 | Not applicable |
The cost profile example shows that, by cost per ton and cost per ton-mile, it is more than a third more costly to ship automobile manufacturing goods from the MARC region to Detroit, Michigan than to Cleveland, Ohio, based on the information listed in the waybill dataset.
Measure Highway Performance
To most efficiently extract performance data from the NPMRDS data applicable to the study origin and destination pairs, the project team received access to the Regional Integrated Transportation Information System (RITIS) of the University of Maryland's CATT laboratory. RITIS provided the project team with a tool pre-loaded with all relevant NPMRDS data and allowed for easy route entry and performance measurement calculations.
To determine the most likely route for each origin and destination pair, the project team entered each origin and destination into an on-line mapping service and selected routes in which the total mileage most closely matched the total mileage reported in the waybill dataset. After each route was defined, all road segments were entered into RITIS.
The project team next used RITIS to complete a performance summary analysis and develop a congestion profile for each route. The performance measures selected from the RITIS analysis were buffer index, planning time index, travel time index, average travel time, and average speed. The buffer index represents the extra time travelers must add in order to arrive at a destination by the intended time 95% of the time. The planning time index represents how much total time travelers should allow to ensure on-time arrival. Finally, travel time index represents the average travel time compared to the travel time during free-flow conditions.
Determine Correlations
To understand whether clear differences in shipment costs can be attributed to network performance, the cost and highway performance data were combined and analyzed. The project team selected median cost per ton-mile, planning time index, and travel time index as the three measures for comparison. These measures are shown in Figure 2 for six of the origin and destination pairs. Two of the eight origin and destination pairs were removed from Figure 2, due to distinct differences between the comparative factor values.
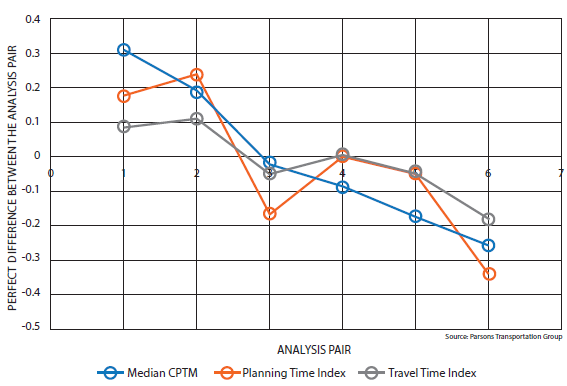
Figure 2. Comparison of shipment cost differences to network performance differences among similar shipments, large discrepancies removed.2
Source: Parsons Transportation Group
Outcomes
Project Benefits
This project provided greater insight into how delays due to highway congestion affect shipment costs. Establishing this link helps planners understand how investments in transportation infrastructure can affect the freight and business community of a region. The research has also provided the foundation for further investigation into how congestion affects competitiveness within freight-related industries. This gives planners the ability to highlight competitive advantages offered by the region or to identify and prioritize solutions to congestion that will provide the greatest level of improvement to freight stakeholders.
Transferability of the Project
Activities completed in this project are directly transferable to all other regions of the United States, with two stipulations. First, the region must have access to freight waybill data of a sufficient sample size. Second, this project's methodology focused on capturing highway performance of trips longer than 50 miles, and used NPMRDS data, which covers the NHS. Minor arterials and other secondary roadways are not included in the NPMRDS dataset. Transportation agencies interested in performance of shorter trips may need to supplement NPMRDS data with other data in order to use this approach.
Lessons Learned
The project team sought to understand the limitations a typical MPO might encounter when analyzing freight waybill and highway performance data, documenting several lessons learned.
While the RTFI database is current and vast, the degree to which data included in this database represent all freight shipments is unknown. Some commodities occur with a greater frequency in the dataset. If the distribution of commodity types in the study area do not follow a similar distribution to that shown in the RTFI database, it may be beneficial to obtain supplementary data. In addition, this project focused only on truckload data from the RTFI database. Further research into the less-than-truckload data may provide further understanding to goods movement in a region. Finally, while the RTFI database offers a wealth of information on types and costs of freight shipments, agencies hoping to use freight waybill data should have an understanding of the logistics industry before drawing conclusions directly from the data. For example, shippers and carriers often negotiate rates for recurring shipments and these rates are often different from the rate charged for an unscheduled or expedited shipment. Analysts using freight waybill data need to develop assumptions that distinguish between the two types of rates in order to best describe and use this type of data.
The project team encountered several issues using NPMRDS data to calculate performance measures. First, several sections of highway were identified for which the NPMRDS data was incomplete. Typically, these sections were in rural areas so congestion was not assumed to be present. Second, determining performance on specific sections of highway can be a significant task. The NPMRDS dataset is very large and the performance data is separate from the highway network data, requiring the user to complete an analytical step to link the two. Further, NPMRDS data is binned into five-minute intervals, organized by State and month. Given the length of routes studied in this project, some routes typically required several hundred million data records, significant computational time, and considerable processing power. Fortunately, the project team was able to access RITIS at the University of Maryland's CATT laboratory to facilitate the capture, processing, and analysis of the NPMRDS data. Finally, the congestion analysis included only congestion occurring on the NHS and did not include minor arterials and other secondary roadways as the NPMRDS does not include performance data on those roadways. Because the origin- destination pairs studied in this project were typically several hundred miles long, the project team assumed that non-NHS congestion would represent a negligible amount of the total congestion.
Next Steps
The research team identified several next steps to build on the project's findings. Additional research can be completed using the NPMRDS and waybill datasets to include additional trip pairs and commodities. MARC can investigate the freight routes explored in this project to better understand the degree to which localized congestion represents a significant portion of delay for each route. In such instances, MARC might conduct more detailed analyses to understand the cause of congestion and, ultimately, to plan improvements to those routes. Finally, findings from this project can be further explored to understand whether it is worthwhile to include the cost of congestion as a performance measure in regional freight travel demand models.
Conclusion
This project defined a novel approach through which to gain understanding of the ways in which highway congestion affects freight shipment costs. The project team uncovered several challenges that a typical MPO may encounter when attempting research of this type, and provided approaches to overcoming these challenges. Findings from this project indicate some correlation between congestion and freight shipment costs and identify potential improvements that will more clearly identify the link between congestion and cost. Finally, this project identifies ways in which transportation planners can apply the approach to their jurisdiction in order to prioritize transportation infrastructure investments.
Product Information
Product Title: SHRP2 C20: Innovations in Local Freight Data
Agency Name: Mid-America Regional Council
Contact Information:Name: Darryl Fields
E-mail: dfields@marc.org
Phone: 816-474-4240
Resources
More information on the University of Maryland's Regional Integrated Transportation Information System can be found at: http://www.cattlab.umd.edu/?portfolio=ritis.
1 Mid-America Regional Council (2016), MARC Member Cities and Counties, Kansas City, MO. [ Return to note 1. ]
2 Parsons Transportation Group (2016). Freight Data Integration in the MARC Region. [ Return to note 2. ]
FOR MORE INFORMATION
Darryl Fields
Senior Transportation Planner
Mid-America Regional Council
Phone: 816-474-4240
E-mail: dfields@marc.com
Jeffrey Purdy
FHWA - Office of Freight Management and Operations
Phone: 202-366-6993
E-mail: Jeffrey.Purdy@dot.gov
Learn more about the SHRP2 program, its Capacity focus area, and Freight Demand Modeling and Data Improvement (C20) products at https://www.fhwa.dot.gov/GoSHRP2/

The second Strategic Highway Research Program (SHRP2) is a partnership of the Federal Highway Administration (FHWA), the American Association of State Highway and Transportation Officials (AASHTO), and the Transportation Research Board (TRB). TRB completed the research, and now FHWA and AASHTO are jointly implementing the resulting SHRP2 Solutions that will help the transportation community enhance productivity, boost efficiency, increase safety, and improve the reliability of the Nation's highway system.
STRATEGIC HIGHWAY RESEARCH PROGRAM
U.S. Department of Transportation Federal Highway Administration
American Association of State Highway and Transportation Officials – Transportation Research Board