Dynamic Data Fusion: Mining Private Sector Relationships and Public Databases to Enhance and Predict Freight Movement
Printable Version [PDF, 1 MB]
You may need the Adobe® Reader® to view the PDFs on this page.
Contact Information: Freight Feedback at FreightFeedback@dot.gov

U.S. Department of Transportation
Federal Highway Administration
Office of Operations
1200 New Jersey Avenue, SE
Washington, DC 20590
FHWA-HOP-17-012
August 2017
BACKGROUND AND CHALLENGES
Recipient Agency: Capital District Transportation Committee
Location: New York State
Duration of Activity: 2014 to 2016
Budget: $150,000
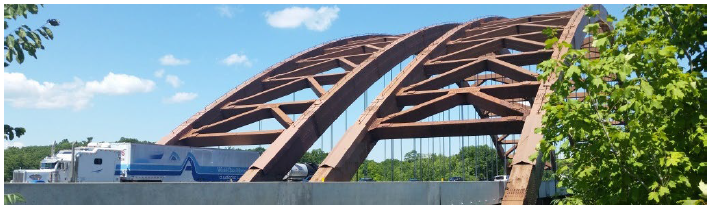
New York's "Capital District" serves as a transportation crossroads to many industries. Surrounded by major highway, rail, and maritime routes, the region is home to several major freight generators.
Effective regional freight planning demands timely data at the zip code or transportation analysis zone (TAZ) level. As the metropolitan planning organization (MPO) for the region, The Capital District Transportation Committee (CDTC) recognized the need to collect, integrate, and maintain freight-related data from multiple sources, including national freight datasets maintained by Federal agencies, commonly used public databases, and private data from freight shippers and industry.
CDTC assembled a project team and applied to the SHRP2 C20 Implementation Assistance Program for funding to develop an innovative data fusion process that integrated data from a variety of reliable sources, generated new freight data at the disaggregate spatial level, and can predict future freight activities for the region.
APPROACH
Project goals included:
- Identifying freight data sources and gathering available data.
- Collecting data related to freight trips, generation, and services from new private-sector sources.
- Cleaning and formatting all data for data fusion and integration.
- Initiating the development of a dynamic freight database for the CDTC region
| Objective | Work Approach | Outcomes |
|---|---|---|
| Identify and assess available data sources. | Conduct a scan of available data sources and identify potential new sources. | A list of target data sources. |
| Collect and refine available data. | Parse and compile existing datasets. | Cleaned and standardized version of existing freight data. |
| Collect new data. | Strengthen relationships to enhance data sharing among regional freight stakeholders. | New local freight datasets. |
| Process and fuse data. | Combine existing and new datasets. | New dynamic freight database. |
BENEFITS AND IMPACTS
Key elements that contributed to project outcomes and subsequent impacts include:
- Existing relationships with freight stakeholders in the region.
- Knowledge of existing freight data sources.
- Expertise in freight data collection.
- Experience processing and integrating disparate datasets.
Resources generated by the project include:
- A dynamic, geo-coded database in which available freight datasets are housed for use in local freight planning.
- Calibrated models that can be used to estimate freight flows (trips, generation, and services) at the ZIP code level.
- New freight data providing a clearer picture of goods movement in the region and enhancing the decision-making process for freight stakeholders.
- Improved relationships with the region's freight stakeholders.
Benefits
Benefits realized from this project include the ongoing use of the resources it created as well as the changes it may influence in stakeholder behavior. Specific outcomes are listed below:
| Outcome | Evidence |
|---|---|
| Increase in the number of data sources. | The database contains 14 datasets developed from 17 sources at the National, State and regional levels. |
| Better understanding of goods movement in the CDTC region. | The project team developed new resources specific to New York's "Capital District," including:
|
| New regional freight models. | The team calibrated models to estimate freight flows at the ZIP code level. |
| Understanding of data gaps. | Gaps identified during this process will now be used to help prioritize future data collection effort. |
The project team brought a long history of partnerships with the local freight community and used this experience to coordinate with stakeholders for data collection. First, the project team approached members of the CDTC Freight Advisory Committee. The project team also developed outreach materials describing the project (Figure 1) and distributed these materials to the New York State Motor Truck Association and the Owner Operators Independent Driver Association. Finally, the project team coordinated with several rail companies in the region to obtain travel time information to identify potential bottlenecks on the rail system.
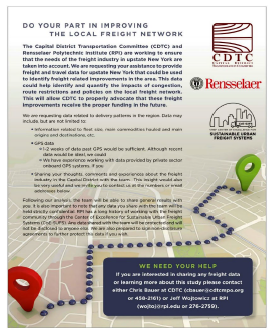
Figure 1. Image. Example of an outreach flyer distributed as part of the project.
Source: Capital District Transportation Source: Capital District Transportation Committee
Impacts
Impact measures are the ultimate benefits of using a product. These are longer term, value-added impacts of the product related to saving time, money, and lives.
| Impact | Application |
|---|---|
| Improved freight planning and modeling capability. | The project enabled CDTC to better understand how, why, and where the freight industry moves through the Capital region. The new database will be used in future planning and modeling activities to help ensure the efficient and sustainable movement of goods while maintaining quality of life among the region's communities. |
| Cost savings for freight data analysis. | Processes developed for this project increase the efficiency of future freight data collection and integration tasks. |
Figure 2 shows a data visualization developed from the new database. This database serves as a central location to house freight-related data for CDTC that the agency can use for future planning activities.
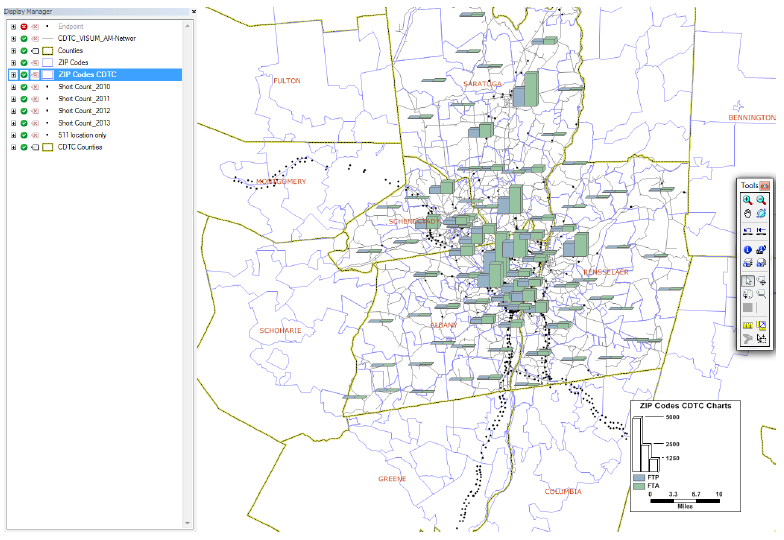
Figure 2. Image. Identifying freight trips produced and freight trips attracted at the ZIP code level.
Source: Capital District Transportation Committee
Next steps for CDTC include beginning to use the database and analyze the prepared data to make better freight planning decisions. Example freight planning activities that could be conducted in part due to the outcomes of this project include: estimating truck vehicle-miles traveled, forecasting truck flows, identifying truck bottlenecks, understanding the impact of trucks on roadway capacity, estimating truck-related emissions, evaluating truck routes, conducting cost-benefit analyses for freight projects, and working to gain a better understanding of the relationship between land use and truck traffic.
Source: Capital District Transportation Committee
PARTNERSHIPS
Capital District Transportation Committee (CDTC) – Provided project management and coordination.
Rensselaer Polytechnic Institute – Led research.
New York State Department of Transportation (NYSDOT) – Provided data.
New York State Department of Motor Vehicles – Provided data.
New York State Thruway Authority – Provided data.
New York State Office for Technology – Provided data.
Federal Highway Administration (FHWA) – Provided coordination support as well as technical and administrative guidance.
FOR MORE INFORMATION
Christian Bauer
Transportation Planner
Capital District Transportation Committee
Phone: 519-458-2161
E-mail: cbauer@cdtcmpo.org
Jeffrey Purdy
FHWA - Office of Freight Management and Operations
Phone: 202-366-6993
E-mail: Jeffrey.Purdy@dot.gov
Learn more about the SHRP2 program, its Capacity focus area, and Freight Demand Modeling and Data Improvement (C20) products at www.fhwa.dot.gov/GoSHRP2/

The second Strategic Highway Research Program (SHRP2) is a partnership of the Federal Highway Administration (FHWA), the American Association of State Highway and Transportation Officials (AASHTO), and the Transportation Research Board (TRB). TRB completed the research, and now FHWA and AASHTO are jointly implementing the resulting SHRP2 Solutions that will help the transportation community enhance productivity, boost efficiency, increase safety, and improve the reliability of the Nation's highway system.
STRATEGIC HIGHWAY RESEARCH PROGRAM
U.S. Department of Transportation Federal Highway Administration
American Association of State Highway and Transportation Officials – Transportation Research Board