Active Transportation and Demand Management (ATDM) Analytical Methods for Urban Streets
CHAPTER 2. EXISTING METHODOLOGIES
Following Task 1 – Project Management, Task 2 of the project involved a literature review and state-of-practice review of all relevant methodologies defined in the HCM, to identify if they were applicable to this work effort. To fulfill this task, it was first necessary to define the scope of the work effort, in terms of the most appropriate active transportation and demand management (ATDM) strategies for Highway Capacity Manual (HCM) implementation. To define the scope of the work effort, the research team conducted a review of prior HCM-based ATDM research on freeways, plus a review of urban street ATDM strategies. Results of this review were documented in a detailed technical memorandum in December 2015, and are repeated here in this chapter.
Based on stakeholder (i.e., peer review group) feedback, the team's knowledge of HCM methods, the review of HCM-based freeway ATDM research, and the review of urban street ATDM strategies, the research scope was narrowed to three specific ATDM strategies: adaptive signal control, reversible center lanes, and dynamic lane grouping. The research team believes there would be significant national interest in developing the ability to analyze impacts of these strategies in an HCM context, and without requiring micro-simulation. This chapter summarizes the information and thought process that led to the selection of the specific three strategies listed above.
ACTIVE TRANSPORTATION AND DEMAND MANAGEMENT ON FREEWAYS
When beginning the effort to incorporate ATDM concepts into the HCM, the Federal Highway Administration (FHWA) and Highway Capacity and Quality of Service Committee (HCQSC) focused solely on freeways for their initial implementations. This is likely due to the fact that ATDM strategy implementation is more common at the freeway level, and because arterial modeling is generally more complex than freeway modeling. The original freeway ATDM implementation effort for the HCM was documented and published in 2013 (Dowling, Margiotta, Cohen, & Skabardonis, 2013). The report points out an important concept, namely the lack of insight on how ATDM strategies will perform when implemented in the United States. The report encourages transportation analysts to choose any traffic analysis tool responsive to ATDM, and to consult the FHWA traffic analysis tool guidance documents. The report also emphasizes data requirements. In cases where sufficient amounts of data (e.g., 6-12 months of collected or observed data) are not available, alternatives and approximations are suggested. One key difference between this FHWA methodology and the current HCM is that the latter is limited to individual facilities, and does not assess system-wide performance.
The report summarizes freeway-level ATDM strategies, divided into three categories:
- Active demand management.
- Active traffic management.
- Active parking management.
The freeway ATDM report then describes the details of numeric performance measures. Conventional measures are said to perhaps not be sufficient, as they overlook the benefits of ATDM. The report then recommends the following measures:
- Vehicle-Miles Traveled (VMT)-Demand: Summation of the products of origin-destination (OD) trip table numbers, and shortest path distances for each OD.
- VMT-Served: Summation of the products of link lengths and vehicle volumes on the link.
- Vehicle-Hours Traveled (VHT): Summation of the products of total link volumes and average link travel times. This accounts for any delays to vehicles prevented from entering the facility either by controls (such as ramp metering) or by congestion.
- Vehicle-Hours Delay (VHD): Difference between VHT (including vehicle-entry delay) and theoretical VHT if all links could be traversed at the free-flow speed with no entry delays [VHT (FF)].
 Figure 2. Equation. Vehicle-hours delay (VHD).
- Average System Speed: The sum of (VMT-Served /VHT) for each scenario.
- Average delay per vehicle: The sum of VHDs for all scenarios divided by the sum of total vehicle trips for all scenarios.
- 80th percentile Travel Time Index (TTI80%): TTI provides a measure of travel time reliability.
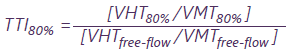 Figure 3. Equation. 80th percentile travel time index.
VHT and VMT in the numerator are the 80th percentile quantities. The report states that 80th percentile relates better to mean speed than 90th, 95th or 99th percentile quantities.
- Planning Time Index (PTI): This is another measure of travel time reliability. It is computed using the equation with 95th percentile values substituted for the 80th percentile values. For example, a PTI of 1.50 means that the traveler must allow 50 percent extra time over free-flow travel time to get to their destination on-time. Put another way, a commuter will arrive late one day per month (1 of out 20 weekdays) if they plan their trip at the PTI.
The report recommends assessing ATDM strategies for peak hours (same as HCM), but over all weekdays rather than a single weekday (different from HCM). The rationale behind this is that an agency would aim to operate a facility at levels that are annually optimal. If the aim is to cater to another time period and demand, then the assessment should be applied to the period of interest. Section 3.5 of the report provides performance measures for several United States facilities using actual field-measured data.
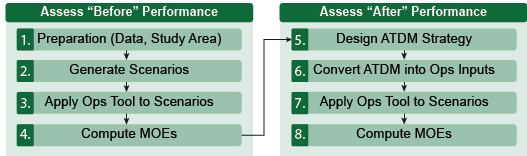
After defining and illustrating performance measures, Section 4 of the freeway ATDM report discusses assessment of ATDM strategies deployed in the field. The recommended analysis procedure shown in Figure 4 is performed before and after ATDM implementation. Furthermore, the "after" implementation is divided into "opening day" and "equilibrium" (i.e., 3-6 months after implementation) categories.
 MOE = measures of effectiveness, ATMD = active transportation and demand management
Figure 4. Chart. Flowchart of the active traffic demand and management analysis process.
Source: Cambridge Systematics
The "before" conditions are analyzed using historic data. These conditions are used to calibrate and
error-check the strategy through analysis tools. The "after" conditions are analyzed to determine
ATDM strategy effectiveness. As mentioned earlier, the analyst is free to choose any analysis tool
that is sensitive to ATDM (e.g., HCM, micro-simulation, meso-simulation).
Details of the steps are as follows:
- Preparatory Steps: Set the scope and purpose of the analysis, define a target study area, and
collect data.
- Generate Scenarios: Set "before" condition using historic data on demand, incidents, and
weather. Demand and capacity scenarios are generated to evaluate existing conditions, and to
test the new ATDM strategy.
- Apply Selected Operations Analysis Tool to Scenarios: The appropriate operations analysis
tool (e.g., HCM, simulation) is used to evaluate facility operations for each scenario.
- Compute MOEs (Performance Measures): The results from step 3 are combined to yield
throughput, delay, and travel time reliability measures for the "before" condition.
- Design ATDM Strategy: Based on an assessment of the "before" conditions and an
identification of the relative contribution of weather, demand, incidents, and work zones to the
undesirable performance of the facility or system, the analyst selects and designs an ATDM
strategy that he or she wishes to test. If ATDM is already in place for the before condition, then
the analyst identifies changes in the existing ATDM strategy to be tested.
- Convert ATDM Strategy into Operations Analysis Tool Inputs: This is a translation of
ATDM strategies into the appropriate demands, capacities, and control inputs required by the
operations analysis tool for each specific scenario.
- Apply Selected Operations Analysis Tool to Scenarios (Opening Day): Opening day demands are held essentially constant. Drivers are assumed to cooperate with the new controls in effect (wait for ramp meters, obey new speed limits, etc.) and take advantage of any new capacity provided (simple lane shifts, but no route, time-of-day, or mode shifts).
- Compute MOEs (Opening Day): Results output by the operations analysis tool for Opening Day are combined to yield the desired MOEs. "After" results are assessed by the analyst to determine if the ATDM strategy should be fine-tuned and reevaluated.
The same analysis tool is applied to the before, opening day, and long-term demand analysis conditions for each scenario. For longer term forecasts of ATDM investment benefits (e.g., 20 years or more), the three stages of analysis (i.e., before, opening day, long term) are repeated with 20-year forecasts of demand as the base condition. The opening day analysis is used to estimate ATDM operational effects in the future. Equilibrium analysis is then used to estimate the demand changes that would occur under ATDM.
Complete explanations for the above steps are provided in section 5 of the report. Section 6 illustrates an application of freeway ATDM strategies to estimate annual facility performance. The report walks through each of the 8 steps mentioned above with real data. In this section, the first strategy to be applied is "Convert HOV to HOT Lane." "Dynamic Ramp Metering" is then added, for an analysis of combined effects. Finally, "Traffic Incident Management" is analyzed in a stand- alone manner.
Step 6 ("Convert ATDM Strategy into Operations Analysis Tool Inputs") was a key factor in determining ATDM strategy impacts in an HCM context. For example, the freeway ATDM research team increased ramp merge section capacities by 3 percent to capture the capacity increasing effects of ramp metering. The team selected the value of 3 percent based on their review of recent research, but further recommended that this important value should be "determined by the user." Similarly, the team assumed high-occupancy vehicle (HOV) and high-occupancy toll (HOT) lane capacities of 1350 and 1500 vehicles per lane per hour, respectively, to capture before-and-after ATDM strategy impacts. Finally, in cases of traffic incident management, the team assumed a 10 percent decrease in traffic volume demand. Therefore, from the freeway ATDM research, reported ATDM strategy benefits from the before-and-after HCM reliability experiments were highly dependent on these key assumptions (e.g., 3 percent capacity increase, 10 percent demand decrease) within step 6. As such, a key question for the arterial ATDM research team revolved around whether a similar framework would be viable for urban streets; and if so, what key assumptions would be made in step 6.
The following sub-sections address existing ATDM methodologies in the context of arterial/urban streets. There is a substantial amount of literature available on ATDM; however, this review focuses on strategies potentially related to urban streets.
ACTIVE TRANSPORTATION AND DEMAND MANAGEMENT ON ARTERIALS
As shown in Table 1, most ATDM strategies can be classified within 4 categories. A brief description of each strategy (Kuhn, Gopalakrishna, & Schreffler, 2013) is provided in the Appendix.
Table 1. Classification of active transportation and demand management strategies
| Active Demand Management |
Active Traffic Management |
Active Parking Management |
Weather Related Strategies |
| Dynamic Ridesharing |
Dynamic Lane Use Control |
Dynamically Priced Parking |
Snow Emergency Parking Management |
| On-Demand Transit |
Dynamic Speed Limits |
Dynamic Parking Reservation |
Traffic Signal Preemption for Winter Maintenance Vehicles |
| Dynamic Pricing |
Queue Warning |
Dynamic Way- Finding |
Snowplow Routing |
| Predictive Traveler Information |
Adaptive Ramp Metering |
Dynamic Parking Capacity |
Anti-icing and Deicing Operations |
Active demand management (ADM) is a characteristic of the market. Planners must conduct a sensitivity analysis to estimate the feasibility and success of ADM strategies. The International Technology Scanning Program accesses and evaluates innovative foreign technologies and practices that have the potential to benefit the U.S. highway transportation systems. This approach allows for advanced technology to be efficiently adapted and put into practice, without spending scarce research funds to re-create advances already developed by other countries. Since 1990, around 70 such studies have been conducted on various aspects of transportation that also includes ATDM (Mirshahi, et al., 2007). Most of the cases are from European countries like the Netherlands, Germany, England, etc. Active traffic management (ATM) strategies aim to move traffic more efficiently, albeit in ways that do not involve demand management. They manage traffic using real-time data. Figure 5 (adapted from the FHWA) provides potential benefits of ATM.
Figure 5. Chart. Active traffic management strategies and potential benefits.
| Active traffic management strategy |
POTENTIAL BENEFITS |
| Increased throughput |
Increased capacity |
Decrease in primary incidents |
Decrease in secondary incidents |
Decrease in incident severity |
More uniform speeds |
More uniform driver behavior |
Increased trip reliability |
Delay onset of freeway breakdown |
Reduction in traffic noise |
Reduction in emissions |
Reduction in fuel consumption |
| Speed harmonization |
✓ |
 |
✓ |
✓ |
✓ |
✓ |
✓ |
✓ |
✓ |
✓ |
✓ |
✓ |
| Temporary shoulder use |
✓ |
✓ |
|
|
|
|
|
✓ |
✓ |
|
|
|
| Queue warning |
|
|
✓ |
✓ |
✓ |
✓ |
✓ |
✓ |
|
✓ |
✓ |
✓ |
| Dynamic merge control |
✓ |
✓ |
✓ |
|
|
✓ |
✓ |
✓ |
✓ |
✓ |
✓ |
✓ |
| Dynamic lane markings |
✓ |
✓ |
|
|
|
|
|
✓ |
|
|
|
|
| Construction site management |
✓ |
✓ |
|
|
|
|
|
✓ |
|
✓ |
✓ |
✓ |
| Dynamic truck restrictions |
✓ |
✓ |
|
|
|
✓ |
✓ |
✓ |
|
|
✓ |
✓ |
| Dynamic rerouting and traveler information |
✓ |
|
✓ |
✓ |
|
|
✓ |
✓ |
|
|
✓ |
✓ |
| Automated speed enforcement |
|
|
✓ |
|
✓ |
✓ |
✓ |
✓ |
|
|
✓ |
✓ |
Source: Federal Highway Administration, Guide for Highway Capacity and Operations Analysis of Active Transportation and Demand Management Strategies, FHWA-HOP-13-042 (Washington, DC: June 2013).
Next is a discussion of ATDM strategies that have potential use on arterial streets.
Dynamic Speed Limits
Speed harmonization (or variable/dynamic speed limit control) is an active traffic management strategy that adjusts and coordinates maximum appropriate speed limits on the basis of prevailing traffic conditions, road surface conditions, and weather condition information. Such strategies are used to deal with congestion, incidents, or special events. They maximize traffic throughput by delaying breakdown formation, and by minimizing incident-related hazards (PB Americas, Inc., 2007).
When a facility is operating near capacity, shock waves may appear and propagate because of frequent lane changing-merging maneuvers, or sudden decelerations. The shock wave propagation may eventually produce traffic flow breakdowns with a corresponding increase in travel delay, decreased throughput, and potentially unsafe driving situations. Speed harmonization aims at avoiding shock wave formation, dampening its propagation, and minimizing incident-related hazards by controlling vehicular speeds, and creating a more uniform traffic flow. A successful and efficient implementation of speed harmonization depends highly on the sensor coverage of intelligent transportation systems, selection of efficient enforcement strategies (to increase driver compliance with posted speed limits), implementation of effective control strategies for speed limit selection, and selection of road segments for implementing the corresponding logic (Waller, Ng, Ferguson, Nezamuddin, & Sun, 2009). This strategy can be implemented in conjunction with other strategies, but with some tweaks. It has two key elements: minimum duration between the speed limit change, and upstream location where speed limit is changed. Before implementing the strategy, one must find optimal values for these two elements.
Speed harmonization has been found beneficial in reducing collisions, reducing travel times, increasing facility reliability, and reducing incidents. Its success also depends on driver compliance. Speed harmonization was introduced in European countries (e.g., Netherlands, Germany, UK, Spain, Greece, Finland), and was then adopted by the United States (e.g., Washington, Michigan). In the United States it is used on freeways and in work zones. In the literature, speed harmonization was only found to be deployed on freeways. The consensus of most researchers seems to be that it may not be significantly beneficial without advanced vehicle technologies (Hale, et al., 2016). However when combined with other strategies, or with advanced vehicle technologies, it may improve facility level of service.
Dynamic Lane Use Control
Dynamic lane use involves the dynamic closing or opening of individual traffic lanes, to better align roadway capacities with time-varying traffic demands. Advance warning of the closure(s) (typically through dynamic lane control signs) is needed to safely merge traffic into adjoining lanes. Dynamic lane use has been implemented on arterial roads in Greece. For example, bus-only lanes are operated on weekdays from 6 a.m. to 9 p.m., and on Saturdays from 6 a.m. to 4 p.m. Secondly, Olympic lanes for exclusive use by Olympic athletes, VIPs, accredited media, sponsors, technical officials, public transport buses carrying spectators, and Olympic-accredited vehicles were operated from 6:30 a.m. to midnight during the 17-day Olympic Games (Mirshahi, et al., 2007). In Minneapolis, bus bypass shoulders (BBS) have proven to be both safe and effective. Their criteria to implement BBS are that average speeds must drop below 35 mph during the peak period, or intersection approaches must suffer continuous queues. Other criteria include congestion delays that occur at least once a week, six or more transit buses using the shoulder per week, delay savings greater than 8 minutes per mile per week, and the shoulder must be at least 10 ft wide. To ensure safety, maximum bus speeds are restricted to 35 mph, and buses may not drive more than 15 mph faster than main traffic.
Reversible Center Lanes
Reversible lanes provide a mechanism to better utilize roadway right-of-way when directional asymmetries exist. Under ATDM, the direction of travel could be reversed when certain conditions are realized; because of the potential for collisions when geometric features change unexpectedly, most real-world implementations follow predictable schedules. However, under certain extreme or unusual surge conditions, triggering reversible lane operations in real-time could be an effective strategy. Specific examples of dynamically operated reversible lanes are very limited, and do not cover a wide range of conditions. In Washington, DC, despite some safety issues, it has shown potential of improving the traffic condition (Dey, Ma, & Aden, 2011). Another study conducted in Utah detailed the benefits (Avenue Consultants, 2013). These benefits include increased peak- direction throughput during the peak hours. In the opposite direction, throughput is found to be either increased or remains the same. Simulation studies have been published to integrate reversible lanes on arterial roads (Zhao, Ma, Liu, & Yang, 2014).
Adaptive Traffic Signal Control
This strategy consists of continuous monitoring of arterial traffic conditions, and of queuing at intersections. It also requires dynamic adjustment of signal timings to optimize one or more operational objectives (e.g., minimize overall delays). Congestion and delays may originate from poor traffic signal timings. Signal controls that are responsive to changing traffic can ease traffic congestion, and reduce the associated delays. Benefits of adaptive traffic signal control (ATSC) are as follows (Federal Highway Administration, 2016) (Mladenovic, Stevanovic, Kosonen, & Glavic, 2015):
- Continuously distribute green light time equitably for all traffic movements.
- Improve travel time reliability by progressively moving vehicles through green lights.
- Reduce congestion by creating smoother flow.
- Prolong the effectiveness of traffic signal timing.
- Fast and effective in addressing fluctuating demands, special events, and queue spillback.
- Capability to handle short-term communication, provide priority for Public Transport vehicles.
- Environmentally friendly; can reduce emissions by improving traffic flow.
More than 20 different ATSCs have been developed during the last 30 years. However, only about a dozen of them have been applied in the real world with more than one field implementation (Fehon, 2004). Available adaptive signal control products include:
- Split Cycle Offset Optimization Technique (SCOOT).
- Sydney Coordinated Adaptive Traffic System (SCATS).
- Real Time Hierarchical Optimized Distributed Effective System (RHODES).
- Optimized Policies for Adaptive Control (OPAC).
- FHWA's ACS-Lite.
- InSync.
- LA ATCS.
- SPOT / UTOPIA – Urban Traffic Optimization by Integrated Automation.
- MOTION (Method for the Optimization of Traffic Signals in On-line controlled Networks).
- BALANCE+.
- ATCS (Adaptive Traffic Control System)+.
- ITACA+.
- RTACL+.
- Streetwise (new adaptive module)+.
- QuicTrac+.
Note: + indicates systems known to be operational but not widely used (Fehon, 2004).
National Cooperative Highway Research Program (NCHRP) Synthesis 403 provided surveys of ATSC performance (Stevanovic, 2010). In the surveys, 45 agencies participated including 34 in North America, and 11 in other countries (Table 2). Most interviewed agencies (80 percent) deployed ATCSs in the network with speed limits between 30 and 45 mph. Survey results also showed that 42 percent of agencies deployed ATCSs on arterial networks, 10 percent were deployed on grid networks, and 33 percent were deployed on a combination of the two network types.
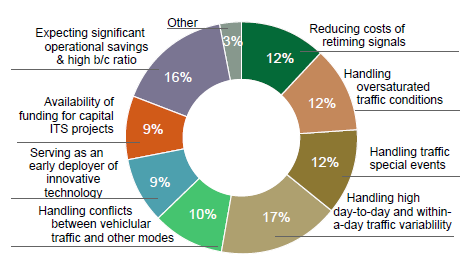 Figure 6. Chart. Pie chart of reasons for implementing adaptive signal systems.
Source: Stevanovic, 2010
Figure 6. Chart. Pie chart of reasons for implementing adaptive signal systems.
Source: Stevanovic, 2010
Figure 6 shows the leading reasons for implementing an ATSC. The figure reveals that ATSC is typically chosen for its capability to handle high day-to-day and within-a-day traffic variability. In the survey, most agencies used SCOOT, SCATS and OPAC. However more recently, InSync, ASC-Lite and LA ATCS received more attention.
The Virginia Department of Transportation (VDOT) conducted a comprehensive review of ATSCs (Fontaine, Ma, & Hu, 2015). VDOT reviewed thirteen (13) ATSC corridors in Virginia, using Bluetooth and INRIX data, for multiple days. The results showed that mainline traffic operations generally improved if (1) the corridor was not oversaturated; (2) the corridor did not have characteristics that encourage platoon dispersion; and (3) the corridor did not already function well. Side street delays generally increased, although net benefits in overall corridor travel time were usually still observed.
Table 2. International survey of adaptive signal deployments.
| Agency |
System |
| U.S. Deployments |
| City of Longview Texas |
ACS Lite |
| W.E. Stilson Consulting Group, LLC, Columbus, Ohio |
ACS Lite |
| City of Little Rock, Arkansas |
InSync |
| California Department of Transportation-District 7, California |
LA ATCS |
| Culver City, California |
LA ATCS |
| Los Angeles Department of Transportation, California |
LA ATCS |
| City of Chesapeake, Virginia |
OPAC |
| Town of Cary, North Carolina |
OPAC |
| Virginia Department of Transportation, Virginia |
OPAC |
| Pinellas County, Florida |
OPAC, RHODES |
| City of Tucson, Arizona |
RHODES |
| Washington State Department of Transportation, Washington |
RHODES |
| City of Chula Vista, California |
SCATS |
| City of Gresham, Oregon |
SCATS |
| Cit of Menlo Park, California |
SCATS |
| City of Santa Rosa, California |
SCATS |
| City of Sunnyvale, California |
SCATS |
| Cobb County, Georgia |
SCATS |
| Delaware Department of Transportation, Delaware |
SCATS |
| Florida DOT District 4, Florida |
SCATS |
| Minnesota Department of Transportation, Minnesota |
SCATS |
| Pasco County, Florida |
SCATS |
| Road Commission for Oakland County, Michigan |
SCATS |
| Utah Department of Transportation, Utah |
SCATS |
| City of Anaheim, California |
SCOOT |
| City of Ann Arbor, Michigan |
SCOOT |
| Collier County, Florida |
SCOOT |
| Orange County, Florida |
SCOOT |
| Reedy Creek Improvement District, Florida |
SCOOT |
| Short Elliot Hendrickson Inc., Minnesota |
SCOOT |
| International Deployments |
| Econolite Canada Inc., Canada |
RHODES |
| Dublin City Council, Ireland |
SCATS |
| New Zealand Transport Agency, Auckland, New Zealand |
SCATS |
| Roads & Transit Authority, New South Wales, Sydney, Australia |
SCATS |
| Unidad Operativa de Control de Tránsito, Concepcion, Chile |
SCATS |
| VicRoads, Victoria, Australia |
SCATS |
| City of Blackpool Council, United Kingdom |
SCOOT |
| City of Red Deer, Canada |
SCOOT |
| City of Southhampton, United Kingdom |
SCOOT |
| City of Toronoto |
SCOOT |
| Derby City Council, United Kingdom |
SCOOT |
| Greater Manchester Urban Traffic Control Unit |
SCOOTS |
| Halifax Regional Municipality |
SCOOTS |
| Hampshire County Council, United Kingdom |
SCOOTS |
| IMoTS Siemans Ltd, Beijing, China |
SCOOTS |
Dynamic Lane Grouping
Dynamic lane grouping (DLG) involves the dynamic changing of allowable turning movements in each lane; also known as lane assignments, or lane channelization (Su, Jiang, Jagannathan, & Hale, 2015). For example, consider an intersection approach with three through lanes and one left- turn lane. When the intersection experiences heavy left-turn demands with relatively low through demand, dynamically converting a through lane into a left-turn lane would better align capacity supply and traffic demand across all lanes, leading to an overall reduction in delay. Indeed, multiple studies found that volume demands at intersections vary greatly across weekdays (Levinson, Sullivan, & Bryson, 2006), having significant operational effects (Hellinga & Abdy, 2007), similar to those caused site-to-site variation (Tarko & Perez-Cartagena, 2005). This allows a better alignment of roadway capacities with time-varying traffic demands. Figure 7 and Figure 8 illustrate an example of left-turn congestion before DLG, and improved left-turn flow after DLG.
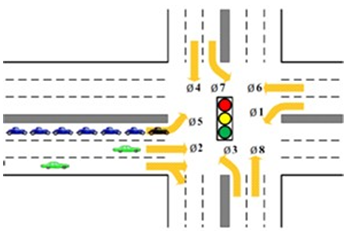 Figure 7. Image. Left-turn congestion prior to dynamic lane grouping.
Source: Su, Jiang, Jagannathan, & Hale, 2015
Figure 7. Image. Left-turn congestion prior to dynamic lane grouping.
Source: Su, Jiang, Jagannathan, & Hale, 2015
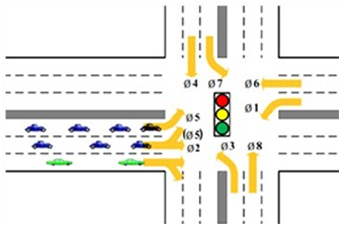 Figure 8. Image. Improved left-turn flow after dynamic lane grouping.
Source: Su, Jiang, Jagannathan, & Hale, 2015
Figure 8. Image. Improved left-turn flow after dynamic lane grouping.
Source: Su, Jiang, Jagannathan, & Hale, 2015
Queue Warning
This ATDM strategy involves real-time display of warning messages along a roadway; typically on dynamic message signs, and possibly coupled with flashing lights. It alerts motorists that queues or significant slowdowns are ahead; thus reducing rear-end crashes, and improving safety.
Transit Signal Priority
Transit signal priority (TSP) is an ATDM strategy involving the management of traffic signals to detect when a bus is approaching an intersection. Sensors and/or probe vehicle technology can be used to turn the signals green sooner, or to extend the green phase, thereby allowing a bus to pass through more quickly.
ESTABLISHMENT OF PROJECT SCOPE
As stated at the beginning of the chapter, Task 2 of the project involved a literature review and state-of-practice review of relevant HCM methodologies, to determine if they were applicable to this work effort. Given the team's prior knowledge of HCM methodologies, it became necessary to first define the scope of the work effort, in terms of the most appropriate ATDM strategies for HCM implementation. To define the scope of the work effort, the research team conducted a review of prior HCM-based ATDM research on freeways, plus a review of urban street ATDM strategies.
Results of this review were repeated earlier in this chapter. Concurrent with this review, the research team and peer review group were asked to choose top-priority ATDM strategies for HCM implementation from the following list:
- Variable Speed Limits.
- Dynamic Turn Restriction.
- Dynamic Lane Closure.
- Dynamic Lane Grouping.
- Congestion Pricing.
- Queue Warning.
- Reversible Center Lanes.
- Dynamic Speed Control.
- Adaptive Signal Control.
- Dynamic Route Guidance.
- Dynamic Parking.
- Transit Signal Priority.
Because the prior research team for HCM-based freeway ATDM had chosen three strategies for their study, and due to resource constraints in the urban street ATDM project, it was decided that a maximum of three strategies could be chosen. The following micro-decisions were also made:
- Adaptive Signal Control quickly became a top priority due to its pre-existing popularity on
U.S. arterials, although many expressed concerns about the large number of products and algorithms.
- Some strategies (e.g., Dynamic Route Guidance, Congestion Pricing) were deemed difficult to integrate into the HCM urban streets framework, due to their network-wide dynamic modeling requirements.
- Due to the operational emphasis of the HCM, safety-based strategies (e.g., Queue Warning) were not suitable.
- Some strategies (e.g., Dynamic Parking, Dynamic Turn Restriction, Dynamic Lane Closure, Variable Speed Limits) were assigned low priorities due to a lack of popularity on arterials, and/or lack of available relevant data on arterials.
- Dynamic Lane Grouping and Reversible Center Lanes were considered top candidates due to their existing and successful U.S. implementations, despite the lack of before-and-after data.
Based on stakeholder feedback, the team's knowledge of HCM methods, the review of HCM-based freeway ATDM research, and the review of urban street ATDM strategies, the research scope was narrowed to three specific ATDM strategies: adaptive signal control, reversible center lanes, and dynamic lane grouping. The research team believes there would be significant national interest in developing the ability to analyze impacts of these strategies in an HCM context, and without requiring micro-simulation. Furthermore, these strategies could be classified as ATM strategies as opposed to ATDM strategies, because they aim to move traffic more efficiently and without demand management. It is this focus that perhaps led to their current popularity in the United States, and their potential suitability for HCM implementation.
Beyond the selection of three strategies, the project scope involving was further refined during the Original Research phase of the project. This additional project scope refinement will be discussed in the subsequent chapters.
CONCLUSIONS AND NEXT STEPS
The objective of this task (Task 2) was to identify HCM methodologies applicable to this work effort. At the conclusion of Task 2, it was believed that the three chosen urban street ATM strategies could be effectively modeled via capacity adjustment factors, similar to what was accomplished during the freeway ATDM project. However, it was later discovered (during Task 6 – Original Research) that the capacity adjustment paradigm would be unsuitable for arterials, and that the HCM reliability framework would offer a preferable solution. Specifically, the alternative lane use configurations could be modeled as special event datasets within the HCM reliability framework, along with re-optimized timing plans for the new lane uses. The inadequacy of the capacity adjustment paradigm will be discussed more thoroughly in an upcoming chapter.
Regarding the adaptive signal control strategy, the HCM reliability framework would not accurately capture these effects or impacts. As such, this report will present potential benefits of adaptive signals under various conditions, both from field data and from simulations, but will not suggest a new HCM method for adaptive signal analysis. Conversely, for reversible center lanes and dynamic lane grouping, this report will provide not just potential benefits under various conditions, but will also demonstrate analysis of these strategies via the HCM reliability framework.
The peer review group identified the ARTPLAN software tool, developed by the Florida Department of Transportation (FDOT) and described in FDOT's Q/LOS Handbook (Florida Department of Transportation, 2013), as a relevant existing HCM methodology for analyzing reversible center lane operations. A relevant testimonial paragraph from the Handbook is shown below.
Conceptual planning is best suited for obtaining a more precise determination of the LOS of a facility. Examples of conceptual planning applications are determining the design concept and scope for a facility (e.g., four through lanes with a raised median and bicycle lane), conducting alternatives analyses (e.g., four through lanes undivided versus two through lanes with a two-way left turn lane), and determining needs when a generalized planning approach provides insufficient detail. Florida's LOS planning software (LOSPLAN), which includes ARTPLAN, FREEPLAN, and HIGHPLAN, is the easy to use tool for conducting these types of evaluations.