Making the Business Case for Traffic Incident Management
Chapter 3. Evaluate and Select
The Develop Vision phase establishes the case and context for change. The Evaluate and Select phase identifies and provides credence to the direction by which change is to be achieved. The evaluation determines which alternative offers the best value to the agency and to its stakeholders, within acceptable cost and risk. This phase typically requires the most resources and technical expertise. It begins with the development of evaluation criteria, in consultation with stakeholders, considering the five traditional goals of mobility, safety, efficiency, environment, and traveler satisfaction. It concludes with the recommendation of one alternative and well-formulated program plans with requirements, cost, schedule, performance, and benefit parameters for monitoring program execution.
Figure 4. Chart. Evaluate and select section of traffic incident management business case development process.
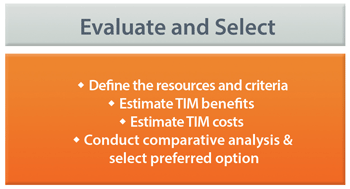
(Source: AEM Corporation.)
The output of the Evaluate and Select phase of the business case development process is a clear summary of findings and their alignment with business goals. The evaluation and selection should:
- Define the basis and criteria by which to evaluate option(s) - The basis for analysis of alternatives defines a common framework for comparison. The criteria for comparison of options may include cost, schedule, and expertise constraints. Conversely, the criteria may provide added weight to certain considerations. For example, if the legislative and agency focus is on mobility, then alternatives with a more significant mobility benefit may be higher valued compared to an alternative that provides greater agency efficiency. Instruction to establish a common basis and criteria is presented later in this chapter.
- Estimate traffic incident management (TIM) benefits for option(s) - The Guidance of Quantifying the Benefits of TIM lists five steps for a successful TIM benefits analysis and notes that "these steps, while ordered, may be recursive:
- Define geographic and temporal scope.
- Identify available data by type, cleanliness, and levels of aggregation.
- Define analysis methods and tools based on former assessments, ensuring consistency.
- Define a schedule allocating levels of effort to key activities.
- Prepare an evaluation plan that summarizes 1-4, and implement. (V. Shah et al., "NCHRP 03-108: Guidance on Quantifying Benefits of TIM Strategies," Transportation Research Board, Washington, DC, 2016 (working document).)
- In the translation of these steps within the business case framework, defining geographic and temporal scope may either be conducted as a part of this phase or the vision phase. Steps 2-5 in this list define the activities to conduct the analysis.
- Estimate TIM costs for option(s) - Cost estimation is typically agency specific. Common cost delineation includes two areas: capital investment (costs associated with purchasing equipment and new facilities) and operations costs, often referred to as O&M (operations and maintenance). In considering alternatives, the cost for implementation (including but not limited to training, integration, and testing) should also be estimated and included. Cost estimates for alternatives should be presented for the same constant base year.
- Conduct comparative analysis and select preferred option - Within benefits and cost estimation a number of uncertainties exist. A risk assessment identifies uncertainties, addresses the degrees of the risks, and identifies mitigation strategies. Estimates of benefit and cost should be adjusted to account for risk. The potential facets of risk are presented later in this chapter along with how best to summarize findings of benefits and cost analyses.
Define Basis Options Analysis and Evaluation Criteria
The Evaluate and Select phase of the business case development process starts with understanding the basis and criteria by which to evaluate options. Key considerations to ensure that the alternatives use a common basis for comparison include:
- Lifecycle or single year evaluation - A key question to consider when embarking on the evaluation is whether the benefits and cost analyses will focus on the lifecycle of the investment, or only on the costs and benefits of a single operating year. If the investment is for one-time costs, such as the acquisition of a vehicle fleet or a closed-circuit television (CCTV) system, the lifecycle estimate of cost and benefit is more appropriate. Conversely, if the investment is for TIM annual operating expenses, for example the annual costs of a freeway service patrol (FSP) program (e.g. maintaining the vehicle fleet, operator salaries, fuel costs), the single year analysis of benefit-cost is sufficient.
- Common year data - To the extent possible, be sure that analyses of alternatives use common periods for analysis with common operations data. Be sure to reconcile benefits and cost estimates to a common net present value (NPV) if alternatives have differing implementation timelines with benefit accrual in different years.
- Use agency-prescribed parameters - When estimating the benefits or costs for alternatives, be sure to adhere to agency-prescribed parameters. These include:
- The cost of fuel applied to estimate fuel savings from reduction in delay. This may include the base year and future fuel cost projections.
- The average cost for specific types of incidents with regard to property or personal injury.
- The passenger and commercial vehicle value of time.
- Other parameters defined by the agency or the state may include demand projections and discount rates. The discount rate estimates future costs, because a dollar today has more value than a dollar in the future. When agency-prescribed parameters are not defined, defer to parameters set by the U.S. Department of Transportation (USDOT) or another Federal agency, such as the Office of Management and Budget (OMB) (discount rate guidance).
Beyond a common basis for analysis, evaluation criteria are needed to compare investment options. Evaluation criteria should be strategically and contextually relevant and defined by the organization in collaboration with relevant stakeholders and senior management. These criteria, along with the benefit-cost ratio (BCR), should be used to select the preferred alternative. The criteria development may be a multi-level process or completed in a single step, may be quantitative (e.g., potential to reduce incident duration by five minutes) or qualitative (e.g., high, medium, or low alignment with stakeholder need), and should include the following:
- Screening evaluation criteria - When considering a large set of options, first use screening evaluation criteria to eliminate options that are "deal breakers" - that is, options that do not adequately address specific achievability or affordability criteria or are not aligned with the strategic fit and business need. Strategic alignment of each option addresses how the objectives of the investment contribute to the directions and priorities identified in an organization's mission, vision, goals, and short-term and long-range plans. For example, the Arizona Department of Transportation (ADOT) Strategic Plan outlines five strategic focus areas, as seen in Figure 5. Two of the strategic focus areas include "financial resources" and "innovation," with key points focusing on "maximizing existing agency financial resources" and "identifying savings and efficiencies," respectively. If these points reflect a constrained funding environment, proposed investment alternatives that require large costs may be "deal breakers."
- Essential evaluation criteria - Essential evaluation criteria outline the minimum requirements of the proposed project/program with regard to costs (e.g., maximum cost), implementation (e.g., timeline, systems interoperability), risk, standards (e.g., communications/data standards), and data (e.g., ownership, sharing, security). Essential evaluation criteria should also include expected changes in performance and levels of efficiency as a result of the proposed investment. For TIM, expected changes in performance could relate to the incident timeline (i.e., reduced incident response and clearance times) and response efficiency (e.g., getting just the right resources to the incident).
Figure 5. Chart. Arizona Department of Transportation strategic focus areas.
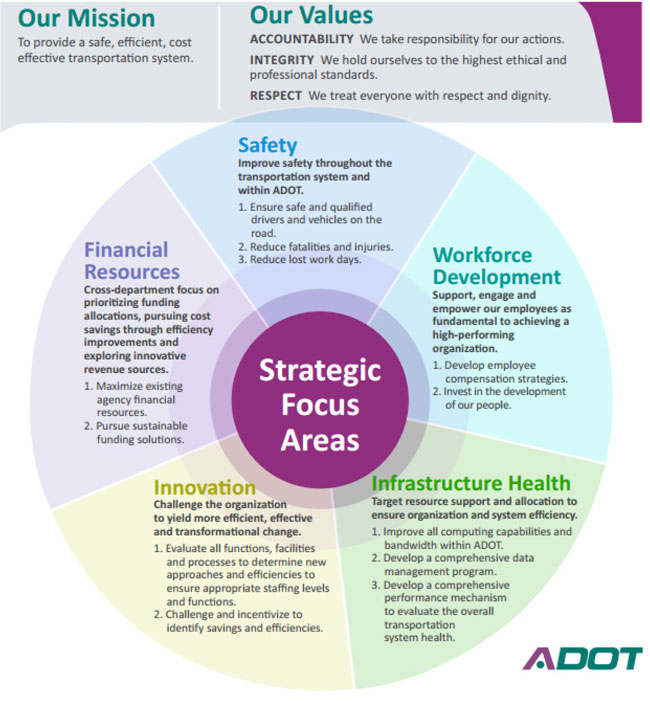
(Source: Arizona Department of Transportation.)
Estimate Traffic Incident Management Benefits
Traffic Incident Management (TIM) benefits can be categorized as mobility, safety, efficiency, environment, and traveler satisfaction benefits.
TIM benefits are realized by the transportation organization (e.g., department of transportation [DOT] and metropolitan planning organization [MPO]), partner organizations (e.g., state police, emergency medical services [EMS], fire and rescue, tow operators), user communities (e.g., freight and personal vehicle users, transit users, media outlets), and the public at large. Accordingly, when estimating the benefits associated with TIM investments, a wide perspective of stakeholders should be captured through quantitative, qualitative, or monetized benefits. Quantitative TIM benefits are derived from activities that promote quicker restoration of roadway capacity, more efficient deployment of resources in the response to incidents, and diversion of demand away from incidents. The benefits from these activities can be categorized as mobility, safety, efficiency, environment, and traveler satisfaction benefits.
In the following sections, data considerations for estimating benefits, tools, and techniques for quantifying benefits are highlighted. The methods and tools used to estimate TIM benefits should be in agreement with the scope of the proposed investment and the availability of data. The accuracy of any benefits estimates depends on the quality of the data and the proper use of statistical techniques to analyze the data.
The accuracy of any benefits estimates depends on the quality of the data and the proper use of statistical techniques to analyze the data.
For alternatives that are yet to be implemented, estimates of the expected performance are derived either from comparable local experience or from comparable national performance. In some cases, an agency may cite past performance as the basis for a proposed expansion alternative. When the Maryland Coordinated Highways Action Response Team (CHART) program proposed geographic and temporal expansion of its TIM Emergency Patrol program, the proposed operational budget enhancement cited past Emergency Patrol performance along with measured increases in vehicle miles traveled (VMT). (CHART, "CHART Statewide Traffic Incident Management Patrol Expansion, Proposed Operations Budget Enhancement," 2009.) In the case of alternatives that focus on maintaining an existing investment, estimates of performance in the absence of alternatives may be derived from comparable parts of the network without TIM or from performance data prior to the implementation of TIM.
Data Needs
Data are essential to making the business case for TIM. Without the data to demonstrate the value of their activities, TIM programs will struggle to maintain long-term, sustainable support and funding. A survey of State DOTs and MPOs in 2011 asked what kind of information or data would be helpful for them in "making the case" for TIM within their own agency. The general responses can be summarized as follows: (FHWA, "Analysis, Modeling, and Simulation for Traffic Incident Management Applications," U.S. Department of Transportation, Publication FHWA-HOP-12-045, 2012.)
- Reliable system-wide speed data.
- Documented information/quantitative data related to the effects (e.g., decreased delay and congestion, improved safety) of TIM programs, including service patrols and traveler information.
- Benefit/cost data.
- Cost of secondary crashes.
- Incident clearance and closure time data that can be integrated with control systems.
National Traffic Incident Management (TIM) Performance Measures
- Roadway clearance time.
- Incident clearance time.
- Secondary crashes.
As part of National Cooperative Highway Research Program (NCHRP) Project 07-20: Guidance for Implementation of Traffic Incident Management Performance Measurement, a common database schema and data dictionary were developed to help guide agencies in collecting the required and desired data elements for consistent reporting of TIM performance. The data model contains 40 data elements organized in eight different categories, including: incident timeline, details of incident, conditions at time of incident, roadway details, lanes involved, participants involved, and emergency responders and vehicles involved. The report and supporting documents are available for view and download on the Traffic Incident Management Performance Measurement (TIM PM) Web site. (K. Pecheux and R. Brydia, "Guidance for the Implementation of Traffic Incident Management Performance Measurement," National Cooperative Highway Research Program (NCHRP) Project 07-20, Transportation Research Board, National Academies, 2014.) To assist agencies in determining what TIM data elements are available to them and from what sources, a comprehensive checklist of data elements by data source is provided in Appendix B of this document. This checklist is consistent with the NCHRP 07-20 database schema and data dictionary. (FHWA, "Process for Establishing, Implementing, and Institutionalizing a TIM Performance Measures Program," U.S. Department of Transportation, Publication FHWA-HOP-15-028, 2016 (anticipated).)
While the only data elements required in the database schema are those needed to calculate the three national TIM performance measures, the more incident data elements available to a TIM program, the more the program can do in terms of understanding its performance and demonstrating the value of the program to others. Furthermore, these additional data elements, such as number and duration of lanes blocked, can also support the quantification of TIM benefits, including determining incident-induced congestion and queue lengths.
Data for TIM performance measurement and analysis generally come from advanced traffic management systems (ATMs), FSP programs, and law enforcement via the state crash report. Crowdsourced data providers such as Waze, INRIX®, and others can offer data that serves to notify agencies of incidents, often in advance of other reporting systems. These private data providers also offer data to accurately measure the duration and severity of delays associated with incidents. Integrated systems, statewide systems and databases (e.g., ATMS) to collect the specific data elements needed for TIM performance measurement greatly improve the quantity and quality of data available to agencies for analyses.
Traffic Incident Management Performance Measures
Other Traffic Incident Management (TIM) Performance Measures
- Incident detection time.
- Incident verification time.
- Incident response time.
- Time to return to normal flow of traffic.
- Incident related delay.
- Incident related queue length.
- Number of fatalities.
- Public feedback.
Measuring the performance of TIM activities is the first step in quantifying benefits and making the business case for a TIM program. If a TIM program does not measure and track its own performance, those who wish for it to continue will struggle to make the case for the program both internally within the agency and also externally to decisionmakers. Performance measures defined explicitly for TIM should reflect broader agency-wide or statewide goals related to increased productivity, cost-efficiency, and improved quality in the delivery of services. (TransSafe Consulting, LLC and Sam Schwartz Engineering, DPC, "Traffic Incident Management in Seattle: Observations and Recommendations," Seattle DOT and Seattle Police Department, Seattle, WA, 2015.)
From a national perspective, the Federal Highway Administration (FHWA), with the input of 11 States through a Focus States Initiative, developed three national TIM performance measures: roadway clearance time (RCT), incident clearance time (ICT), and secondary crashes. (FHWA, "Federal Highway Administration Focus States Initiative: Traffic Incident Management Performance Measures Final Report," U.S. Department of Transportation, Publication FHWA-HOP-10-010, 2009.) Beyond these national TIM performance measures, a number of other time-based performance measures include: incident detection time, incident verification time, incident response time, and the time to return to normal flow of traffic. Beyond the time-based performance measures, agencies use a wide variety of other measures to show performance and demonstrate value. Some of the most common performance measures include the following: average assist times, incident-related delays, speeds, queue lengths, fatalities, and public feedback.
TIM agencies have found that tracking and reporting improvements in average clearance times is a powerful tool to communicate and inform their state legislatures and their customers. Some examples of ways that agencies have used TIM performance measures to improve perception and increase support of the program include:
- The Washington State Department of Transportation's (WSDOT) quarterly Gray Notebook and annual Corridor Capacity Report provide data about its performance in several areas, including TIM. These publications are the primary tools used to report performance and demonstrate accountability. The data have been used to justify the increased expansion of the Incident Response (IR) program to the legislature. Since the IR program began in 1999, the program has been expanded three times and those decisions have been based on the data. (FHWA, "Process for Establishing, Implementing, and Institutionalizing a TIM Performance Measures Program," U.S. Department of Transportation, Publication FHWA-HOP-15-028, 2016 (anticipated).) Appendix C provides an example from the 2015 Corridor Capacity Report.
- The Minnesota Department of Transportation (MnDOT) has found that having performance data is important to the continued financial support of its Freeway Incident Response Safety Team (FIRST) program.
- The Virginia Department of Transportation (VDOT) uses TIM performance information for a wide range of strategic and tactical decisions. The data have been beneficial when used during presentations to decisionmakers. The availability of hard data allows for faster buy-in when trying to build consensus and establish policies.
- One of the benefits the Wisconsin Department of Transportation (WisDOT) has realized from having TIM performance data is that it has helped them communicate both within the transportation management center (TMC) and as a bureau. The administration in Wisconsin is supportive of TIM efforts, and it has helped the Highways Division examine the TIM program and establish a new position within the department for TIM. (FHWA, "Process for Establishing, Implementing, and Institutionalizing a TIM Performance Measures Program," U.S. Department of Transportation, Publication FHWA-HOP-15-028, 2016 (anticipated).)
- The Arizona Department of Public Service (AZDPS) used performance measures before and after a major policy revision that required police officers to move vehicles completely off the roadway (away from view) during incidents to determine if the policy influenced TIM performance. Table 1 compares the average RCT and ICT by injury severity for crashes that occurred prior to the policy change and four years later after the policy change. The significant decreases in average clearance times after the implementation of the policy for the non-injury and injury incidents suggested that the change was effective. The policy change did not have a positive effect on the severe and fatal crashes. (FHWA, "Process for Establishing, Implementing, and Institutionalizing a TIM Performance Measures Program," U.S. Department of Transportation, Publication FHWA-HOP-15-028, 2016 (anticipated).)
Table 1. Arizona Department of Public Safety Metropolitan Phoenix traffic incident management performance between October-December 2010 and October-December 2014.
| Injury Category |
Performance Measure |
Oct-Dec 2010 Performance |
Oct-Dec 2014 Performance |
Percent Change |
| Non-injury |
RCT |
45 |
9 |
-80% |
| Non-injury |
ICT |
84 |
34 |
-60% |
| Injury |
RCT |
54 |
23 |
-54% |
| Injury |
ICT |
94 |
54 |
-43% |
| Fatal |
RCT |
212 |
267 |
+26% |
| Fatal |
ICT |
214 |
282 |
+32% |
Source: Arizona Department of Public Safety.
While the benefits from TIM are significant and clear to many, quantification and monetization of the benefits of TIM activities involve more complex analyses and require data on TIM performance, traffic operations, and enterprise-level programmatic performance and resource data. Furthermore, data on TIM costs are required for benefit-cost analyses. TIM costs include recurring operating costs along with capital investment costs. While capital investment costs associated with incident response are usually clear, the tracking of other capital and maintenance costs for a TIM program is often complex, because resources are shared among TIM and other programs and/or agencies.
Quantify the Benefits of Traffic Incident Management
Quantifying the measured or estimated benefits of TIM is an important aspect of making the business case for TIM programs and strategies. Depending on the scope of the proposed investment, incident response statistics (e.g., number of FSP assists per quarter) and TIM performance measures (e.g., reduction in ICT) may be sufficient; however, in other cases, the expected benefits of the investment may need to be quantified (e.g., will reduce delay by five percent) or monetized (e.g., will result in two million dollars savings to the agency and/or travelers) or both.
Key TIM program benefits from the transportation perspective can be categorized within the categories of mobility, safety, efficiency, environment, and traveler satisfaction. Some methods for quantifying these outcomes are shared below. These methods leverage various types and fidelity of data. For existing TIM programs, the performance under the "no-TIM" option can be approximated using data for a comparable or adjacent region without TIM or from historic data prior to TIM implementation. For newly proposed TIM programs, projects, or expansions, estimates of the effect of implementation can be approximated using benchmark data from the literature and current demand and incident data.
Mobility Benefits of Traffic Incident Management
Mobility benefits of TIM programs include less travel delay and better travel time reliability. Reduced motorist delay is the most frequently cited mobility benefit associated with TIM. During incidents, roadway capacity is reduced, which results in queuing of traffic. By removing incidents more quickly, capacity can be reinstated, mitigating motorist delay.
Three primary approaches are used to derive estimates of the delay reduction associated with TIM programs/strategies:
- Empirical analyses - Empirical analyses of detailed incident and traffic flow data, including speed and volume, are data intensive but relatively straightforward.
- Simulation models - Simulation models can be used to estimate delay and reduction in delay for a shorter incident. This approach is far more complex but provides the analyst with the opportunity to model numerous scenarios that reflect different incident durations, locations, and severity. Analyses based on simulation include the following:
- Hoosier Helper Program - applied CORSIMTM to estimate delay. (A. Guin, C. Porter and C. Holmes, "Benefits Analysis for Incident Management Program Integrated with ITS Operations: Case Study," Transportation Research Record No. 2000, pp. 78-87., Washington, DC, 2007.)
- Georgia NaviGAtor System - applied CORSIMTM to estimate delay.
- New Jersey Variable Message System - applied Rutgers Incident Management System (RIMS) cell transmission simulation to estimate delay.
- Maricopa County Department of Transportation's Regional Emergency Action Coordination Team (REACT) - applied CORSIMTM to estimate delay.
- Capacity reduction functions - The application of capacity reduction functions with incident duration and queuing theory requires far less data than the first two options but is also less precise.
- The Northern Virginia Freeway Service Patrol Evaluation (FSPE) model used capacity reduction factors in conjunction with the geometric and traffic characteristics of an FSP route, the frequency and type of assisted incidents on the route, and a deterministic queuing model to estimate delays.
- North Carolina's Incident Management Assistance Patrols (IMAP) decision support tool for service expansion applied FREEVAL, which replicates freeway delay estimation from the Highway Capacity Manual.
The ideal data to comprehensively estimate the delay reduction from TIM would include the following incident-specific data:
- Time-dependent traffic volume and speed prior to, during, and subsequent to the incident both upstream and downstream of the incident.
- Freeway capacity at the incident location.
- Number and duration of lanes blocked.
- Vehicle occupancy and the percentage of trucks in traffic.
With comprehensive incident-localized data, an empirical assessment can calculate the delay as measured in vehicle-hours. Typically, operations data will be segment-specific rather than incident-specific. More likely, segment-level traffic volume and capacity averages by morning peak, evening peak, off-peak, weekday, and weekends are applied to estimate delay. A loop detector system is the typical means for the collection of traffic speed and volume data. The processing and cleaning of these data are non-trivial, and care should be given to ensure data accuracy. For example, loop detector data processing can remove entries where speeds are zero. This rule is in place to exclude erroneous data; however, it may indeed exclude data related to incidents.
Analysis, Modeling, and Simulation for Traffic Incident Management Applications is a good reference for
understanding the range of methodologies for estimating the mobility impacts of incidents.
A 2012 FHWA publication titled, Analysis, Modeling, and Simulation for Traffic Incident Management Applications, presents the state-of-the-practice and state-of-the-art for estimating the effect of incidents on congestion, lists various simulation and mathematical techniques and specific software that can be applied to TIM, and discusses the challenges and limitations associated with the various techniques. (FHWA, "Analysis, Modeling, and Simulation for Traffic Incident Management Applications," U.S. Department of Transportation, Publication FHWA-HOP-12-045, 2012.)
A number of tools can be applied to estimate the reduction in delay from a reduction in incident duration, most notably the new FHWA TIM Benefit-Cost (TIM-BC) Tool, which estimates delay savings based on a regression model derived from simulation. (FHWA, "User's Manual for The Traffic Incident Management Benefit-Cost (TIM-BC) Tool (Version: 2.0)," Federal Highway Administration Research and Technology, September 2015. [Online].) FREEVAL-RL also supports reliability-focused analysis. (S. Sajjadi, S. Aghdashi, N. Rouphail, A. Hajbabaie and B. Schroeder, "FREEVAL-RL User Guide," Institute for Transportation Research and Education of North Carolina State University, Raleigh, NC, 2013.)
Safety Benefits of Traffic Incident Management
The safety benefits of TIM programs include fewer secondary crashes, fewer secondary crashes involving responders, and less risk exposure for responders. One of the three national TIM performance measures is secondary crashes. The reduction of secondary crashes also generates additional mobility benefits as well as the costs associated with the crashes. Secondary crashes can be measured/estimated through five methods:
- Assumed percentage of total incidents (e.g., 20 percent of all incidents are secondary in nature) - This approach is simple, but it is also the coarsest.
- Analysis of historical data using temporal and spatial parameters - The use of historical data to determine the number/percentage of secondary crashes through temporal and spatial parameters will provide a better estimate; however, if the temporal and spatial parameters are unnecessarily lax or constrained, the resulting estimates will be high or low, respectively.
- Regression-based filtering methods - The regression-based filtering method for estimating secondary crashes can account for characteristics such as the level of congestion and severity associated with incidents to more accurately estimate the percentage of incidents that are secondary.
- Responder reporting - Responder reporting requires significantly less effort but potentially at the expense of consistent reporting.
- Video monitoring and detection - Video detection requires the greatest level of effort but can ensure consistent measurement protocols. Video monitoring and detection, along with responder reporting, is the most accurate.
In the past, it was not common to measure the reduction of secondary crashes from TIM. The number or likelihood of secondary crashes has generally either been estimated as an overall percentage of total incidents or simply computed as a percentage of incident duration. (A. Guin et al., "Benefits Analysis for the Georgia Department of Transportation NaviGAtor Program: Final Report," Prepared by URS Corporation for the Georgia DOT, 2006; and G. L. Chang and S. Rochon, "Performance Evaluation of CHART - Coordinated Highways Action Response Team - Year 2002," University of Maryland, College Park and Maryland State Highway Administration, 2003.) More agencies, however, are beginning to collect data on secondary crashes, including many law enforcement agencies such as Arizona, Florida, and Tennessee.
AZDPS has been particularly active in the collection and analysis of both secondary crashes and, even more specifically, secondary crashes involving a law enforcement officer. Figures 6 and 7 compare the percentage of secondary crashes in Arizona (as collected by AZDPS troopers) during a three-year period from 2011 to 2013. The graph on the left shows the overall percentage of crashes that were secondary to a crash and secondary to an incident. In both cases, the occurrence of secondary crashes held steady over the three years. The graph on the right shows the percentage of secondary crashes involving a first responder and whether they were secondary to a crash or to an incident. This graph shows a reduction in secondary crashes involving a first responder over the three years (note the differences in the y-axis for the two graphs). Arizona attributes this reduction to an increase in training and awareness of its law enforcement officers regarding the importance of clearing crashes quickly. (J. King, "Traffic Incident Management (TIM) Performance Measures Webinar," in TIM Performance Measurements, USDOT T3 Webinar Series, June 12, 2014.)
Figure 6. Chart. Comparison of secondary crashes involving a first responder in Arizona from 2011-2013.
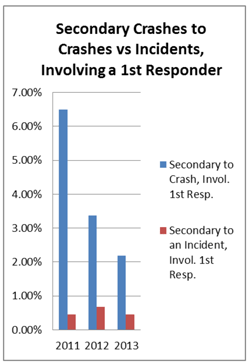
(Source: Arizona Department of Public Safety.)
Figure 7. Chart. Comparison of secondary crashes involving nonresponders in Arizona from 2011-2013.
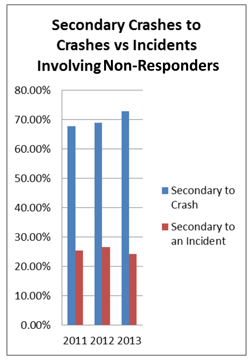
(Source: Arizona Department of Public Safety.)
ADOT is conducting a study on reducing secondary crashes. (T. Lane, "Reducing Secondary Crashes," in FHWA TIM Performance Measures Workshop, Las Vegas, NV, June 24, 2015.) The objectives of the study are to:
- Use data to determine the impact of lane and incident clearance on secondary crashes.
- Assess the potential for reducing secondary crashes and calculate the costs of secondary crashes.
- Quantify the benefits of reducing secondary crashes.
- Identify enhanced TIM strategies.
The findings of this study will be beneficial to all members of the technical advisory committee in Arizona, including ADOT, AZDPS, FHWA, fire, EMS, towing, and law enforcement. The findings should also be beneficial to other agencies in making the business case for TIM strategies, particularly related to the safety benefits associated with TIM.
Efficiency Benefits of Traffic Incident Management
The estimation of the reduction in personnel and equipment costs for more efficient response requires raw counts for equipment as well as personnel details applied to incidents. For example, a study in Maricopa County, Arizona in 2002, through the creation of the REACT Evaluation, highlighted a reduction in police and fire personnel responding to long-duration incidents on arterials by 20 to 40 hours per week. (Battelle Memorial Institute, "Regional Emergency Action Coordination Team (REACT) Evaluation," Prepared for Maricopa County Department of Transportation, 2002.) In addition, the Oregon Department of Transportation (ODOT) Region 3, District 8 Dedicated Incident Response Pilot Project demonstrated that the availability of one dedicated incident responder - instead of maintenance - to handle incident response could improve the efficiencies in scheduling and conducting maintenance activities. (J. Griffin, Interviewee, TIM Business Case Interview - ODOT. [Interview]. 4 February 2016.)
Environmental Benefits of Traffic Incident Management
The environmental benefits of TIM include less fuel consumption and emissions. Fuel consumption estimation requires measures of delay or speed along with vehicle composition. A number of tools can be used to estimate fuel consumption, including:
- Simulation and modeling based software, such as CORSIM, VisSim, PARAMICS, MOBILE6 Vehicle Emission Modeling Software, Motor Vehicle Emission Simulator (MOVES), and Intelligent Transportation Systems (ITS) Deployment Analysis System (IDAS).
- The FSPE model, developed by the University of California, Berkeley. (For more information on the FSPE Model and how to obtain it, please contact: Mr. Alexander Skabardonis, Professor & Research Engineer, Department of Civil & Environmental Engineering, Institute of Transportation Studies, University of California, 109 McLaughlin Hall, Berkeley CA 94720-1720, Phone: 510-642-9166.)
- The use of functions relating delay savings by vehicle type to estimate fuel consumption based on average vehicle fuel efficiency rates (a simpler and coarser method).
Many of the same tools applied for fuel consumption also produce emissions impacts. (K. Ahn, "Microscopic Fuel Consumption and Emission Modeling," Virginia Polytechnic Institute and State University, Blacksburg, VA, 1998.) In addition:
- Typically, emissions estimates are developed purely as a function of delay.
- The FHWA TIM-BC Tool provides environmental benefits specific to hydrocarbons, carbon oxides, and nitrous oxides.
- Regression models based on CHART data and simulation analyses enable estimation of emissions as a function of hours of delay reduction from TIM. (G. L. Chang and S. Rochon, "Performance Evaluation of CHART - Coordinated Highways Action Response Team - Year 2002," University of Maryland, College Park and Maryland State Highway Administration, 2003.)
Traveler Satisfaction Benefits of Traffic Incident Management
The traveler satisfaction benefits include frequency and valuation of assistance to motorists, as well as customer satisfaction. The Georgia NaviGAtor program estimated a $2.995 million benefit from assistance to travelers from May 2003 to April 2004. (USDOT, "Georgia HERO Motorist Assistance Patrol Program," ITS Knowledge Resources Benefits Database, Atlanta, GA, 2006.) This is one of the few instances where the benefits to motorists from the assistance of an FSP were monetized. Most TIM programs capture these benefits through the following metrics:
- The number of motorists that received assistance.
- The service rating provided by motorists, typically through a comment card.
- The minutes of roadside time saved by those assisted, typically through a comment card.
Some agencies hand out comment cards to drivers who are assisted by service patrols on the road. Feedback from the comment cards can be quantitative or qualitative, depending on the types of questions and responses. WSDOT must justify to the legislature how it has used the allocated funding for its IR program. WSDOT uses the data from benefit/cost analyses to justify their program, but it also uses quantitative and qualitative data from the comment cards. WSDOT receives thousands of responses every year. The responses are also shared with the rest of the traveling public as much as possible to improve the overall perception of value. Washington State's legislature is very supportive of programs that the public sees as valuable. (W. Legg, Interviewee, TIM Business Case Interview - WSDOT. [Interview]. 30 November 2015.) The following text is typical language used by WSDOT to provide justification for additional funding: "By not funding the proposed Incident Response patrols, our ability to manage traffic congestion and maintain roadway capacity will stay at this reduced level. As traffic congestion due to collisions, disabled vehicles and population increase, travel times and delays will increase as well. This has a direct impact on the delivery of goods and services to the citizens and business of the state." (WSDOT, "Narrative Justification and Impact Statement for Incident Response," Washington State Department of Transportation, 2013.)
While quantitative data are persuasive, qualitative information is also often useful, especially with the general public and public officials. When established TIM programs develop requests for funding increases, they often make use of data to justify the additional costs, but they also typically use anecdotal information, such as written comments from the traveling public. A good story that includes poignant anecdotes from people who have benefited from TIM complements quantitative metrics and completes the business case.
TIM agencies are cautioned on how the traveler satisfaction benefit is presented. Some agencies may need to counter a perception that FSP supplants the role of a commercial towing or private road service provider using taxpayer dollars. In this situation, the focus should be maintained on enhancing the safety to those assisted as well to the traveling public by more quickly removing shoulder and mainline incidents to restore freeway capacity.
Monetize Traffic Incident Management Benefits and Compute Net Present Value
Monetization is the process of calculating financial values based on the quantified benefits/predicted benefits of TIM activities. In many cases monetization is as simple as multiplying the quantified benefit by a numerical dollar value. Below are some considerations and information on the selection of appropriate financial values to best monetize different TIM program benefits:
- Discount rates - Discount rates are used to estimate future costs, because a dollar today has more value than a dollar in the future. Official USDOT guidance suggests a 7 percent discount rate with a 3 percent discount rate for sensitivity analysis. The 7 percent rate is an estimate of the average before-tax rate of return to private capital in the U.S. economy. (OMB, "Circular No. A-94 Revised (Transmittal Memo No. 64)," Office of Management and Budget, Washington, DC, October 29, 1992.)
- Crash costs - Traffic crashes can impose various types of costs including property damage; medical and rehabilitation care; and lost productivity and disability due to compensation, pain, suffering and grief. Crash costs are typically based on the severity of injuries sustained by vehicle occupants, except in property damage only scenarios where the costs are derived solely on the property damage. In 2015, the National Highway Traffic Safety Administration (NHTSA) issued a revision to the 2010 document, The Economic and Societal Impact of Motor Vehicle Crashes. This document contains information on crash costs in great detail and is the primary source of crash-related monetization guidance. (FHWA, "The Economic Impact of Motor Vehicle Crashes, 2000," National Highway Traffic Safety Administration, Washington, DC, 2002.) A state agency may refine monetary values for crash types using the NHTSA document to reflect their specific crash categories. For example, the North Carolina Department of Transportation (NCDOT) outlines cost per crash based on severity of the crash and on seven types of crashes (frontal impact, lane departure, rear end, pedestrian, bicycle, pedestrian, train, and truck). (B. Robinson, "Memorandum to the North Carolina Department of Transportation: 2013 Standardized Crash Cost Estimates for North Carolina," 10 November 2014. [Online].)
- Time value for passenger vehicle occupants and trucks - USDOT guidance on valuation of travel time provides recommended values for travel time savings (shown in Table 2). USDOT guidance on valuation of travel time and the resource guide for Transportation Investment Generating Economic Recovery (TIGER) grant applications provides values for travel time savings for drivers of commercial vehicles, as shown in Table 3. (USDOT, "Revised Departmental Guidance on Valuation of Travel Time in Economic Analysis (2015 Update)," Office of the Assistant Secretary for Transportation Policy, Washington, DC, 2015.) In a freight-hauling truck, the value is the freight, not the driver. In this case, the earning power of the truck is the correct measure of its time value. The current estimate of average revenue is $65 per hour but ranges from $15 to $105.67. (FHWA, "NCHRP 03-108: Guidance on Quantifying Benefits of TIM Strategies," Transportation Research Board, Washington, DC, 2016 (working document).)
Table 2. Recommended hourly values of travel time savings (2013 $ per person-hour).
| Type of Travel |
Recommended Hourly Value |
Plausible Range of Hourly Values |
| Local Travel - Personal |
$12.50 |
$8.70-$15.00 |
| Local Travel - Business |
$24.40 |
$19.50-$29.30 |
| Local Travel - All Purposes |
$13.00 |
$9.20-$15.60 |
| Intercity - Personal |
$17.50 |
$15.00-$22.50 |
| Intercity - Business |
$24.40 |
$19.50-$29.30 |
| Intercity - All Purposes |
$19.00 |
$16.00-$23.90 |
Table 3. Recommended hourly values of travel time savings (2013 $ per person-hour).
| Type of Travel |
Recommended Hourly Value |
Plausible Range of Hourly Values |
| Truck Drivers |
$25.80 |
$20.70-$31.00 |
| Bus Drivers |
$26.70 |
$21.30-$32.00 |
- Occupancy ratios - Occupancy ratios are important in monetization because they describe the average number of occupants in a vehicle in different conditions. These values may be multiplied by the value of time for vehicle occupants in the corresponding condition. A reliable source for occupancy ratios is the National Household Travel Survey (NHTS), which provides values for average vehicle occupancy by trip purpose. ("National Household Travel Survey: Understanding How People Get from Place to Place," NHTS, [Online]. [Accessed 2016 15 June].) The NHTS does not directly report the all-non-work trip category, but it was calculated based on the share of different types of non-work trips.
- Air pollution costs - Pollution is an increasing concern for transportation agencies and system users. Research on the valuation of different components of pollution is ongoing, and values may change as new results and discoveries emerge from this research. The relative costs of certain pollutants are far greater than others. Likewise, the emissions of certain pollutants are far more than others per gallon of fuel use. USDOT issued the TIGER Benefit-Cost Analysis Resource Guide, providing values for emissions of certain air pollutants in 2013 dollars (shown in Table 4). The pollutants included in this table are volatile organic compounds (VOCs), nitric oxides and nitrogen dioxides (NOx), particulate matter (PM), and sulfur oxides (SOx). The valuations in this table account for the relative costs of each pollutant. (USDOT, "TIGER Benefit-Cost Analysis Resource Guide," United States Department of Transportation, Washington, DC, Updated March 27, 2015.) Studies have reported different values for CO2. Of the existing literature, the largest cost was found to be $220 per ton in a study performed by researchers at Stanford University. (F. Moore, D. Diaz and K. Than, "Estimated Social Cost of Climate Change Too Low," Stanford University, 12 January 2015. [Online]. [Accessed 2015].) The social cost of CO2 is an area of active study, and it is anticipated that further research will be published in the near future with additional guidance. A higher dollar value per ton would provide a more optimistic estimate of TIM benefits, and a lower dollar value per ton would yield a more conservative estimate of TIM benefits.
Table 4. Values for avoided air emissions in 2013 dollars.
| Pollutant |
Cost per Metric Ton |
Cost per Kilogram |
| VOCs |
$1,999 |
$2.00 |
| NOx |
$7,877 |
$7.88 |
| PM |
$360,383 |
$360.38 |
| SOx |
$46,561 |
$46.56 |
- Fuel costs - Fuel consumption costs are typically defined and projected at the State or local levels and can be differentiated by auto and truck market share.
- Travel time reliability - Travel time reliability is important to transportation users but poses challenges for quantification and monetization. It is possible to measure the number of instances of delay as well as delay on specific facilities temporally, which reflects upon the travel time reliability of the facility. To monetize the value of travel time reliability is even less straightforward. Characteristics affecting the precise calculation of reliability include the thresholds at which a trip is outside of a reasonably expected direction, the value of time, the trip purpose, individual and demographic characteristics, mode, distance, and comfort. (USDOT, "Revised Departmental Guidance on Valuation of Travel Time in Economic Analysis (2015 Update)," Office of the Assistant Secretary for Transportation Policy, Washington, DC, 2015.) Research in this field is ongoing, but indirect and user-specific methods are still primary in estimating the role and costs of travel time reliability.
Estimate Traffic Incident Management Costs
Data on TIM costs are required for benefit-cost analyses; thus, TIM program and strategy costs should be tracked so that they are easily accessible and used in analyses. TIM costs include capital investment costs and recurring operating and maintenance costs. While capital investment costs associated with incident response are usually clear, tracking TIM operating and maintenance costs is often complex, because resources are often shared between TIM and other programs or agencies.
Depending on the vision and scope, the establishment or expansion of a TIM program can range from very little initial investments or direct costs to large initial investments or direct costs associated with the acquisition and deployment of equipment and the training and resourcing of personnel. For most programs, TIM costs are under the umbrella of larger agency operations budgets, which may include traffic management and traveler information systems. It can be challenging to isolate how much money is spent on TIM personnel and equipment agency-wide, which impedes the ability to make a solid argument for increasing allocations. (FHWA, "Best Practices in Traffic Incident Management," U.S. Department of Transportation, Publication FHWA-HOP-10-050, 2010.)
Like overall TIM programs, the main cost components of an FSP program include capital, operations, maintenance, and administrative costs. These costs are simplified when the FSP is entirely contracted out and charged on a per truck-hour basis. The annual cost of an FSP depends on the number of centerline miles covered, hours of operations, and number of vehicles maintained. The hours of operation may range from 24 hours to peak service hours only, depending on congestion and budget. (Florida DOT, "Review and update of Road Ranger Cost Benefit Analysis," BDK 84 977-15 Final Report, January 2012.)
Table 5 provides examples of a range of TIM program costs from small FSP programs to comprehensive statewide TIM programs.
Table 5. Range of costs for traffic incident management program - small freeway service patrol programs to comprehensive statewide traffic incident management programs.
| Program Cost($) |
Program Type |
Program Details/Description |
| Few hundred thousand dollars |
Freeway Service Patrol |
Annual cost of service patrols operating only during the peak hours, maintaining a low fleet of vehicles. (L. Hagen, Z. Huaguo and H. Singh, "Road Ranger Benefit Cost Analysis," Florida Department of Transportation, 2005.) |
| $500,000 |
Heavy Tow Program |
Annual cost of the Colorado Department of Transportation's Heavy Tow Program along the I-70 corridor between Denver and Vail. (FHWA, "Traffic Incident Management Handbook," U.S. Department of Transportation, Publication FHWA-HOP-10-013, 2010.) |
| Few million dollars |
Freeway Service Patrol |
Annual costs of maintaining a service patrol fleet of more than 50 vehicles and providing 24-hour service (Chicago, DC, Oakland, and Orange County). (L. Hagen, Z. Huaguo and H. Singh, "Road Ranger Benefit Cost Analysis," Florida Department of Transportation, 2005.) |
| $2.4 million |
Freeway Service Patrol |
Annual costs associated with Hampton Roads, Virginia Safety Service Patrol. (L. Dougald, "A Return on Investment Study of the Hampton Roads Safety Service Patrol Program," Virginia Transportation Research Council, VTRC 07-R33, 2007.) |
| $9.5 million (Not necessarily annual costs. See Program Details/Description for cost breakdowns.) |
Comprehensive Statewide Incident Response Program |
The WSDOT Incident Response Program required biennial spending. (W. Legg, Interviewee, TIM Business Case Interview - WSDOT. [Interview]. 30 November 2015.)
- Includes 6 TMCs, 58 trucks and the personnel that operate them, and regional supervisors and vehicles.
Additional $500,000 biennium to fund the information technology (IT) office for all applications and software for IR and TMCs that are shared statewide. |
| $20 million dollars |
Freeway Service Patrol |
Annual cost of Metro freeway service patrol in Los Angeles, which maintains a fleet of 150 vehicles and covers about 650 center line miles. (L. Hagen, Z. Huaguo and H. Singh, "Road Ranger Benefit Cost Analysis," Florida Department of Transportation, 2005.) |
| $29.115 million (Not necessarily annual costs. See Program Details/Description for cost breakdowns.) |
Comprehensive Statewide TIM Program |
In its 2006 TIM Strategic Plan, the Florida Department of Transportation (FDOT) estimated costs to build its TIM program over a 3-year period. The estimates included. (Florida DOT, "Florida Traffic Incident Management Program Strategic Plan," Prepared by PB Farradyne, 2006.)
- $16,815,000 initial cost.
- $12,299,500 for its continuing improvement, expansion, and sustenance for 3 years.
FDOT has continued to expand the Road Ranger program. In 2010, FDOT reported the annual costs of the Road Ranger program to be about $20 million. |
| $34-36 million (Not necessarily annual costs. See Program Details/Description for cost breakdowns.) |
Comprehensive Statewide TIM Program |
Maryland CHART Program:
- $20 million annual capital budget to fund infrastructure, devices, etc.
- $12 million annual operating budget to fund incident response.
- $2-4 million per year for IT (e.g., develop software). (M. Zezeski, Interviewee, TIM Business Case Interview - CHART. [Interview]. 11 December 2015.)
|
Figure 8 shows a more detailed breakdown of the estimated program costs from FDOT's 2006 TIM Strategic Plan. The programs recommended in the TIM Strategic Plan ranged from no direct costs (e.g., policy changes) to substantial equipment costs (e.g., replacing Road Ranger vehicles). (Florida DOT, "Florida Traffic Incident Management Program Strategic Plan," Prepared by PB Farradyne, 2006.)
Figure 8. Estimated program costs in the Florida Department of Transportation's 2006 Traffic Incident Management Strategic Plan.
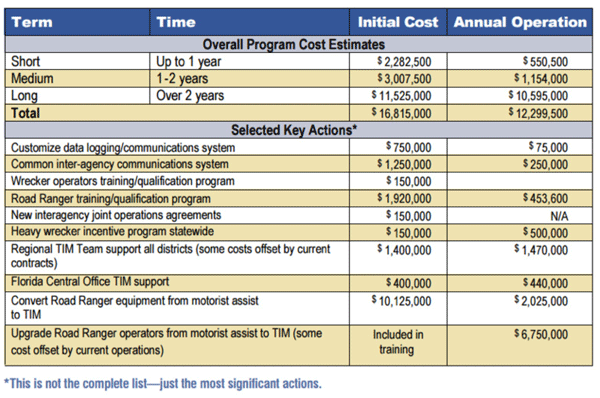
(Source: Florida Department of Transportation.)
In 2009, CHART proposed an operations budget enhancement for the expansion of its FSP coverage area to include all major routes within Maryland and to modify the patrol hours for CHART's traffic operations centers (TOC) 3, 4, and 7 from a 15-hour day, 5 days per week operation to a 24-hour day, 7 days per week operation. These changes went into place in 2012. In CHART's proposal, costs were broken down by a number of component costs including personnel, equipment, annual operating expenses, and other costs. These costs are shown in Figure 9. (CHART, "CHART Statewide Traffic Incident Management Patrol Expansion, Proposed Operations Budget Enhancement," 2009.)
Figure 9. Coordinated Highways Action Response Team's (CHART) proposed operations enhancement costs for Maryland.
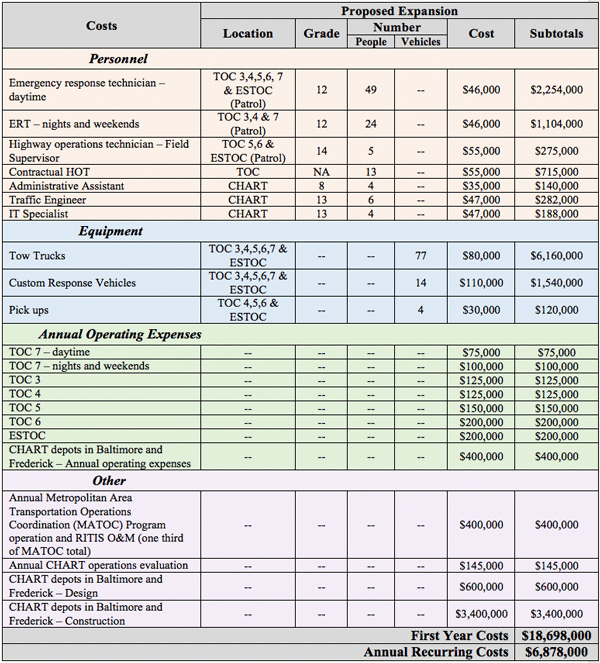
(Source: Maryland Department of Transportation, Coordinated Highways Action Response Team.)
The FHWA Office of Operations Research and Development created a comprehensive TIM-BC estimation tool to assess various TIM strategies. The tool is available at the FHWA' Web site. The first version of the TIM-BC tool focused exclusively on benefit-cost analyses associated with FSP programs. The updated version of the TIM-BC tool includes seven additional commonly-used TIM strategies, including driver removal laws, authority removal laws, per-established towing service agreements, dispatch collocation, shared quick-clearance goals, TIM task forces, and Strategic Highway Research Program 2 (SHRP2) training. (FHWA, "Traffic Incident Management Benefit-Cost (TIM-BC) Tool," Federal Highway Administration Research and Technology, 28 January 2016. [Online]. [Accessed 20 April 2016].) For the program cost, if the overall total annual program cost is not known by the user, the tool provides a cost calculator to enter relevant program information and data to build the cost. The cost calculator for the FSP module is shown in Figure 10. (FHWA, "User's Manual for The Traffic Incident Management Benefit-Cost (TIM-BC) Tool (Version: 2.0)," Federal Highway Administration Research and Technology, September 2015. [Online].)
Figure 10. Image. Freeway service patrol cost calculator in the Traffic Incident Management Benefit-Cost Tool.
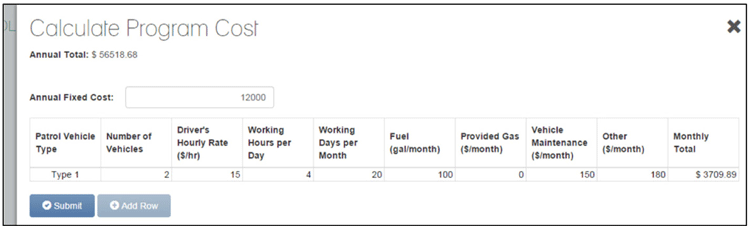
(Source: Federal Highway Administration.)
Conduct Comparative Analysis and Select Preferred Option
One of the culminations of the Evaluate and Select phase is the benefit-cost ratio (BCR). When making the business case for TIM expenditures, the BCR will typically underestimate the value of a program given that costs can be accurately captured, but certain types of benefits are difficult to monetize (e.g. safety and reliability benefits). Therefore, it is essential that the summary of the business case include not only the BCR, but also the quantitative benefits, qualitative benefits, and the strategic fit.
In preparing the comparative analysis, agencies should also examine each alternative with respect to lifecycle risks, specific to the following facets:
- Technical risk associated with extending an existing technology or software and how well the system operates to design specification.
- Interoperability risk associated with how well the proposed system will operate within existing agency systems as well as with partner agencies, such as police or EMS.
- Supportability risk associated with operating and maintaining the system. Are operations funding and technical expertise sufficiently stable to support the system?
- Benefits estimation risk associated with uncertainty in assumptions and/or lack of data. How will benefits change if regional demand decreases or increases, or other assumptions are different than applied?
- Cost estimation risk considering accuracy of cost estimates and potential for cost overrun.
- Schedule risk considering the likelihood that the alternative will be deployed within the specified schedule.
Within the business case report and briefing, agencies should be sure to provide a comparative summary of all options and demonstrate the analytics and strategic basis for the preferred option compared to all others. The evaluation criteria outlined in the analysis should also be reused, along with new information discovered during the detailed analysis. The use of a summary table based on technical evaluation criteria, including alignment with organizational, opportunity, benchmarks, policy, risk, and strategic considerations is preferred. The report may also include return on investment (ROI), internal rate of return (IRR), net present value (NPV), or other benefit-cost computations as relevant to note the preferred option. A descriptive summary of the recommended option should also accompany the summary table.
The recommended option should then be further clarified, including the approach to implement with sufficient detail to instill confidence that the proposed investment has been appropriately considered, and that the presented estimates are within an acceptable degree of accuracy. The recommendation should be presented in a straightforward manner, clearly stating why the organization will benefit by focusing its investment on one particular option.
Evaluate and Select Checklist:
At the end of the Evaluate and Select phase, the following questions have been answered/addressed:
◻ What are the lifecycle benefits and non-monetized benefits of each viable option?
◻ What are the lifecycle costs for each viable option?
◻ How does each option align with business needs?
◻ What are the technical, interoperability, schedule, benefits, and cost risks of the options?
◻ What is the best option and how will we get there?
You may need the Adobe® Reader® to view the PDFs on this page.