Developing PhillyFreightFinder: Regional Data Clearinghouse and Online Mapping Application
Printable Version [PDF, 3.6 MB]
You may need the Adobe® Reader® to view the PDFs on this page.
Contact Information: Freight Feedback at FreightFeedback@dot.gov

U.S. Department of Transportation
Federal Highway Administration
Office of Operations
1200 New Jersey Avenue, SE
Washington, DC 20590
FHWA-HOP-16-078
August 2017
Freight Demand Modeling and Data Improvement Implementation Support
Table of Contents
Executive Summary
Challenges
The Delaware Valley Regional Planning Commission (DVRPC) serves as the metropolitan planning organization (MPO) for Philadelphia, Pennsylvania and the surrounding nine counties. DVRPC's freight program strives to understand both the freight-related activities in the region as well as how these activities affect the region's communities. For those reasons, DVRPC created the Delaware Valley Goods Movement Task Force (DVGMTF). This task force includes both public and private sector participants and serves as DVRPC's freight advisory committee. Along with input to the planning process, the DVGMTF acts as a forum for the local freight community to provide information and data regarding the freight-related activities and facilities in the region. One idea that was developed and implemented with support of the DVGMTF was a centralized data clearinghouse and corresponding online mapping application: DVRPC's PhillyFreightFinder.
DVRPC launched PhillyFreightFinder in 2013 and quickly identified a number of improvements that could be made to the application. To fund these updates, DVRPC applied for and was selected as one of seven projects to develop and pilot innovations in local freight data under the Strategic Highway Research Program 2 (SHRP2) Implementation Assistance Program. The PhillyFreightFinder updates supported the MPO's ongoing freight planning program, established a comprehensive data program useful to DVRPC's public and private partners, can be used for long-term scenario planning exercises, and are critical to the development of a regional freight model.
Approach
Through this project, DVRPC updated and improved its core datasets, updated the interactive web-based mapping tool, and developed a complete set of open source documentation and generic templates to enable other agencies to create and implement a similar freight data clearinghouse and website for their region. To complete this project, the project team identified and evaluated data sources, developed methods to combine datasets, automated the data importing and integration, and established a standard portfolio of core freight datasets that support freight planning, operations, and project prioritization for both the public and private sectors. All data collected during this project were integrated into DVRPC's PhillyFreightFinder to provide a comprehensive product used by a variety of freight stakeholders, including the general public, municipal officials, economic development agencies, and private industry partners.
Benefits
Outcomes of this project include a better understanding of goods movement in the region, insight into freight's role in the region's economic development, and underlying data to support the region's freight performance measures. DVRPC has identified a number of current and potential uses for the PhillyFreightFinder application.
Integration Into Business Practices
Data collected and organized through this effort will be incorporated in the process of developing DVRPC's Transportation Improvement Program (TIP) and work program. Other specific uses of the data will include identification of bottlenecks, project prioritization, promotion of public-private partnerships, and identification of freight and land use considerations.
Introduction
Background
Transportation agencies often struggle to obtain, maintain, and communicate robust and timely freight transportation data. Reasons for this include data owned by different entities (both public and private), proprietary data or privacy issues, data collection costs, and challenges in collecting comprehensive datasets. In recent years, the Philadelphia area metropolitan planning organization (MPO), Delaware Valley Regional Planning Commission (DVRPC), has been taking an innovative and collaborative approach to collecting and maintaining freight transportation data.
DVRPC leads a Delaware Valley Goods Movement Task Force (DVGMTF) to serve as its freight advisory committee in response to the growing number of freight facilities and related needs in the region. The DVGMTF assists the MPO in conducting freight planning by allowing private sector freight stakeholders the opportunity to participate and provide input into the transportation planning process. Along with input into the planning process, the DVGMTF serves as a forum for the local freight community to provide information and data regarding the freight facilities in the region. In 2011, DVRPC staff and DVGMTF members developed a concept of an interactive mapping application that would house and visualize freight-related data for the region. This concept became reality in 2013 when DVRPC launched the PhillyFreightFinder application. PhillyFreightFinder is a structured program to collect and integrate many different freight transportation datasets together in a single location that could be used twofold: (1) the back-end data for detailed transportation analysis and planning purposes, (2) the front end interactive application for education and outreach purposes.
After successfully launching the application in 2013, DVRPC intended to grow and update the underlying data, develop new processes to facilitate data importing and mapping, and to enhance the application's visualizations. DVRPC applied for and received funding under the Strategic Highway Research Program 2 (SHRP2) Implementation Assistance Program to complete the application enhancement activities and develop documentation that would allow other transportation agencies to develop a similar application for their regions.
Project Team
Due in part to DVRPC's commitment to its freight advisory committee and private sector partners, the group was able to secure participation from several regional freight stakeholders, as shown in Table 1.
| Project Partner | Role |
|---|---|
| Steering Committee | Provided input, feedback, and guidance. |
| Federal Highway Administration | Provided coordination support as well as technical and administrative guidance. |
| Maritime Exchange for the Delaware River and Bay | Data provider. |
| New Jersey DOT | Data provider. |
| Pennsylvania DOT | Data provider. |
| Select Greater Philadelphia | Data provider. |
Objectives
The project team identified four objectives to enhance the PhillyFreightFinder application. Key objectives and the work approach are detailed in Table 2.
| Objective | Work Approach | Outcomes |
|---|---|---|
| Identify and assess available data sources. | Conduct a scan of available data sources and evaluate data sources with support of the project steering committee. | A prioritized list of data sources for data collection. |
| Collect data and update freight database. | Work with project partners and other stakeholders to collect, parse, and add data to database. | Comprehensive and detailed database. |
| Enhance data visualization. | Prioritize and implement data visualization tools. | Ability to more easily communicate freight-related trends in the region. |
| Share experience. | Develop open source documentation. | Publicly available open source freight data mapping tool. |
Process
Project Management
Many of the project management resources needed to accomplish updates and improvements to the PhillyFreightFinder application were in place because the initial version had been developed in-house. The project team completed the effort, guided by a steering committee made up of active members of the DVGMTF. These partners provided DVRPC with insight into freight data and information about the availability of such data.
Project Implementation
The DVRPC project team's approach to implement the project included the following activities:
- Establish a steering committee.
- Identify and assess available data sources.
- Collect and evaluate data.
- Update the PhillyFreightFinder database and web application.
- Develop project documentation.
Data Collection
To kick-off the project, DVRPC hosted a steering committee meeting to discuss data needs, sources, and the collection plan. Prior to this meeting, DVRPC compiled a list of potential data sources that the group prioritized for inclusion in the PhillyFreightFinder update.
Following the initial steering committee meeting, DVRPC investigated the highest priority data sources and evaluated each in terms of its use, coverage, cost, required collection efforts, and potential for long-term availability. DVRPC continued to hold meetings with other project partners (e.g., Pennsylvania Department of Transportation (DOT) and Federal Highway Administration (FHWA)) to discuss data availability and obtain data use agreements. After completing a thorough assessment of the available data, DVRPC formalized its data collection plan that they would follow for the remainder of the project.
DVRPC's data collection plan presented an organized list of data sources, which project staff collected and integrated into the PhillyFreightFinder application. The data types included:
- Freight Network Supply.
- Freight Activity Data.
- Freight Economic Data.
- Commodity Flow Data.
- Freight Performance Measure Data.
Freight Network Supply
Freight network supply data is the foundation for the PhillyFreightFinder application. The network is multimodal and includes maritime, highway, rail, aviation, pipeline, and intermodal nodes. DVRPC used its existing highway system, the Regional Primary Freight Highway network, as the basis for PhillyFreightFinder's network. Under this project, DVRPC updated the network to make it consistent with the additional datasets included in PhillyFreightFinder to facilitate future data updates.
Freight Activity Data
Freight activity data allows DVRPC to understand how and where different freight vehicles are moving in the region. Shown in Table 3, the project team identified six types of freight activity data. These are a mix of public and private sector data, with classification counts and weigh-in-motion (WIM) truck counts being public data and train counts, port gate turn counts, and the Annual Vessel Report being private data.
| Model Component | Alternatives | Benefit | Limitation |
|---|---|---|---|
| Classification Counts | Highway | DVRPC | Point-location count data for highways in the region |
| WIM Truck Counts | Highway | Pennsylvania DOT | Data from weigh-in-motion stations that provide truck count and some classification |
| Port Gate Turn Counts | Highway | Terminal Owner/Operators | The number of trucks entering and leaving port terminal facilities |
| Annual Vessel Report | Maritime | Maritime Exchange | Ship count data for the navigable rivers in the DVRPC region |
| Train Counts | Railroad | Class I Railroads | Train counts for railroads in the region |
The team also identified the U.S. Army Corps of Engineers' Waterborne Commerce Statistics, which include information on total volume, value, and 20-foot equivalent units at U.S. ports, as another potential data source. However, the team determined that the data is presented in various table formats and is not consistent with the U.S. Customs Port codes. The team also felt it was redundant with other commodity flow information and decided not to collect and use it.
Freight Economic Data
In addition to transportation data, DVRPC identified three sources of economic data to enhance transportation planning capabilities. Table 4 shows the three datasets, which provided DVRPC with an understanding of freight generator location and size. In combination with other data types, the information gives DVRPC and its partners a more comprehensive understanding of goods movement in the region.
| Name | Source | Description |
|---|---|---|
| National Establishment Time-Series (NETS) | Walls & Associates | Establishment-based dataset that uses companies' Data Universal Number System number to report employment. |
| County Business Patterns | U.S. Census Bureau | Annual statistics on employment by industry at the zip code level. |
| IHS Global Insight Freight Finder | IHS Global Insight | A companion service to TRANSEARCH data that add freight facilities. |
The project team also identified several other potential datasets, such as the Torto Wheaton Database, U.S. Census Bureau's CoStar, and the U.S. Bureau of Economic Analysis's Input-Output Accounts data but, for several reasons, ultimately decided not to include them. The Torto Wheaton Database is a proprietary database available for purchase. For the purpose of this project, members of the project team believed that there was sufficient overlap between their existing datasets and the Torto Wheaton Database and opted not to purchase the dataset. Both the CoStar and Input-Output Accounts data are publicly-available, but the project team determined that the CoStar data was not always complete and the Input-Output Accounts information was largely redundant with the selected commodity flow data.
Commodity Flow Data
In contrast with freight activity data that seeks to quantify the movement of vehicles on the freight network, commodity flow data tracks or estimates the movement of goods. As shown in Table 5, the project team identified six commodity flow datasets. Due to the proprietary nature of the shipping and logistics industry, commodity flow data typically represents estimates or samples of the shipments and varies in geographic resolution. For example, the FHWA Freight Analysis Framework (FAF) data presents commodity origin and destination by FAF regions. FAF regions may consist of a large geographic area (e.g., several counties) making it difficult to use the data for local freight transportation analysis. Other data sources, such as the TRANSEARCH data, include origin and destination estimates that are more specific, but these are proprietary and costly. Fortunately, the Pennsylvania DOT purchased TRANSEARCH data for State freight planning activities and made data covering the entire DVRPC region available to DVRPC's PhillyFreightFinder.
| Name | Mode | Source | Description |
|---|---|---|---|
| Freight Analysis Framework | All | FHWA | Data from several sources is used to estimate freight tonnage, value, and domestic ton-miles by region of origin and destination, commodity type, and mode. |
| IHS Global Insight TRANSEARCH | All | IHS Global Insight | Estimates of freight flows available at the state, business economic area (BEA), and county levels by commodity type and mode of transportation. |
| Public Use Waybill Data | Railroad | Surface Transportation Board | A two percent sampling of shipment details including STCC commodity codes, origins, and destinations. |
| USA Trade Online | Maritime | U.S. Census Bureau | Import/export data for U.S. port activity. |
| U.S. Energy Information Administration (EIA) Company Level Imports | Maritime | U.S. EIA | Details (e.g., quantity, processing facility) on petroleum imported into the United States. |
Performance Measurement Data
For this data collection effort, DVRPC determined that the collection of performance measure data on non-highway modes was not feasible and focused the data collection effort on highway-specific freight performance data. The team identified two data collection sources that were appropriate for performance measurement data: FHWA's National Performance Management Research Dataset (NPMRDS) and the I-95 Corridor Coalition Vehicle Probe Project (VPP) data. Both of these datasets are developed using GPS records from data vendors. The NPMRDS data is developed by the vendor HERE with the truck data by the American Transportation Research Institute (ATRI). Vendor INRIX produces the I-95 VPP data.
| Name | Mode | Source | Description |
|---|---|---|---|
| National Performance Management Research Dataset | Highway | FHWA | Average travel times collected by GPS data available to State DOTs and MPOs for performance measurement. |
| I-95 Vehicle Probe Project | Highway | I-95 Corridor Coalition | Average travel times collected by GPS data available to members of the I-95 Corridor Coalition. |
The project team decided to use the NPMRDS data to focus on performance measurement, supplementing with the I-95 VPP data. While DVRPC is more familiar with the I-95 VPP data, and the I-95 VPP data provides more coverage in DVRPC's region, this dataset does not separate truck traffic from passenger vehicles. To supplement the NPMRDS data, the project team inferred truck travel speed from passenger vehicle speed by conducting observations at specific locations that were not covered in the NPMRDS data.
Application Updates
With the new data collected, the project team added three tools to PhillyFreightFinder:
- The Maritime Indicators Tool.
- The Highway Performance Tool.
- The County Profile Tool.
These updates enhanced users' ability to view and understand freight data in the application.
The Maritime Indicators Tool tracks maritime activity in the region and communicates performance. The project team selected five indicators for this tool:
- Regional port rank by volume.
- Total trade.
- Total foreign trade.
- Maritime exports.
- Export as a share of foreign trade.
The tool also includes a visualization of vessel activity, by terminal, in the region. To display this information, the 31 marine terminals in the DVRPC region are color-coded based on facility type and number of ship calls received. The final component of the tool is an interactive graph charting maritime activity (e.g., domestic, import, and export shipments) over time. An illustration of this tool is shown in Figure 1.
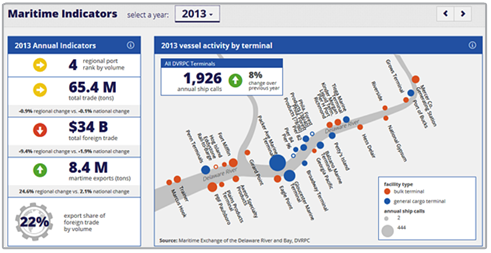
Figure 1. Maritime Indicators Tool.
Source: Delaware Valley Regional Planning Commission (2016). PhillyFreightFinder – Maritime Indicators. Philadelphia, PA. Retrieved from http://www.dvrpc.org/webmaps/phillyfreightfinder/#maritime-indicators, last accessed October 19, 2016.
DVRPC developed the Highway Performance Tool to provide an interactive way to understand highway performance with a commercial vehicle focus. Using the NPMRDS dataset, the Highway Performance Tool displays the truck travel time index and average truck speed in the region. Users are able to select time of the day to view highway performance. They also have the ability to activate an animation that shows how performance changes throughout the day. The tool allows users to pan and zoom into the map to view specific segments in more detail. A sample image from the tool is provided in Figure 2 type (e.g., volume and value), shipment direction, and mode of transportation. An image from the trade pattern section of the County Profile Tool is shown in Figure 2.
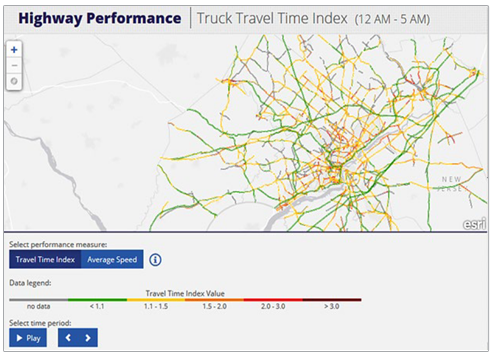
Figure 2. Highway Performance Tool.
Source: Delaware Valley Regional Planning Commission (2016). PhillyFreightFinder – Highway Performance. Philadelphia, PA. Retrieved from http://www.dvrpc.org/webmaps/phillyfreightfinder/#highway-performance, last accessed October 19, 2016.
The County Profile Tool allows users to explore freight centers, areas attracting or generating freight trips, by displaying employment, establishment, and trade data for each of the nine counties within the DVRPC region. The tool provides summary data for the freight network statistics for each mode (e.g., interstate miles, number of truck stops and rest area, number of intermodal terminals, etc.) and trade patterns in each county. The County Profile Tool provides users with an interactive ability to understand trade patterns by selecting the measurement type (e.g., volume and value), shipment direction, and mode of transportation. An image from the trade pattern section of the County Profile Tool is shown in Figure 3.
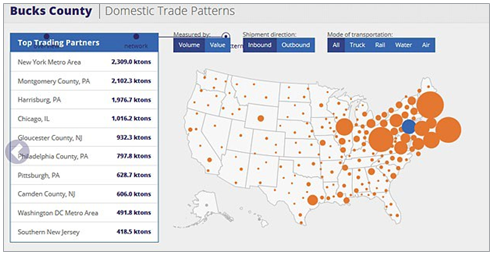
Figure 3. County Profile Tool.
Source: Delaware Valley Regional Planning Commission (2016). PhillyFreightFinder – County Profile. Philadelphia, PA. Retrieved from http://www.dvrpc.org/webmaps/phillyfreightfinder/#region, last accessed October 19, 2016.
Open Source Application Development
OpenFreightApp is an open source version of PhillyFreightFinder developed during this project. The OpenFreightApp includes documentation for various integration and use options and all source material is publicly available for download and replication by any user. To prepare this documentation, the project team conducted outreach to other MPOs, such as the Wilmington Area Planning Council (WILMAPCO) and the Baltimore Metropolitan Council (BMC) to discuss the utility of the application. Both agencies provided feedback to DVRPC and used the OpenFreightApp documentation to develop a similar application.
DVRPC removed all DVRPC-related branding so that users can easily customize the application to an individual agency. Requirements for using the OpenFreightApp are minimal. They include an internal capacity for geographical software (e.g., GIS), staff capacity for HTML and JavaScript development, and the ability to host the application on a web server. No specific existing databases or GIS servers are required.
Outcomes
This section discusses the outcomes of the project. A summary of the project benefits, transferability, lessons learned, and next steps are show in Table 7. Additional detail is described following the table.
| Activity | Data Description |
|---|---|
| Outcomes |
|
| Impacts |
|
| Transferability |
|
| Lessons Learned |
|
| Next Steps |
|
Project Benefits
DVRPC's primary purpose in the project was the enhancement of the data clearinghouse by building upon existing freight transportation-related data. This effort included a number of activities working with both public and private sector data sources to collect, analyze, clean, and import into DVRPC's data clearinghouse. DVRPC developed both a comprehensive freight data and analysis framework and long-term guidance for freight data collection and analysis initiatives. The project team developed new processes and methodologies to facilitate and automate the data importation process. Updates to DVRPC's data not only enhanced the value of the PhillyFreightFinder application, but also provided DVRPC's analysts and planners a better understanding of goods movement in the region. This understanding further allows the capability to better plan, model, and prioritize projects as well as identify freight and land use considerations. The collection and inclusion of freight economic data into DVRPC's data clearinghouse gives DVRPC and its partners the ability to connect economic development with freight transportation.
This project set a foundation for freight performance measures and the identification of freight-specific bottlenecks and problem locations for select commodities and industries. The data collected made possible the establishment of a data-driven decision making process to prioritize candidate projects seeking Federal funds (e.g., for the Long Range Plan and Transportation Improvement Program), helping clarify their relative benefit in terms of improving freight systems and operations within the region. The project also created an analysis framework to connect regional economic development with freight transportation system improvement needs by profiling freight generators, freight-related employment, and commodity movements within the region. The data supports development and calibration of an advanced regional freight demand model as well.
The project enhanced the capabilities of the external-facing PhillyFreightFinder tool. By better portraying freight flows and trends in the region, DVRPC can more easily communicate the need for freight transportation-related planning and projects to lay audiences. The application is accessible to the public online and users can use the tool for both educational and transportation planning purposes.
Transferability of the Project
The open source version of the PhillyFreightFinder developed in this project (OpenFreightApp) provides other agencies with all of the critical components required for replication of a web and data mapping product. Through the development of the product, several agencies showed a very strong interest in replicating the effort. Two agencies, Wilmington Area Planning Council and Baltimore Metropolitan Council, used the open source product to develop a similar application.
Lessons Learned
Building a good relationship with potential partners and maintaining open communication among all partners is critical for data collection. The project team involved both public and private sector partners in data exchange. These partners provided helpful advice on potential data sources, shared experience in using different data for planning and operations, and made data available for the study. A formal data agreement with partners helped ensure the data acquisition and publishing process was completed on schedule and can help limit issues in obtaining data due to personnel changes at the partner organizations..
It is important to identify redundant data sources during the data source identification phase. The team found that one commodity flow dataset Port Import/Export Reporting Service (PIERS) was more difficult to obtain than expected. In the initial stages of the project, the project partner with access to PIERS data believed that it could be made available to the DVRPC team with a user agreement. However, after further review, the project team found that a more formal agreement was required and the development of such an agreement was outside the scope of this project. To overcome this challenge, the project team identified USA Trade Online data as an alternative. While the USA Trade Online information does not offer as rich a dataset as the PIERS data, it did include information useful in updating the application.
The project team found integrating and analyzing large datasets, such as NPMRDS, challenging. Coverage, sample size, and quality of the freight travel time data must be improved to enable more effective analysis. The project team believes that for their purposes, the NPMRDS dataset may be sufficient to calculate performance measures but is inadequate for reliability measures of truck movements. It is worthwhile in developing a better understanding of the data source and a more efficient data filtering method.
The project team found identifying practical uses of freight data and prioritizing the data collection plan to be critical. Given the number of different data sources and the resources required to collect and process each, a long-term and sustainable plan to build local/regional freight data resources is advisable. Another important consideration is developing different approaches for sharing and using the data among various users. Freight-related data is often useful for other purposes (e.g., general transportation planning, economic development, etc.) along with identifying the range of both users and the uses of the data that will assist in demonstrating its value. While the team encountered challenges when collecting some of the datasets identified in the original data collection plan (e.g., port gate turns), the identification and evaluation of these data sources will support DVRPC in completing future collection and integration activities for these data sources.
Next Steps
The project positioned DVRPC to pursue a number of additional activities. The project staff has already held several technical outreach meetings with planning partners. These meetings were designed to facilitate better participation in the development of the database, incorporate appropriate data, and promote the application for use by other agencies. DVRPC intends to hold additional meetings with local planning partners and other users to discuss the enhanced application and potential uses for the tool.
PhillyFreightFinder's effectiveness depends upon updates to the data it provides. The DVRPC project team established a plan to regularly refresh its datasets and will review publicly available data annually. Automation developed to parse and import data during the project will also help minimize the level of effort required to keep the information current.
The project team intends to improve the application with the addition of other data types. DVRPC plans to add additional characteristics that help describe the facilities in greater depth. The team also intends to add rail freight activity and county level import/export flows.
Next steps for improving the freight network include consolidating into one system primary freight and regional model networks data with truck counts and NPMRDS travel time. The consolidated network is expected to aid in the development, calibration, and use of a freight model for the region.
Conclusion
The project successfully leveraged existing relationships to bring freight transportation stakeholders together to share data, and to enable refinement of an existing tool to gain better insight into freight movement in DVRPC's region. Outcomes from the project include:
- A reliable, single-source database housing various freight-related datasets.
- An assessment of available data sources.
- A plan to continue collecting and updating the MPO's freight data.
- Updated processes and tools for using and sharing the data.
- A well-documented, open source version of the application for use by DVRPC's peers.
In summary, activities completed on this project demonstrate the outcome of successful, long-term public- and private-sector collaboration to enhance freight planning in the region.
Product Information
Product Title: SHRP2 C20: Innovations in Local Freight Data
Agency Name: Delaware Valley Regional Planning Commission
Contact Information:
Resources
PhillyFreightFinder
PhillyFreightFinder is available at: http://www.dvrpc.org/webmaps/phillyfreightfinder/.
OpenFreightApp
OpenFreightApp is designed to share with regional and national transportation planning partners the framework that forms the basis for the PhillyFreightFinder web mapping and data application. The OpenFreightApp is available at: http://dvrpcfreight.github.io/open-freight-app.
The second Strategic Highway Research Program (SHRP2) is a partnership of the Federal Highway Administration (FHWA), the American Association of State Highway and Transportation Officials (AASHTO), and the Transportation Research Board (TRB). TRB completed the research, and now FHWA and AASHTO are jointly implementing the resulting SHRP2 Solutions that will help the transportation community enhance productivity, boost efficiency, increase safety, and improve the reliability of the Nation's highway system.
Fang Yuan
Principal Transportation Engineer
Office of Freight and Aviation Planning
Phone: 215-238-2885
E-mail: fyuan@dvrpc.org
Michael Ruane
Transportation Planner
Office of Freight and Aviation Planning
Phone: 215-238-2888
E-mail: mruane@dvrpc.org
Birat Pandey
SHRP2 Freight Implementation Specialist
FHWA-Office of Freight Management and Operations
Phone: 202-366-2842
E-mail: Birat.Pandey@dot.gov
Learn more about the SHRP2 program, its Capacity focus area, and Freight Demand Modeling and Data Improvement (C20) products at www.fhwa.dot.gov/GoSHRP2/
STRATEGIC HIGHWAY RESEARCH PROGRAM
U.S. Department of Transportation Federal Highway Administration
American Association of State Highway and Transportation Officials - Transportation Research Board