Effectiveness of Disseminating Traveler Information on Travel Time Reliability: Implement Plan and Survey Results Report
CHAPTER 9. DATA ANALYSIS
The aggregate information for the baseline survey, Phase 2 trip diary, and exit survey data were utilized to perform the analysis for determining if Travel Time Reliability (TTR) information dissemination Lexicon (A or B) or channel (511, Web, App) generated a significant impact on the utility or satisfaction of trip planning and execution. The baseline survey data results were analyzed to assess any preexisting differences between treatment groups. The exit survey data were analyzed using logistic regression or ordinal logistic regression to establish the response probabilities associated with TTR information dissemination channel and Lexicon as a function of demographic and travel characteristic data. Separate statistical models were fit to the study survey questions using SAS® 9.3.
BASELINE SURVEY ANALYSIS
Baseline survey data first were analyzed to establish whether the assignment of the treatment groups (dissemination method and Lexicon assembly) resulted in similar distribution patterns among key demographic and self-reported travel characteristics. This is important to assess because an association between demographic or travel characteristics and treatment group at the study start could produce subsequent results that are influenced by this initial relationship. For instance, if one dissemination method group was systematically older than the other groups, subsequent study outcomes that are found to be associated with the dissemination method might instead be attributable to this additional factor of age that had more impact in one group than another.
To assess the risk of this concern, statistical Chi-square tests of association were conducted to test whether treatment groups were associated with key demographic and travel information. Table 43 summarizes the Chi-square test results, showing the test details of degrees of freedom and the test statistic, as well as the P-value for the test. Test P-Values reflect the probability of how unusual the observed association between assigned treatment group and demographic group is compared to an ideal case of no association. P-values less than 0.05 reflect less than a 1 in 20 chance that the observed association occurred simply by chance and are used to identify a threshold for what will be referred to as a statistically significant outcome.
There were no statistically significant associations between treatment group and demographic and travel characteristics variables. Absent evidence of these significant associations, subsequent differences between the treatment groups will be interpreted to be associated with the testing and not possibly reflective of an a priori bias in the panel composition.
| Test Cases | DF | Value | P-Value |
|---|---|---|---|
| TreatmentGroup * Age | 15 | 8.45 | 0.90 |
| TreatmentGroup * Employment | 5 | 7.62 | 0.18 |
| TreatmentGroup * Gender | 5 | 0.03 | 1.00 |
| TreatmentGroup * Income | 10 | 9.92 | 0.45 |
| TreatmentGroup * Frequency of checking App for info | 10 | 17.76 | 0.07 |
| TreatmentGroup * Frequency of checking Web for info | 10 | 15.22 | 0.12 |
| TreatmentGroup * Frequency of checking 511 for info | 10 | 7.35 | 0.69 |
| TreatmentGroup * Frequency of departure earlier due to travel info | 20 | 30.80 | 0.06 |
EXIT SURVEY ANALYSIS
Data Processing
The Exit Survey dataset includes in a total of 772 participants, with 734 (95 percent) of them completing at least four Phase 2 trips. An additional 28 participants completed between one and three Phase 2 trips, and ten participants did not complete any Phase 2 trips (these ten participants were mistakenly invited to the take the Exit Survey due to a processing error in Houston Round 2). The participants who did not complete any Phase 2 trips were excluded from the modeling dataset because they would not have been able to answer questions from the perspective of their assigned Phase 2 information channel. It was desired that participants complete at least four Phase 2 trips, but the 28 that completed between one and three Phase 2 trips were retained in the results.
Table 44 shows the distribution of exit surveys by study site.
| Number of Phase 2 Trips | West Houston (Texas) | North Houston (Texas) | North Columbus (Ohio) | Triangle (North Carolina | Total |
|---|---|---|---|---|---|
| 4 or more | 103 | 253 | 270 | 108 | 734 |
| 1-3 | 21 | 0 | 4 | 3 | 28 |
| 0 | 10 | 0 | 0 | 0 | 10 |
| Total | 134 | 253 | 270 | 111 | 772 |
The analysis of exit survey data focused primarily on four types of questions: information usage, behavior change, traveler opinion, and traveler satisfaction. Logistic regression models were developed to investigate the impact of Lexicon and information channels (i.e., App, website, 511) on travelers' responses. In addition, some exogenous factors were believed to be related to the outcome of interest; therefore, the impact of these variables needed to be accounted for through the modeling process. These exogenous factors included demographic information and trip-related characteristics, and they were directly obtained or calculated from baseline surveys and Global Positioning System (GPS) trip datasets. Table 45 lists all independent variables that were included in the modeling process. Note that some of the category variables were collapsed into larger groups to address the unbalanced group issue in the raw data (e.g., the income variable was collapsed from 10 to 3 classifications for analysis).
| Variable | Description | Type | Source |
|---|---|---|---|
| Treatment_Assembly | Lexicon assembly for participant treatment group: A or B | Category | Exit Survey |
| Treatment_Mode | Information access mode for participant treatment group: App, Web, or 511 | Category | Exit Survey |
| Location | Study location participant traveled on and reported on during the study: Houston, Columbus, or Triangle | Category | Exit Survey |
| Gender | Male or female | Category | Baseline Survey |
| Education | Education level: Less than college, college degree, higher than college | Category | Baseline Survey |
| Income | Income level: Under $50,000, $50,000-$99,999, or $100,000+ | Category | Baseline Survey |
| Age | Age group: Under 25, 25-44, 45-64, or 65+ | Category | Baseline Survey |
| Employment | Employment status: Full time employed, or Others | Category | Baseline Survey |
| Average_Distance | Average trip distance for all trips the participant completed during the study period | Continuous | GPS Trip |
| Peak_Hour | Percentage of peak hour trips (7 AM-10 AM, 4 PM-7 PM) among all trips the participant completed during the study period | Continuous | GPS Trip |
| Weekday | Percentage of weekday trips among all trips the participant completed during the study period | Continuous | GPS Trip |
| Phase2_Count | Number of Phase 2 trips the participant completed | Continuous | GPS Trip |
Statistical Analysis Methods
Throughout the subsequent analysis section, statistical results will be presented. The first result is a descriptive bar graph panel for each survey question that shows the frequency of participants responding to each question option within each of the Lexicon assembly and delivery methods examined.
The survey response data were subsequently fit to logistic or ordinal logistic regression models using the SAS™ LOGISTIC procedure. Responses were collectively grouped into either an affirmative or negative category as described below within each section, or into a set of ordinal ranking groups (e.g., Strongly Disagree, Disagree, and Somewhat Disagree as one category; Neutral as a second category; and Somewhat Agree, Agree, and Strongly Agree as a third category). Each model was fit with fixed effects for the Lexicon assembly and delivery method and additional covariate fixed effects for the primarily categorical demographic and travel characteristic fields as documented in Table 45. The detailed model fits for each question are provided in Appendix T (Table 46 through Table 62).
From the statistical model fits, odds ratios and their corresponding 95th percent confidence intervals were calculated to compare the responses by TTR information delivery method and Lexicon group. An odds ratio from a logistic regression model provides the relative odds of a positive response for one category compared to another. For instance, if 60 percent of participants of one group select a positive survey response, the odds of that response are 0.6/0.4=1.5. If the comparator group selects the positive response 40 percent of the time, their odds are 0.4/0.6=0.67. The odds ratio is the ratio of these two odds, or 1.5/0.67=2.25. In this example, the 60 percent vs. 40 percent represents 2.25 times the odds in the first group compared to the reference. Odds ratios greater than one indicate higher probability of being in the positive response group and odds ratios less than one indicate the opposite. If the 95th percent confidence interval is entirely above one (i.e., the lower bound of the interval is above one), it provides strong evidence that the treatment group probability is greater than that of the reference. Strong evidence means no more than 1 chance in 20 the observed outcome could have occurred just by chance if the reference group probability was truly equal to the treatment group. Odds ratios from the ordinal logistic regression models have a similar interpretation except that they are extended to represent the odds of being in any higher ordinal group compared to the one below (e.g., Agree vs. Neutral and Neutral vs. Disagree).
Odds ratio results are provided in a graph for each question. Separate estimates are shown for the odds ratio comparisons of positive responses of 511 participants compared to those that used the mobile phone App, 511 participants compared to those that used the website, and mobile App access versus website access; and then for those participants that obtained their travel reliability information with Lexicon A compared to those who received it with Lexicon B.
Model Results – Information Usage
In the exit survey, participants were asked how often they checked the Transportation Study Resource for traveler information when planning familiar or unfamiliar trips on the study corridor. They were requested to select one of five frequency levels: More than once/day, Once/day, A few days/week, About one day per week, or Never. This section presents the analysis results for information usage regarding familiar trips and unfamiliar trips, respectively.
Figure 28 presents the frequency of participants' responses on planning familiar trips by delivery method and Lexicon. No obvious differences by Lexicon were observed among participants with the same information channel. However, it appears that participants who were pre-assigned to 511 access were less likely to use the Transportation Study Resources, compared with App access and Web access participants.
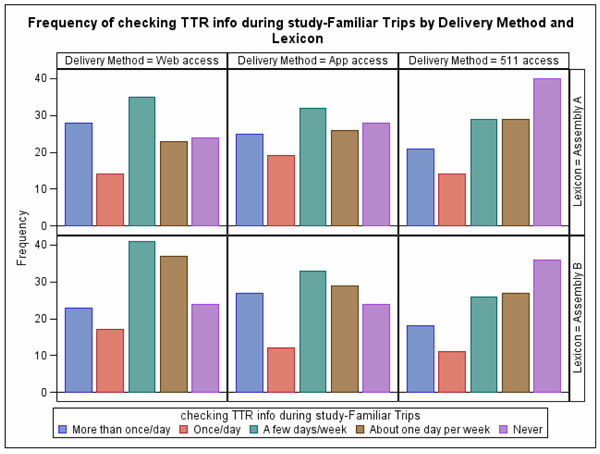
Figure 28. Chart. Frequency of checking the transportation study resources for familiar trips.
A binary logistic model was fit to test whether travelers' usage of the Transportation Study Resources correlated with the pre-assigned Lexicon and information channel. Participants' responses were aggregated into two larger groups: Never checked the resources, and Checked the resources at least one time. Table 46 shows the detailed model results, which found that Location (Columbus compared to Triangle), and Employment (Full-time vs other) were covariates linked to significantly greater probability of a positive response.
The odds ratios for Lexicons and information channels were estimated in the logistic regression model. The odds ratios quantify the change in the response via the ratio of odds in the compared group over the odds in the reference group. An odds ratio higher than one indicates an increase, while less than one indicates a decrease compared to the reference group in likelihood of checking TTR resources. Figure 29 shows the odds ratios between information channels and between Lexicons. When comparing participants with 511 access to participants with App access, the odds ratio of 0.58 was statistically significantly less than 1 at the 0.05 level. This indicates that participants with 511 access were significantly less likely to use the assigned Transportation Study Resources than participants with App access. Similarly, the odds ratio of 511 access vs. Web access also is significantly less than 1 (odds ratios=0.47), indicating that the likelihood of participants with 511 access using the assigned resources was only half of Web access participants. However, there were no statistical differences between App access and Web access, as the odds ratio is not significantly different than 1. When the two assemblies were compared, no significant impacts were found on the probability of using the Transportation Study Resources for familiar trips.
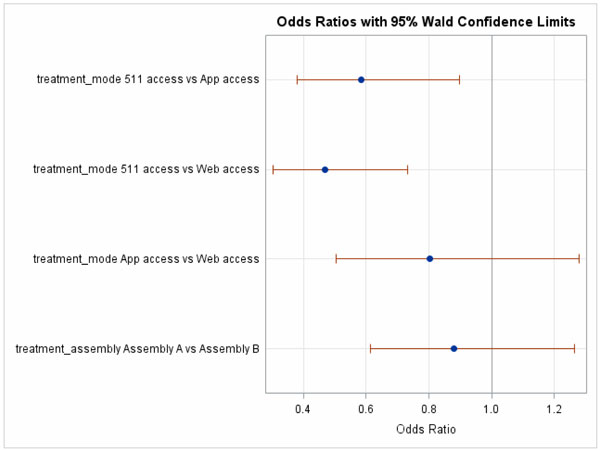
Figure 29. Chart. Odds ratios with 95 percent confidence limits – information usage for familiar trips.
A similar analysis approach was applied to participants' responses on the frequency of checking TTR information for unfamiliar trips during the study period. Figure 30 shows the distribution of response by information channel and Lexicon. Compared with familiar trips, participants checked TTR information less frequently. Again, similar distribution patterns were found between the two Lexicons within the same delivery method/information channel. More participants with 511 access reported that they never checked TTR information than the other two channels.
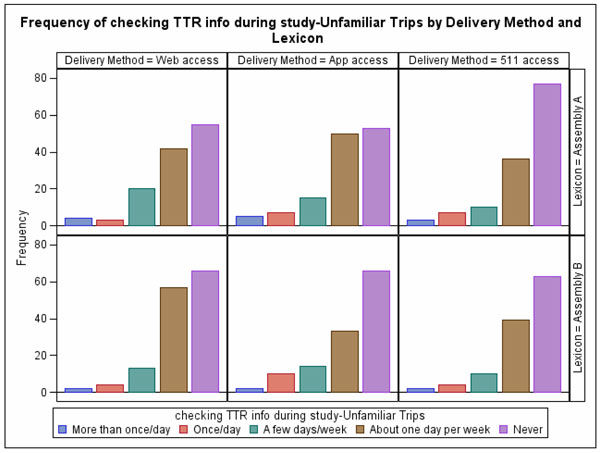
Figure 30. Chart. Frequency of checking the transportation study resources for unfamiliar trips.
The probability of participants checking TTR information was fit to a logistic regression model. Table 47 shows the model results, which found that participants with higher proportions of Peak_Hour and Weekday trips were more likely to check TTR for unfamiliar trips.
Figure 31 presents the odds ratios results from the logistic regression model, which are similar to the findings from the model of familiar trips. Participants with 511 access were significantly less likely to check TTR information than participants receiving information from the other two channels. There were no significant differences between the two Lexicons.
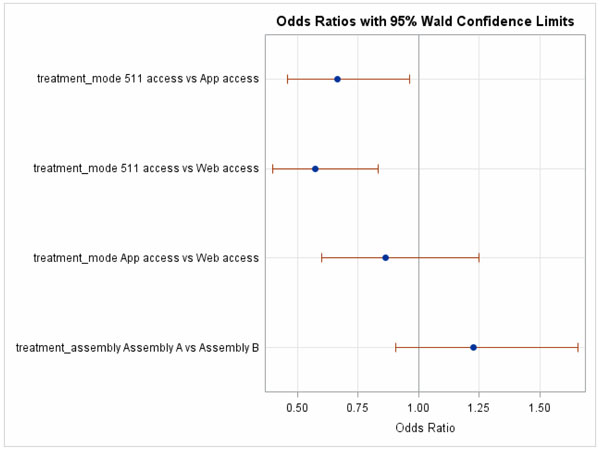
Figure 31. Chart. Odds ratios with 95 percent confidence limits – information usage for unfamiliar trips.
Model Results – Behavior Change
To investigate the impact of Lexicon and information channel on travelers' behavior change, participants were asked how often they change their trip plan due to what they had learned from the TTR resources. As shown in Figure 32, eight types of trip changes were considered, and participants could choose one of the six responses for each type of trip change. The same questions were asked separately for familiar trips and unfamiliar trips.
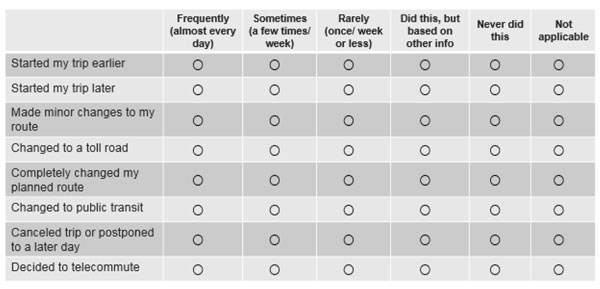
Figure 32. Chart. Behavior change questions.
Depending on participants' responses on the behavior change questions, they were divided into two groups. The first group of participants did not make any change to their trip plans or made changes based on other information. The second group of participants indicated they made at least one of the eight trip changes (from Rarely to Frequently).
Figure 33 illustrates the frequency of whether participants changed their trip plan due to TTR information. Some difference can be observed by Lexicon and information channel. Assembly A participants with Web access more frequently reported that they changed trip plans as a results of the TTR information they received than those of Assembly B. Regardless of assigned Lexicon, more than 50 percent of participants with App access did change their trip plans due to the TTR information.
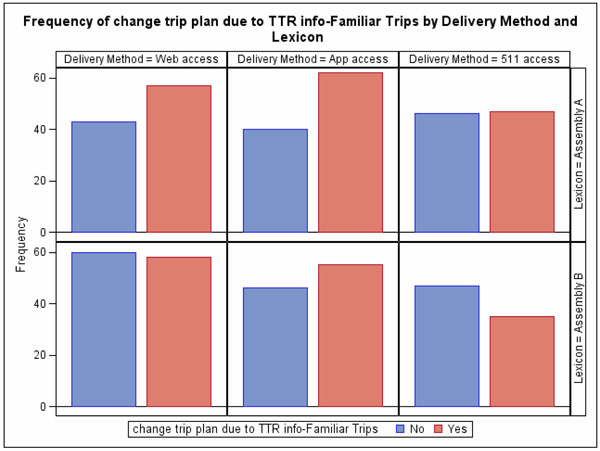
Figure 33. Chart. Frequency of changing the plan due to travel time reliability information for familiar trips.
To test whether the Lexicon and information channel bring significant impact to behavior changes, a logistic regression model was applied to model the probability of changing the plan for familiar trips. Table 48 shows the model results, in which location (Houston>Triangle), Education (Less change based on TTR for college graduates), and Phase2_Count (Less change based on TTR for more trips) were found to be significant covariates.
From the logistic model results, the odds ratios were calculated, as shown in Figure 34. The odds ratios indicate that the likelihood of participants with 511 access changing their plan due to TTR information for familiar trips was about 60 percent of that for participants with Web access or App access. The difference is statistically significant. Assembly A was found to statistically significantly increase the likelihood of behavior change due to TTR information by a factor of 1.6, compared with Assembly B.
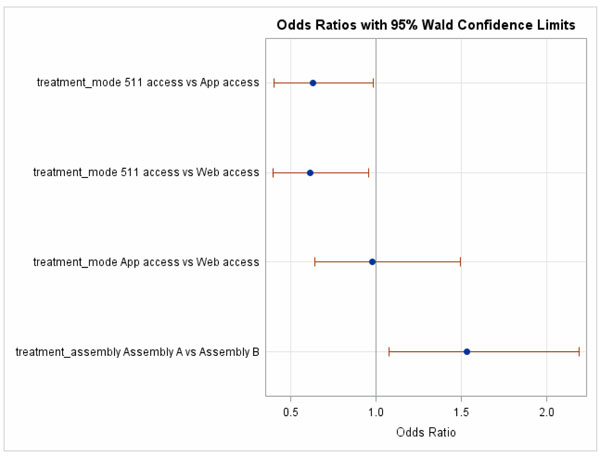
Figure 34. Chart. Odds ratios with 95 percent confidence limits – behavior change for familiar trips.
The impacts of Lexicon and information channel on behavior change for unfamiliar trips are not as considerable as those for familiar trips. However, for most delivery method and Lexicon combinations, more respondents reported using TTR information to make changes to trip plans than not (see Figure 35).
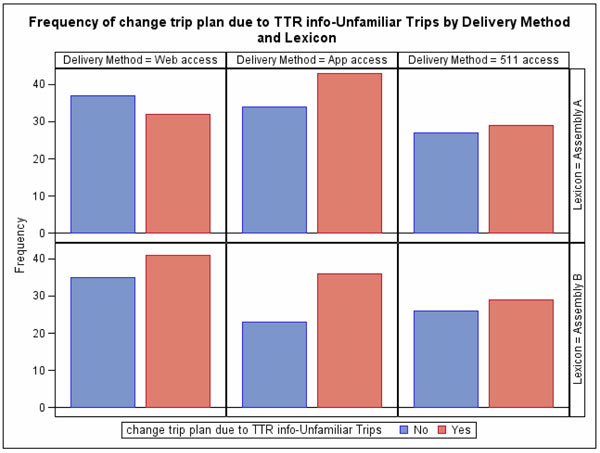
Figure 35. Chart. Frequency of changing the plan due to travel time reliability information for unfamiliar trips.
A logistic regression was fit to model the probability of participants changing their plans due to TTR information for unfamiliar trips. Table 49 shows the model results, in which Education (Less change based on TTR for college graduates), and Phase2_Count (Less change based on TTR for more trips) were found to be significant covariates.
The calculated odds ratios show no significant impact of Lexicon or information channel on behavior changes due to TTR information for unfamiliar trips (see Figure 36).
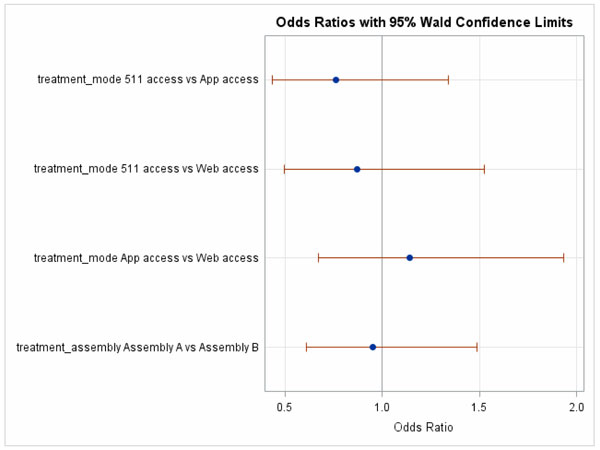
Figure 36. Chart. Odds ratios with 95 percent confidence limits – behavior change for unfamiliar trips.
Model Results – Travel Time Reliability Ratings
Participants were asked to indicate their agreements with eight TTR rating statements, where responses were one of seven levels of agreement from Strongly Disagree to Strongly Agree, or Not Applicable. This section presents the analysis results for each statement.
Statement 1: The Transportation Study Resource was Easy to Understand.
Figure 37 shows that the majority of participants agreed that the TTR information was easy to understand. The most common response was Agree, regardless of the Lexicon and delivery method.
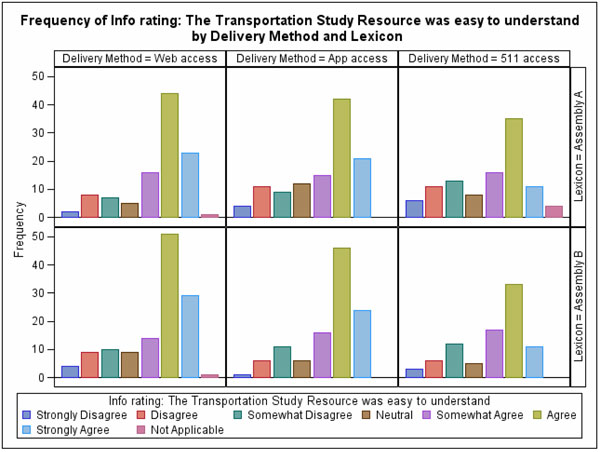
Figure 37. Chart. Frequency of agreement that the transportation study resource was easy to understand.
Ordinal logistic regression modeling was applied to quantify the impacts of Lexicon and information channel in participants' agreement with the statement and to account for exogenous factors regarding demographic and trip characteristics. In the statistical model, Not Applicable responses were excluded. Furthermore, the seven response categories were aggregated into three larger groups: Disagree (Strongly Disagree, Disagree, and Somewhat Disagree), Neutral, and Agree (Somewhat Agree, Agree, and Strongly Agree). The analysis modeled the probabilities of travelers reporting a higher agreement level. Table 50 shows the model results, with Income (50-100k group significantly higher agreement than those below 50k) being the only significant covariate.
From the ordinal logistic model results, the odds ratios were calculated, as shown in Figure 38. The odds ratios indicate that the likelihood of participants with 511 access agreeing with the statement was significantly lower than Web access participants, by a factor of 0.57. The differences between 511 access and App access, and between Web access and App access were not significant. In addition, there was no significant impact of Lexicon on the agreement.
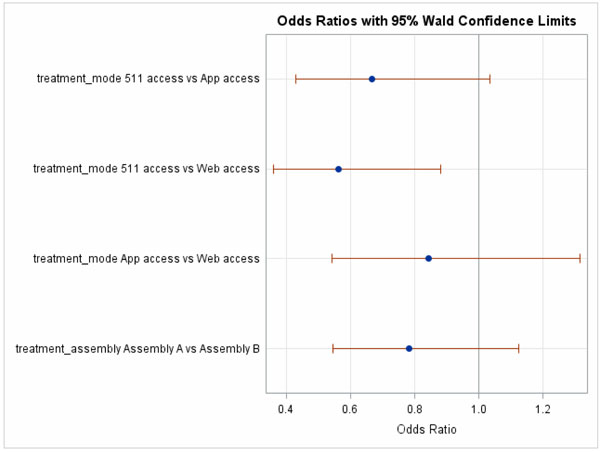
Figure 38. Chart. Odds ratios with 95 percent confidence limits – TTR ratings: ease of understanding.
Statement 2: Information from the Transportation Study Resource was reliable.
Although there were more participants agreeing with the statement than disagreeing with it, the relative percentage of participants agreeing with the reliability statement was lower than those agreeing with the ease of understanding statement (Statement 1). The Agree response was the mode, or most frequently selected response, regardless of the Lexicon and information channel (see Figure 39).
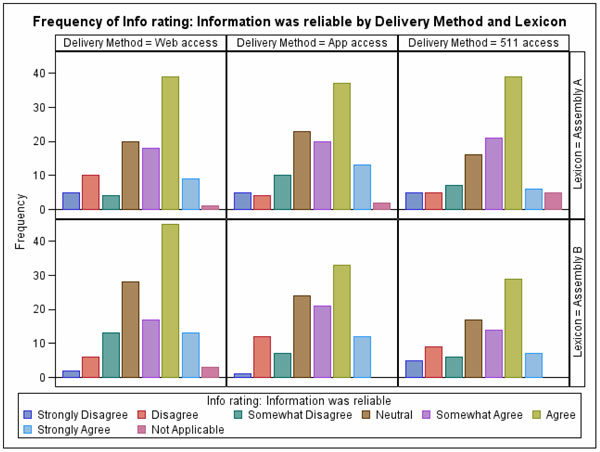
Figure 39. Chart. Frequency of agreement that the transportation study resource was reliable.
Table 51 shows the model results, with Education (Graduate/Professional degree agreement was lower than for no college) and Phase2_Count (more weekly trips equating to lower satisfaction with reliability) being the significant covariates.
The odds ratios results showed no significant impacts of Lexicon and information channel on agreement of this statement (see Figure 40).
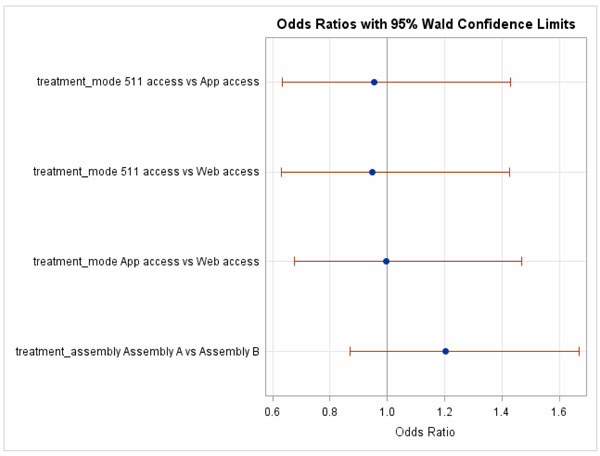
Figure 40. Chart. Odds ratios with 95 percent confidence limits – travel time reliability ratings: reliability.
Statement 3: The information from the Transportation Study Resource did NOT reduce the amount of travel time I plan for my trips.
A plurality of participants agreed that the TTR information did not reduce the amount of travel time they planned. Participants who were assigned to access to 511 tended to have a higher agreement level than other participants (see Figure 41).
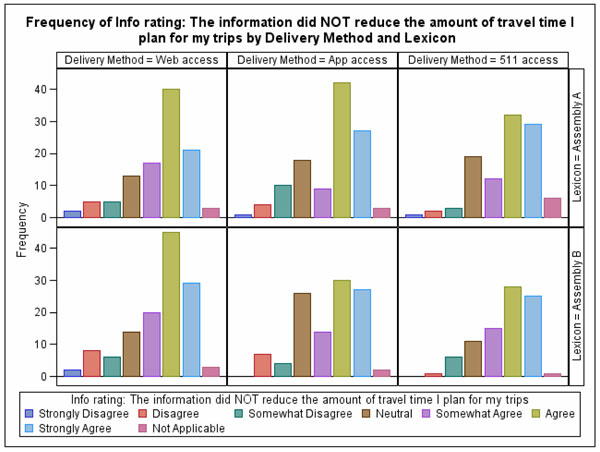
Figure 41. Chart. Frequency of agreement that the travel time reliability information did not reduce planned travel time.
The modeling of this question was slightly different than other TTR rating questions. The probability of participants reporting a LOWER level of agreement was modeled. Table 52 shows the model results, with Education (Graduate/Professional degree agreement was higher than for no college), and Phase2_Count (more weekly trips equating to lower agreement) being the significant covariates.
The odds ratios indicate that the likelihood of participants with 511 access disagreeing with the statement was significantly lower than App access participants, by a factor of 0.62 (see Figure 42). In other words, the 511 access participants were more accepting of the statement that the TTR information does not change their planned travel time, whereas the App access participants were apparently more open to changing their planned travel time as a result of the TTR information. The differences between 511 access and Web access, and between Web access and App access, were not significant. In addition, there was no significant impact of Lexicon on the agreement.
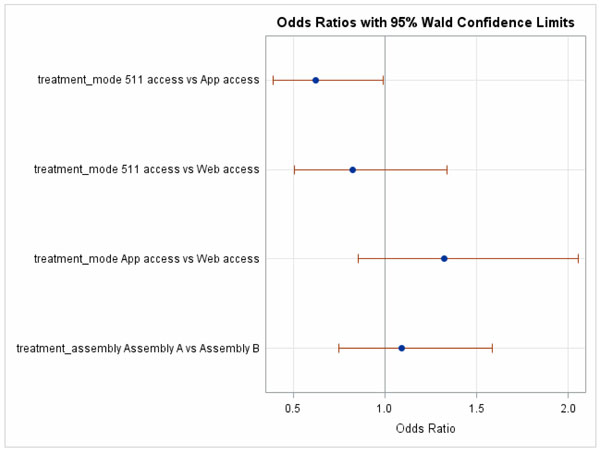
Figure 42. Chart. Odds ratios with 95 percent confidence limits – travel time reliability ratings: did not reduce planned travel time.
Statement 4: Overall, the information I received from the Transportation Study Resource was useful.
Compared with previous statements, there was much more participant disagreement with Statement 4, although the percentage of participants in agreement was still a majority (see Figure 43).
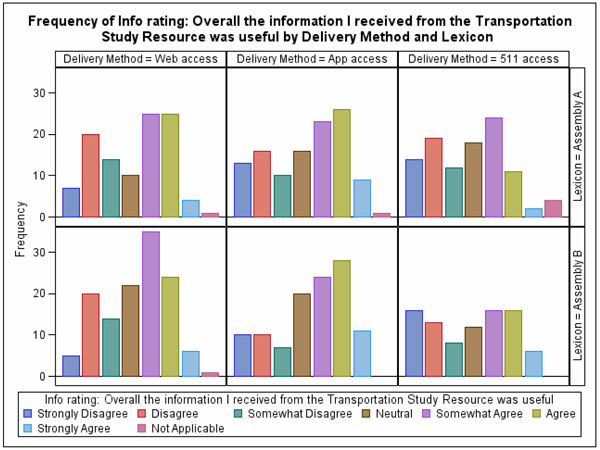
Figure 43. Chart. Frequency of agreement that the transportation study resource was useful.
The probability of participants reporting a higher level of agreement was modeled. Table 53 shows the model results, with Education (collegiate education showing lower agreement), Employment (full time employed showing higher agreement than all others), and Phase2_Count (more weekly trips equating to lower agreement) being the significant covariates.
The odds ratios indicate that the likelihood of participants with 511 access agreeing with the statement was significantly lower than App and Web access participants, by a factor of 0.52 and 0.59, respectively (see Figure 44). The differences between Web access and App access were not significant. In addition, there is no significant impact of Lexicon on the agreement.
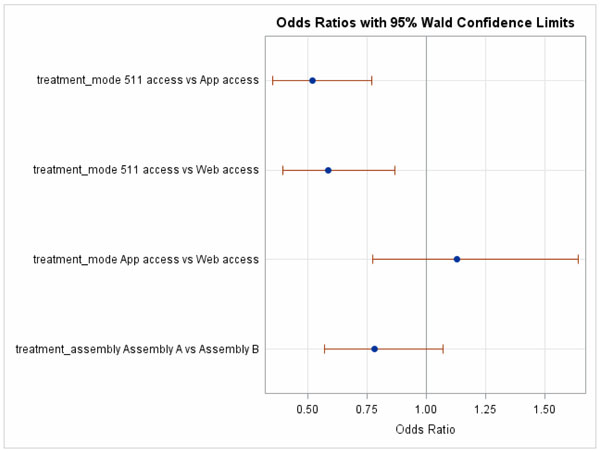
Figure 44. Chart. Odds ratios with 95 percent confidence limits – travel time reliability ratings: information useful.
Statement 5: In general, information from the Transportation Study Resource helped me reduce my travel time.
Unlike other statements, more participants disagreed with this statement than agreed with it (see Figure 45). Variations also can be observed by Lexicon and information channel.
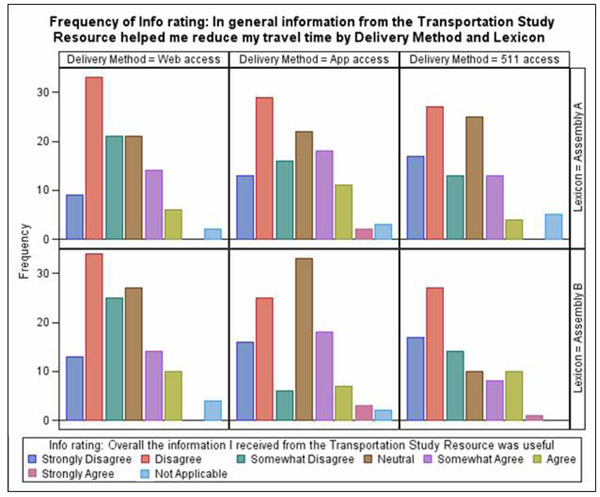
Figure 45. Chart. Frequency of agreement that the transportation study resource helped to reduce travel time.
The probability of participants reporting a higher level of agreement was modeled. Table 54 shows the model results, with Education (collegiate education showing lower agreement), and Phase2_Count (more weekly trips equating to lower agreement) being the significant covariates.
The odds ratios indicate that the likelihood of participants with 511 access agreeing with the statement was significantly lower than App access participants, by a factor of 0.61 (see Figure 46). Participants with App access were 1.51 times more likely to agree with the statement than participants with Web access. The difference between 511 access and Web access was not significant. In addition, there was no significant impact of Lexicon on the agreement.
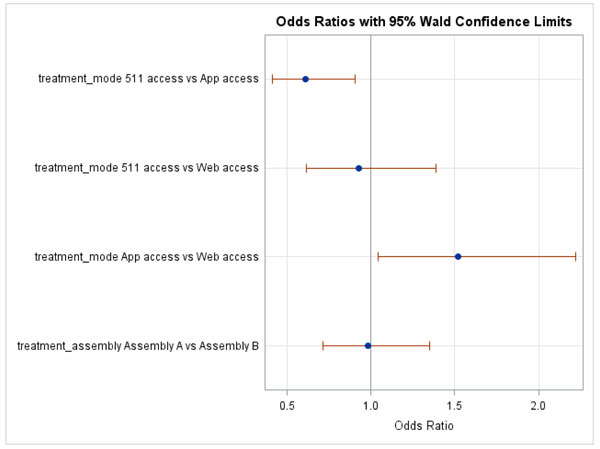
Figure 46. Chart. Odds ratios with 95 percent confidence limits – travel time reliability ratings: information helped reduce travel time.
Statement 6: In general, information from the Transportation Study Resource helped me avoid congestion.
Participants strongly rejected the notion that TTR information could help them avoid congestion, as can be seen in Figure 47.
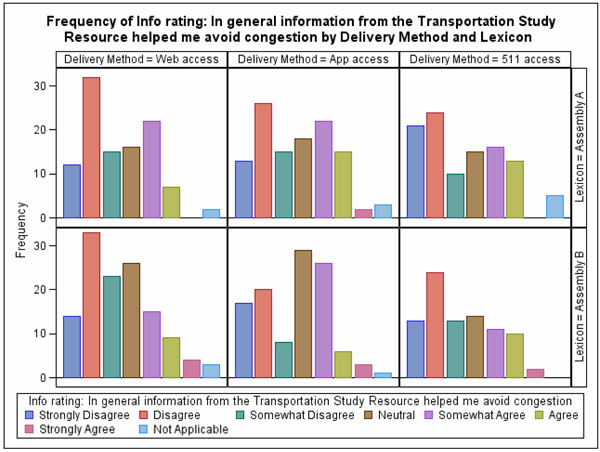
Figure 47. Chart. Frequency of agreement that the transportation study resource helped to avoid congestion.
The probability of participants reporting a higher level of agreement was modeled. Table 55 shows the model results, with Peak_Hour (more peak hour trips equated with less agreement) being the significant covariate.
The odds ratios indicate that the likelihood of participants with App access agreeing with the statement was significantly higher than Web access participants, by a factor of 1.46 (see Figure 48). The differences between 511 access and Web access, and between 511 access and App access were not significant. In addition, there was no significant impact of Lexicon on the agreement.
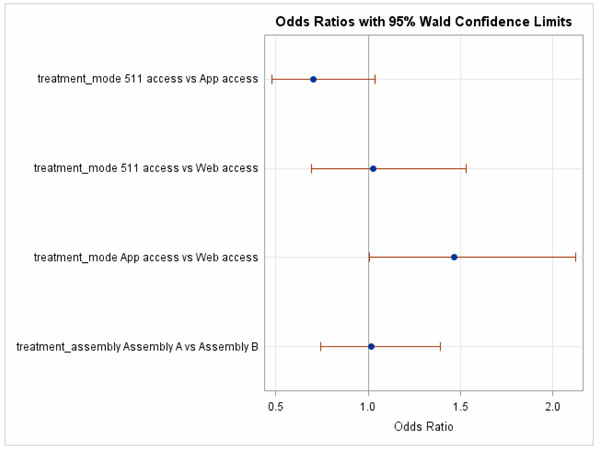
Figure 48. Chart. Model results – travel time reliability ratings: helped to avoid congestion.
Statement 7: Information from the Transportation Study Resource reduced the stress of my trip.
Participants tended to reject that TTR information could help them reduce the stress of their trip, as can be seen in Figure 49.
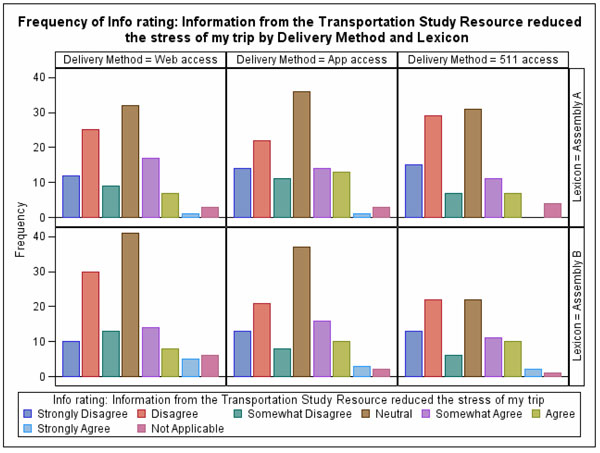
Figure 49. Chart. Frequency of agreement that the transportation study resource helped to reduce stress.
The probability of participants reporting a higher level of agreement was modeled. Table 56 shows the model results, with Education (college degrees associated with greater disagreement), Peak_Hour (higher peak hour travel associated with greater disagreement), and Phase2_Count (more weekly trips associated with greater disagreement) being the significant covariates.
The odds ratios showed that the assigned Lexicon and information channel did not have a significant impact on the agreement level to this statement (see Figure 50).
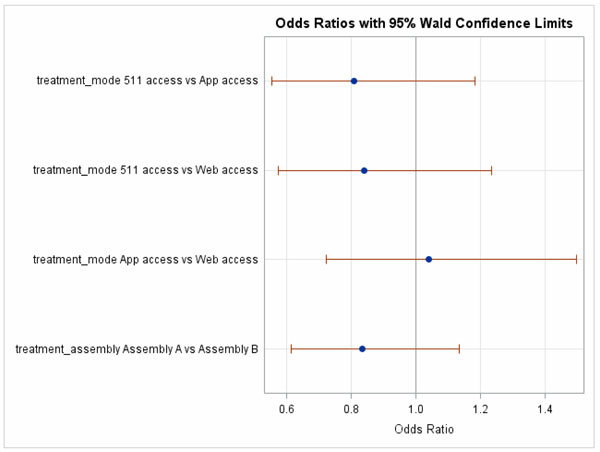
Figure 50. Chart. Odds ratios with 95 percent confidence limits – travel time reliability ratings: helped to reduce stress.
Statement 8: Information from the Transportation Study Resource helped me plan my trips.
Participants provided very mixed responses to the assertion that TTR information helped them to plan their trips. There were strong peaks in the responses Disagree, Neutral, and Somewhat Agree (see Figure 51).
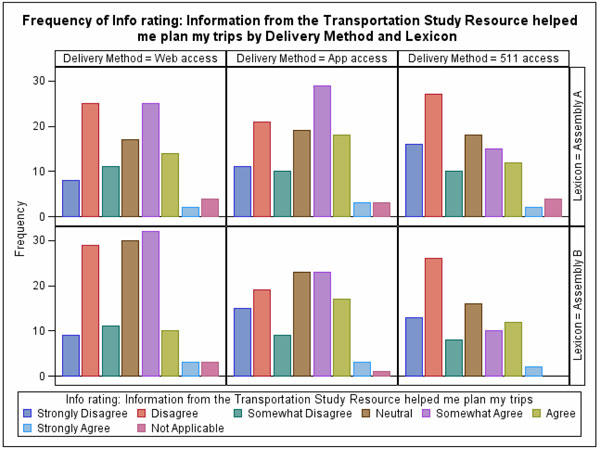
Figure 51. Chart. Frequency of agreement that the transportation study resource helped me to plan trips.
The probability of participants reporting a higher level of agreement was modeled. Table 57 shows the model results, with Education (Bachelor's degree participants showing less agreement than those without a college degree), Employment (full time employed showing greater agreement than others), Peak_Hour (higher peak hour travel associated with greater disagreement), and Phase2_Count (more weekly trips associated with greater disagreement) being the significant covariates.
The odds ratios indicate that the likelihood of participants with 511 access agreeing with the statement was significantly lower than App access participants and Web access participants, by a factor of 0.55 and 0.60, respectively (see Figure 52). The difference between Web access and App access was not significant. In addition, there was no significant impact of Lexicon on the agreement.
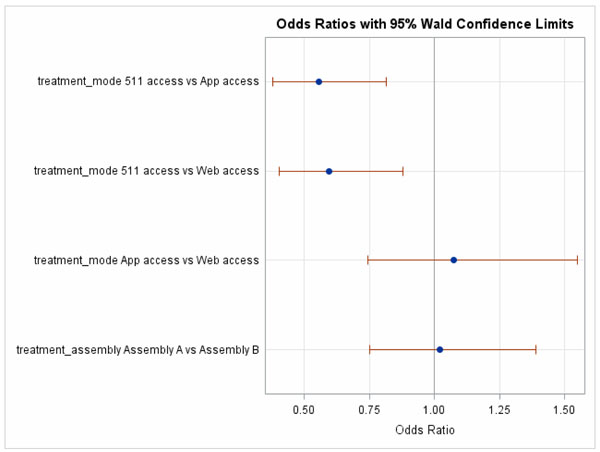
Figure 52. Chart. Odds ratios with 95 percent confidence limits – travel time reliability ratings: helped me to plan trips.
Model Results – Traveler Satisfaction
Participants were asked about their satisfaction level in five aspects of trip experience.
Satisfaction: Estimated/Approximate Travel Time
Figure 53 shows that more participants were satisfied than not with the estimated travel time from all of the TTR resources. There was no significant difference by Lexicon.
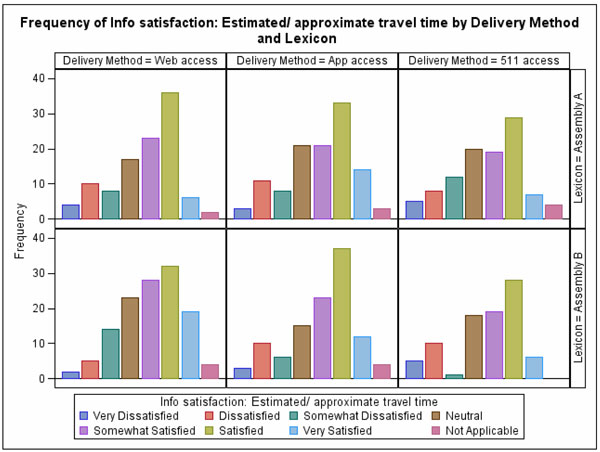
Figure 53. Chart. Frequency of satisfaction with the estimated travel time.
Ordinal logistic regression was applied to quantify the impacts of Lexicon and information channel on participants' satisfaction with their trip experience and to account for exogenous factors regarding demographic and trip characteristics. The Not Applicable response was excluded from the modeling. The seven remaining category responses were aggregated into three larger groups: Dissatisfied (Very Dissatisfied, Dissatisfied, and Somewhat Dissatisfied), Neutral, and Satisfied (Somewhat Satisfied, Satisfied, and Very Satisfied). The probability of participants reporting a higher level of satisfaction was modeled. Table 58 shows the model results, with Location (Columbus satisfaction significantly higher than Houston and Triangle) being the only significant covariate.
No significant differences were found in the odds ratios between Lexicons and information channels (see Figure 54).
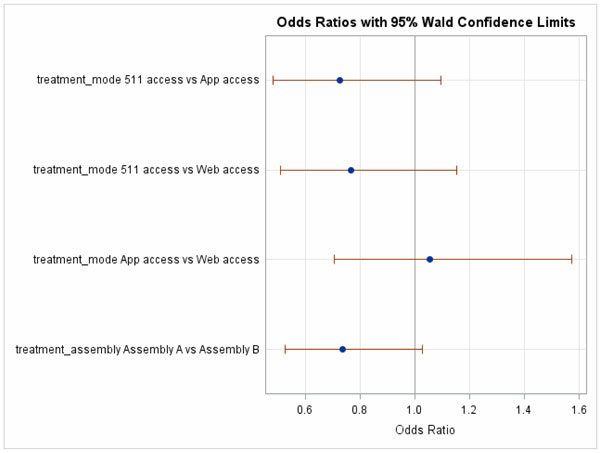
Figure 54. Chart. Odds ratios with 95 percent confidence limits – satisfaction with estimated travel time.
Satisfaction: Extra time / recommended cushion
As seen in Figure 55, participants held a largely neutral attitude toward the extra time / recommended cushion from TTR information. There were more satisfied participants than dissatisfied participants.
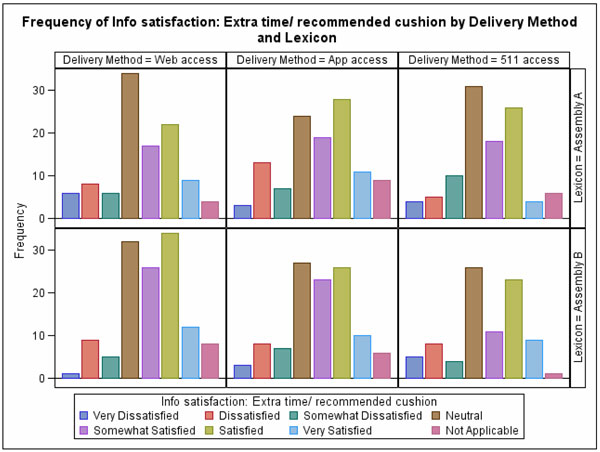
Figure 55. Chart. Frequency of satisfaction with the extra time/recommended cushion.
The probability of participants reporting a higher level of satisfaction was modeled. Table 59 shows the model results, with no significant covariates.
No significant differences were found in the odds ratios between Lexicons and information channels (see Figure 56).
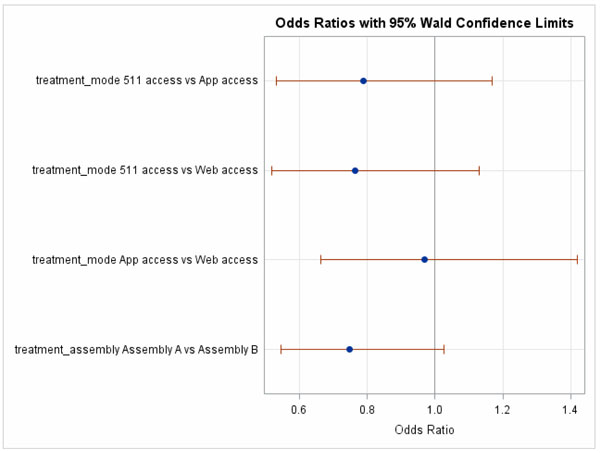
Figure 56. Chart. Odds ratios with 95 percent confidence limits – satisfaction: extra time/recommended cushion.
Satisfaction: Recommended/Suggested Departure Time
Figure 57 shows that more participants were satisfied with the recommended departure time by TTR information than dissatisfied with it. The most frequent (mode) response was Neutral.
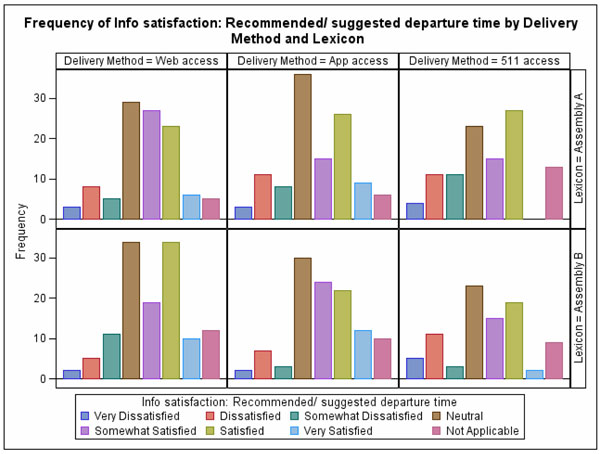
Figure 57. Chart. Frequency of satisfaction with the recommended departure time.
The probability of participants reporting a higher level of satisfaction was modeled. Table 60 shows the model results, with Peak_Hour (lower satisfaction for those with more peak hour trips) being the significant covariate.
The odds ratios indicate that the likelihood of participants with 511 access being satisfied with the recommended departure time was significantly lower than Web access participants, by a factor of 0.60 (see Figure 58). The differences between 511 access and App access, and between Web access and App access were not significant. In addition, there was no significant impact of Lexicon on the agreement.
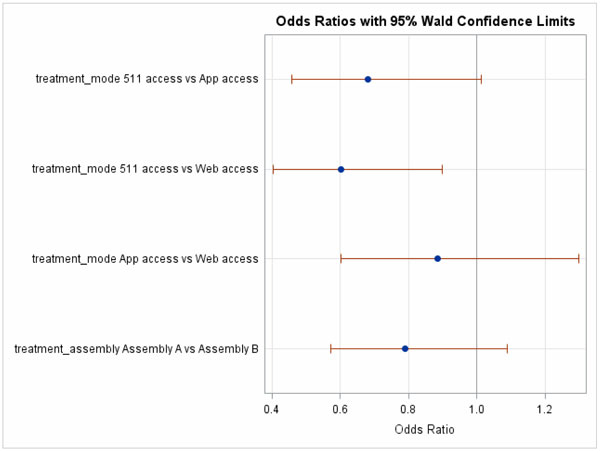
Figure 58. Chart. Odds ratios with 95 percent confidence limits – satisfaction with recommended departure time.
Satisfaction: Total Travel Time Estimate for Most/Majority of the Time
The most common (mode) response was Satisfied. More participants were satisfied with the total travel time estimated by the TTR information than dissatisfied (see Figure 59).
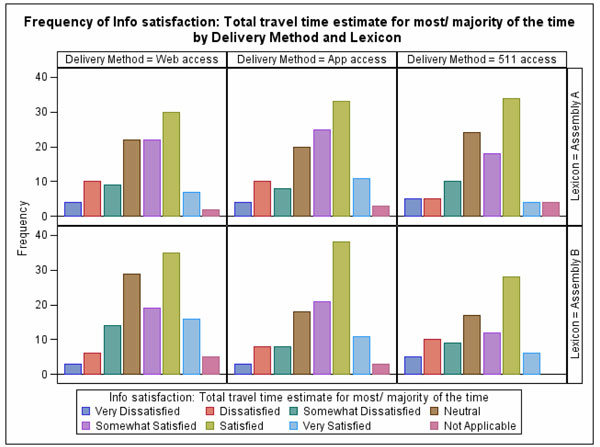
Figure 59. Chart. Frequency of satisfaction with total travel time.
The probability of participants reporting a higher level of satisfaction was modeled. Table 61 shows the model results, with no significant covariates.
No significant differences were found in the odds ratios between Lexicons and information channels (see Figure 60).
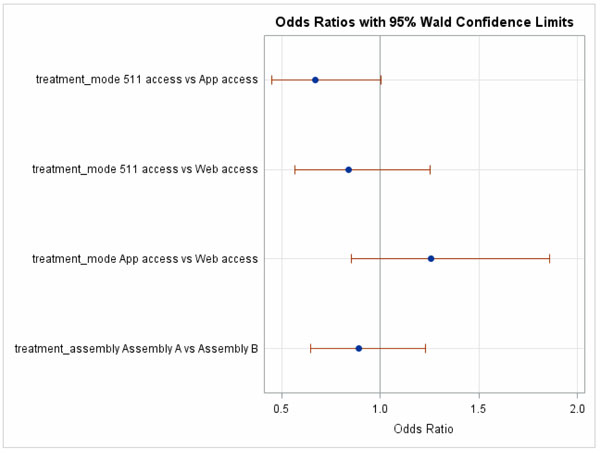
Figure 60. Chart. Odds ratios with 95 percent confidence limits – satisfaction with total travel time.
Satisfaction: Trips while Using the Transportation Study Resource
The most common (mode) response was Satisfied. More participants were satisfied with trips using the TTR information than dissatisfied (see Figure 61).
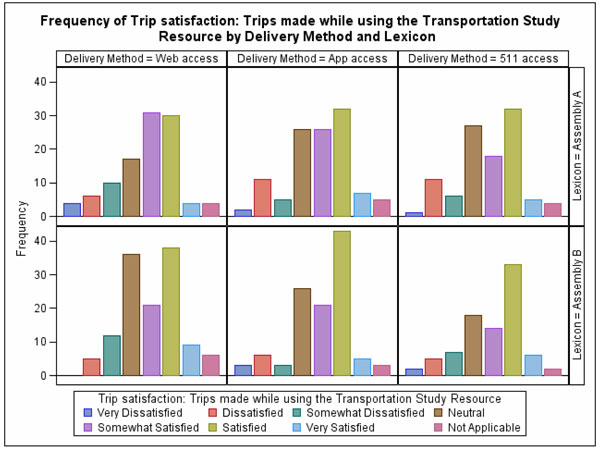
Figure 61. Chart. Frequency of satisfaction on the trips made with the transportation study resource.
The probability of participants reporting a higher level of satisfaction was modeled. Table 62 shows the model results, with Location (Houston satisfaction lagging that of Columbus and Triangle), Education (graduate degree participant satisfaction below those without a degree), Age (65 or older participants less satisfied than those under 25), Average_Distance (longer distance travelers less satisfied), and Peak_Hour (more frequent peak hour travelers less satisfied) being the significant covariates.
No significant differences were found in the odds ratios between Lexicons and information channels (see Figure 62).
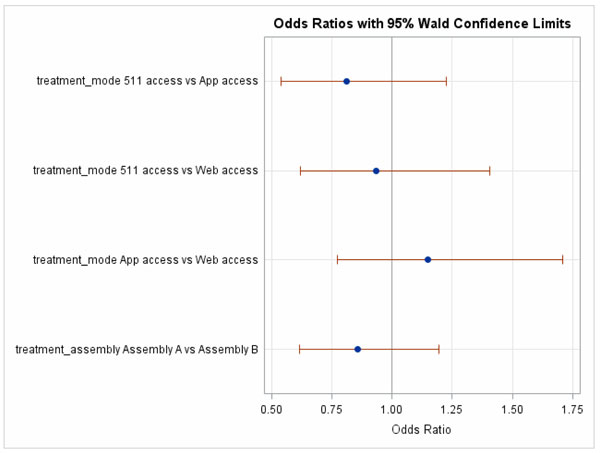
Figure 62. Chart. Odds ratios with 95 percent confidence limits – satisfaction with transportation study resource trips.
Other Results
Why Travel Time Reliability Information was Never Used during the Study.
For those participants who reported that they never used TTR information for both familiar and unfamiliar trips, the exit survey also asked them to provide the reason. Figure 63 summarizes their responses. As shown in the figure, the most common reason was that they traveled in familiar conditions, followed by that they already used other information.
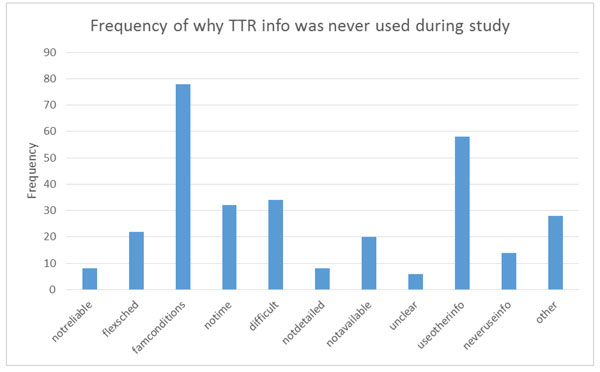
Figure 63. Chart. Why travel time reliability information was never used?
Compared to information from the other traveler information resources, how much impact did information from the Transportation Study Resource have on your travel plans?
As shown in Figure 64, more participants considered the TTR information had less impact on their travel plans than those who felt the impact was about the same or more than other information resources. No significant difference caused by Lexicon or information channel was observed.
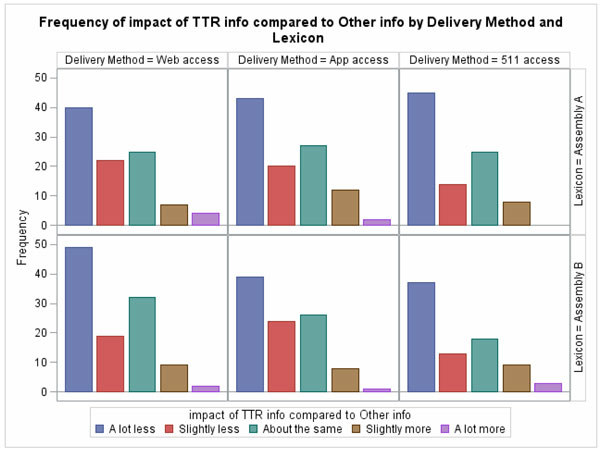
Figure 64. Chart. Impact of travel time reliability information compared to other resources.
Compared to information from the other traveler information resources, how useful was the information from the Transportation Study Resource for you?
As shown in Figure 65, more participants considered the TTR information to be less useful than those who felt the usefulness was about the same or more than other information resources. No significant difference caused by Lexicon or information channel was observed.
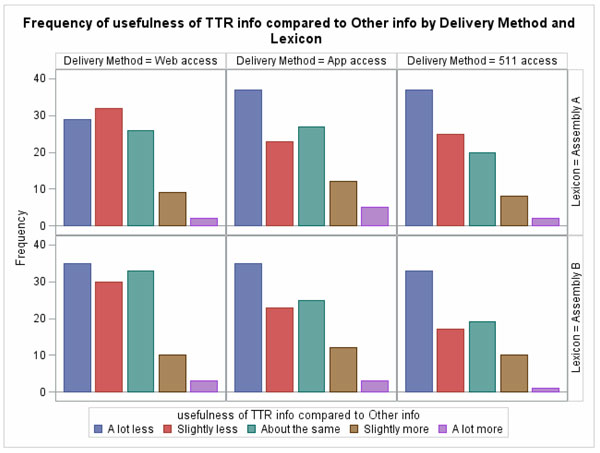
Figure 65. Chart. Usefulness of travel time reliability information compared to other resources.