Transportation Systems Management and Operations and Performance Based Practical Design Case Study 4: Demonstrating Performance-Based Practical Design through Regional Performance-Based Planning
Printable Version [PDF, 1.5 MB]
U.S. Department of Transportation Publication #: FHWA HOP-16-038 August 2016 Purpose of the Transportation Systems Management and Operations Performance-Based Practical Design Case Study Series and Summary of Case Study 4As states and local agencies become increasingly challenged with addressing their system performance, mobility, and safety needs in the current era of financial limitations, Federal Highway Administration (FHWA) is providing guidance, delivering technical assistance, and sharing resources related to performance-based practical design (PBPD; source: FHWA). The FHWA Office of Operations is supporting the overall Agency PBPD effort by highlighting the role transportation systems management and operations (TSMO) alternatives and analysis tools can play in supporting PBPD. To illustrate the range of TSMO strategies and tools and how they can be applied by transportation planners and designers in a PBPD context, five case studies have been developed. This Case Study 4 illustrates how PBDP and performance-based planning and programming (PBPP) approaches can be used by metropolitan planning organizations (MPOs) during the planning process to inform the selection of projects for the transportation improvement program (TIP). Other case studies in this series include the high-occupancy toll (HOT) lane implementation, urban freeway reconstruction, use of alternative intersections on arterials, and PBPD during active traffic management (ATM) design and implementation. Performance-Based ApproachesPerformance-Based Practical DesignPBPD encourages the evaluation of the performance impacts of highway design decisions relative to the cost of providing various design features. PBPD can be articulated as modifying a traditional design approach from a "top-down," standards-first approach to a "design-up" approach where transportation decision-makers exercise engineering judgment to build upon the improvements from existing conditions to meet both project and system objectives. PBPD uses appropriate performance-analysis tools and considers both short- and long-term project and system goals while addressing project purpose and need. Following a PBPD approach can make using scarce resources more efficient so that more improvements can be made and the overall transportation system performance exceeds the performance that would have otherwise been achieved if the focus was on individual project-based (as opposed to systems based) decisions. Following are notable PBPD attributes:
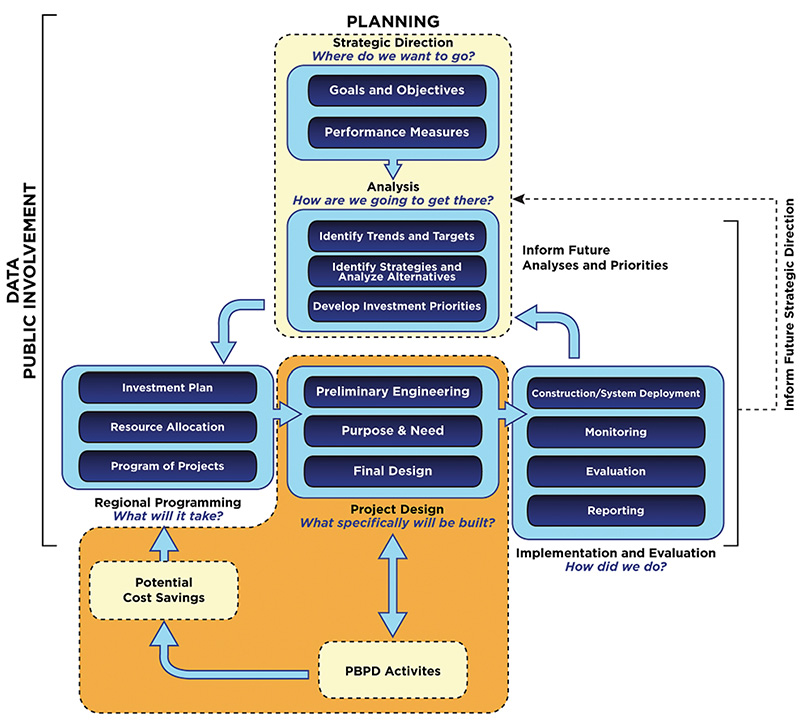
Figure 1. Graphic. Performance-Based Process Performance-Based Planning and Programming and Linkage to Performance-Based Practical DesignPBPP, like PBPD, uses performance management as it is applied to decision-making and system performance (source: FHWA). However, PBPP is a broader strategy than PBPD that encompasses planning (strategic direction), analysis, programming, design (if applicable), and implementation/ evaluation of transportation projects in a region. PBPD is focused on system needs and objectives and how well specific projects support the defined objectives. PBPP includes selecting goals and objectives at a regional level that are incorporated into the region's transportation plan and program. Figure 1 shows the PBPP framework and its relationship to PBPD. PBPD decision-making, shown in the orange portion of the figure, is concentrated at a project's design phase, with decisions being informed by performance measures and investment priorities previously chosen by a PBPP approach. Corridor and Systems Needs and ObjectivesPBPD strengthens the emphasis on planning-level corridor or system performance needs and objectives when planning, scoping and developing individual projects.In metropolitan areas, planning and project selection often begins at the MPO level, and the concept of PBPD should be integrated with MPO planning activities. For example, to provide meaningful improvements to a congested arterial, comprehensively analyzing and improving a long segment rather than short portions is often necessary. Undertaking spot improvements and other projects that only target the localized issues lead to marginally effective solutions for corridors as a whole. Spot improvements may transfer bottlenecks to other locations and have a minimal net improvement. A PBPD scope includes assessing localized issues and corridor-wide issues of a more regional nature. At the planning level, this balance is essential. The San Diego Association of Governments' (SANDAG) 2050 Regional Transportation Plan (RTP) emphasizes system preservation in its project performance evaluations, comparing the anticipated effects of individual projects to regional goals. The performance measures used for the RTP include vehicle injury and fatal crash rates, pedestrian and bicycle injury and fatal crash rates, percent of funding spent on maintenance and rehabilitation, and percent of funding spent on operations. Figure 2 illustrates four of the system performance measures and their estimated values under existing; 2050 no build; and revenue constrained in 2020, 2035, and 2050 conditions. Performance ImprovementsPBPD focuses on performance improvements that benefit both project and system needs.PBPD makes the best use of limited available financial resources. Projects are scoped to meet purpose and need and improve performance over the existing condition while considering the cost-effectiveness of choosing various design criteria. Many agencies have historically used a handful of treatments and alternatives to address operational and safety needs. For example, if a signalized intersection is at capacity, then lanes may be added. If the intersection has as many lanes as it can reasonably contain, then it may be grade separated. PBPD encourages innovative and site-specific solutions that meet site- specific needs rather than "one size fits all" solutions. 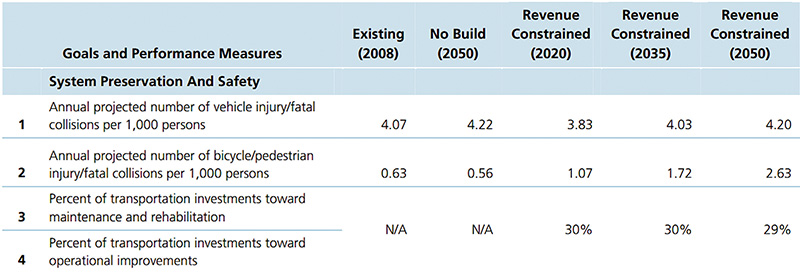
Figure 2. Graphic. San Diego Association of Governments' 2050 Regional Transportation Plan Comparison of Regional Performance Measures The Genesee Transportation Council (GTC) Long-Range Transportation Plan (LRTP) 2035 includes performance measures, current values for performance measures, desired future trend (increase or decrease) based on the goals and objectives, and a likely future trend based on what can realistically be accomplished. GTC is the MPO for the Rochester, New York, region. Recognizing that each individual project contributes to reaching the established goals, the LRTP seeks to maximize limited funds by calling for projects that meet performance measures for specific study corridors and also the surrounding system. The GTC specifically picked performance measures that were based on readily available data that can be collected on an ongoing basis by GTC staff, member agencies, or New York State government. This allows GTC to monitor the effectiveness of their plan on an ongoing basis, not just when it is being updated. The Delaware Valley Regional Planning Commission (DVRPC), which is the MPO for the greater Philadelphia region, has used regional indicators to conduct performance monitoring since 1998. Specific performance measures are selected based upon how well they conform to the following criteria:
DVRPC's 2035 plan has 33 indicators that conform to the criteria above and track how well the region is achieving its goals. Indicators are grouped into four categories—transportation, economic, community, and environment—and a current assessment is displayed graphically in a "dashboard" format on DVRPC's website. The transportation indicators are shown in Figure 3. More specific data for each indicator are available on DVRPC's website. For example, the indicator for "Are Roads Better Maintained" is the lane miles of deficient pavement. Performance AnalysisAgencies make sound decisions based upon performance analysis.The Metropolitan Transportation Commission (MTC), the MPO for the San Francisco Bay area, evaluates proposed, transportation projects with a benefit-cost ratio to help determine which proposed projects are included in the LRTP. For each proposed project, the LRTP presents a single number (the benefit-cost ratio), as well as numerous specific performance measures (for example, travel time in millions of hours, number of crashes, tons of pollutants emitted). The benefit-cost ratio is a key factor in determining whether a proposed project is added to the LRTP, although proposed projects with poor benefit-cost ratios may be included in the LRTP if a project's sponsor makes a compelling case for them. In addition to a benefit-cost ratio, MTC also computes a targets score for each performance measure. This assesses how well specific projects address plan targets for a pure performance view, regardless of their cost effectiveness. Figure 4 shows the benefit-cost ratio for project categories in MTC's plan, total estimated annual benefits, project mode-type, and the number of plan goals that the projects address. 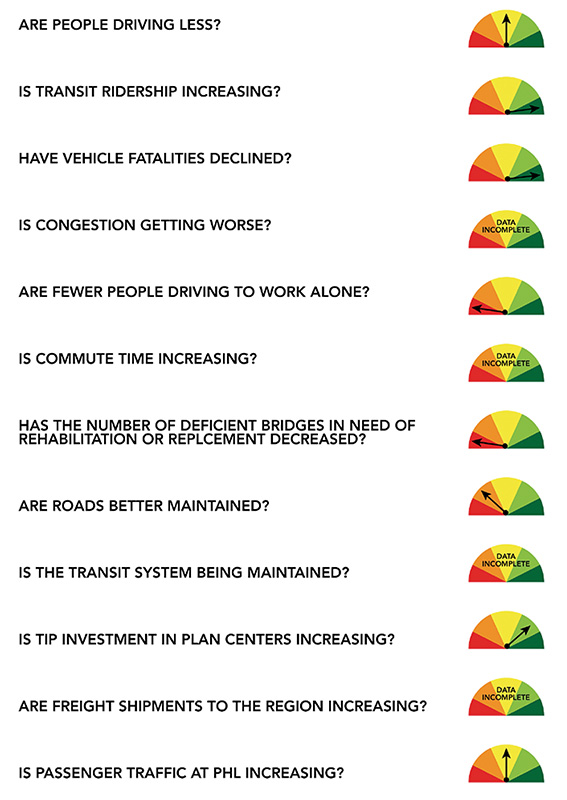
Figure 3. Graphic. Status of Delaware Valley Regional Planning Commission Transportation Indicators The Ohio-Kentucky-Indiana Regional Council of Governments (OKI), the MPO for the Cincinnati, Ohio, area, maintains the advanced regional traffic interactive management and information system (ARTIMIS). OKI began planning for this system in the late 1980s and began implementing it in the early 1990s. In the early 2000s, the system monitored the main interstates passing through Cincinnati, but lacked coverage of most of Cincinnati's beltway and several commuter freeways. OKI computed benefit-cost ratios of expanding ARTIMIS's coverage to nearly all freeways in the metropolitan area and widening selected freeways. Expanding ARTIMIS was found to have a greater benefit-cost ratio, and this analysis contributed to the decision to expand ARTIMIS coverage in 2001. 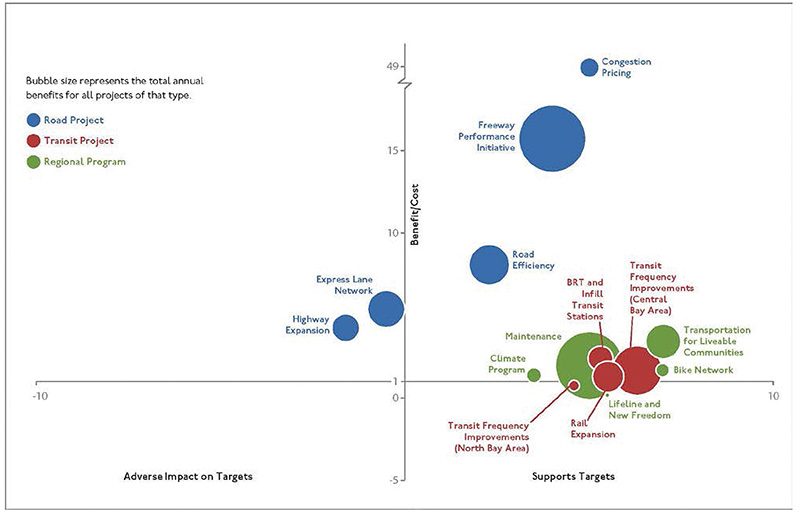
Figure 4. Graphic. Project Performance Assessment: Results by Type ContactsGeorge Merritt
Jim Hunt
Robert Mooney
|
|
United States Department of Transportation - Federal Highway Administration |
||