CHAPTER 3. CHANGES IN PERFORMANCE MEASURESThis chapter describes the changes to the performance measures reported in 2012. These changes are necessary to address gaps in performance measurement due to current program objectives and activities and recent advances in capability and technology for road weather management. Gaps In Performance MeasurementBased on the current inventory of program activities, the team identified gaps in the previous performance measurement framework. Some of these gaps are described below. Extent of Use and Adoption of Mobile Data-based ApplicationsSince the previous update, the Road Weather Management Program (RWMP), as part of the Connected Vehicle Research track, has been supporting the development of Vehicle to Infrastructure (V2I) applications that leverage mobile data and vehicle to infrastructure connectivity to support road weather management. Currently, the RWMP is supporting several development efforts for V2I applications including the Motorist Advisories and Warnings (MAW), Spot Weather Impact Warning (SWIW) applications for commercial vehicles, Enhanced Maintenance Decision Support Systems application (EMDSS). The WRTM program is also supporting several applications that use mobile data and remote connectivity in Wyoming, South Dakota, and Michigan. The aforementioned V2I applications are in research phases, and agencies' involvements in these efforts are captured through the research and development (R&D) performance measure. However, a gap remains in understanding how V2I and mobile data are being used by the States. Climate Change/Extreme Weather/ResilienceThe stakeholder community has expressed a great interest in managing extreme weather and improving the resiliency of operations, and the program has supported various stakeholder engagement activities on this topic through the American Association of State Highway and Transportation Officials (AASHTO) and Transportation Research Board (TRB). Currently, the program has not identified performance measures that effectively assess growth in this area at the State departments of transportation (DOT) and local levels. Research and guidance development is ongoing in this area but is still in early stages. Section 1201 Rule ComplianceIn 2015, State DOTs began reporting road condition data in compliance with the Section 1201 rule for appropriate areas and segments. While the rule does not specify how compliance should be achieved or the methods to report data, monitoring the self-reported rate of compliance with the rule requirements is a good measure to track timeliness of road condition availability in the nation. Meteorological Assimilation Data Ingest System TransitionWith the sunset of the Clarus program, the RWMP has been supporting the transition of the fixed and mobile Environmental Sensor Stations (ESS) data maintained by State DOTs to Meteorological Assimilation Data Ingest System (MADIS). The program is supporting the signing of data sharing agreements between State DOTs and National Oceanic and Atmospheric Administration (NOAA) and the integration of Clarus quality-checking algorithms into MADIS. To ensure the broad national scope of Clarus is transitioned, it is important for the program to track how many States are now connected to MADIS. Expanding PartnershipsStarting with primarily the maintenance groups within State DOTs and a select group of weather/meteorological experts, the program has expanded its reach over the past decade to operations, technology, private sector, and the broader weather enterprise. While participation in stakeholder meetings is tracked, there is no performance measure that tracks the growth in partnerships as evidenced by the new groups involved in road weather management. For example, representatives from universities, private sector information service providers (e.g., Inrix, Waze), and connected vehicle experts have participated in recent stakeholder meetings. Mainstreaming of Road Weather Management ProgramsThroughout the past decade, an emphasis of the program has been to mainstream road weather management as a core function of State DOTs. Supporting this desire is the recent engagement in the institutional capability maturity framework development and deployment for road weather management. Performance Measurement/Continuous Improvement of Road Weather Management ProgramsThe role of performance measurement continues to grow through both Federal and State initiatives. The Moving Ahead for Progress in the 21st Century Act (MAP-21) requires a greater consideration of performance in transportation investments, and States are looking at ways to maximize the return on investment of their limited resources. Higher traveler expectations are also fueling the increased use of performance measures to gauge agency performance. Currently, there are no measures that document the extent of use in collecting and reporting performance measures by the State DOTs. Updated Performance Measures for 2015Table 8 lists the measures that were identified as candidates for inclusion in the 2015 performance measures update. A total of 27 measures are tracked. Seven new measures have been added since the last update in 2012. One measure has been deleted, and the wording/definitions of four measures have been revised. With the exception of Objective 4, there are multiple performance measures associated with all objectives of the program. New measures are highlighted in bold within the table.
DOT – department of transportation
ESS – environmental sensor station MADIS – Meteorological Assimilation Data Ingest System MDSS – maintenance decision support systems PM – performance measure R&D – research and development ROI – return on investment RWM – road weather management RWMP – road weather management program Quantifying MeasuresEach of the 27 measures was quantified during this update using a variety of data sources. Conducting the performance measure update requires collecting data available in 2015 from multiple sources on the specific RWMP activities and the broader impact of road weather management efforts.(9) There are four main sources that provide data for the RWMP performance measures:
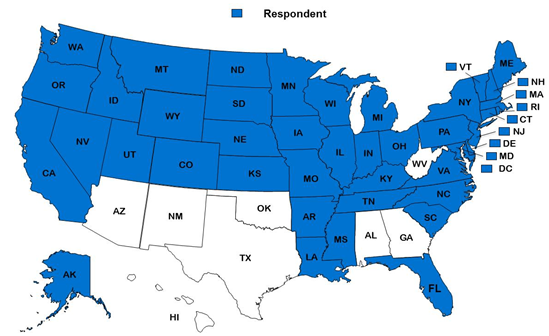 Figure 2. Chart. Map of the 2015 State Survey Respondents (shown in blue).
Assumptions, Challenges, and ConstraintsThe performance measures are crafted to reflect the changes to the current program and broader road weather management context, yet limitations arise particularly relating to data availability and the ability to isolate independent impacts. The following assumptions and limitations should be noted:
Performance ResultsThe following sections provide results for each of the twenty-seven measures organized by the eight objectives. A short summary across the objective is also provided. 9 The data request period is 2013-2015, except in cases where data were not available for 2011-2012 during the last performance measure update, in which case older data will also be collected. [ Return to note 9. ] | ||||||||||||||||||||||||
|
United States Department of Transportation - Federal Highway Administration |
||