APPENDIX B. STATE DEPARTMENT OF TRANSPORTATION SURVEY SUMMARY
The following pages show the State DOT survey questions and summary.
Table 23. State Department of Transportation Survey Question 4 and Associated Responses.
Q4. What are your agency's sources of weather and road weather information?
Associated PM: Number of State DOTs that subscribe to road weather products and services.
| Answer Options |
Response Percent |
Response Count |
| USGS Earthquake alerts |
0.0% |
0 |
| Not Sure/Unknown |
0.0% |
0 |
| Other |
15.4% |
6 |
| National Sensor Data Sources (MADIS) |
20.5% |
8 |
| FAA (ASOS, AWOS) |
35.9% |
14 |
| Public/Social Media |
41.0% |
16 |
| Private Weather Service Providers |
71.8% |
28 |
| Agency field personnel |
79.5% |
31 |
| Agency sensors (RWIS/Probes) |
92.3% |
36 |
| National Weather Service Products |
100.0% |
39 |
Answered Question: 39
Skipped Question: 1
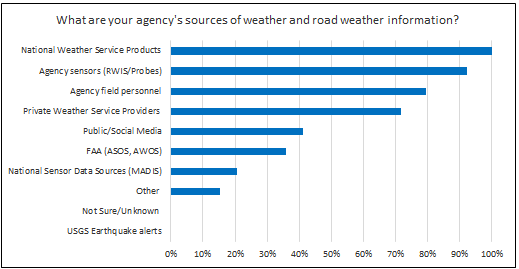 Figure 23. Chart. Responses from State Department of Transportation Survey Question 4.
Other responses to Question 4 included:
- MDSS;
- DOT/Highway;
- Mobile weather sensors (air temp, road temp, Relative Humidity, dew point, etc.);
- PFS MDSS;
- Internet websites and applications; and
- The Lyndon State College Meteorological Department.
Table 24. State Department of Transportation Survey Question 5 and Associated Responses.
Q5. Does your agency collect real-time field data from maintenance vehicles?
Associated PM: Number of State DOTs collecting mobile observations of road weather data from appropriate vehicle fleets
| Answer Options |
Response Percent |
Response Count |
| Yes |
50.0% |
20 |
| No |
50.0% |
20 |
Answered Question: 40
Skipped Question: 0
Table 25. State Department of Transportation Survey Question 6 and Associated Responses.
Q6. If you answered "Yes" to question #5, which of the following data are collected from maintenance vehicles, and from what percentage of the applicable fleets?
Associated PM: Number of State DOTs collecting mobile observations of road weather data from appropriate vehicle fleets
| Answer Options |
100% |
At least 50% but less than 100% |
At least 25% but less than 50% |
Less than 25% |
Not Collected |
Not Sure/ Unknown |
| Plow Status and Material Usage |
3 |
5 |
2 |
7 |
2 |
1 |
| Atmospheric weather data (air temperature, relative humidity, etc.) |
2 |
5 |
1 |
8 |
3 |
1 |
| Road weather conditions data (pavement temperature, etc.) |
2 |
5 |
1 |
8 |
3 |
1 |
Answered Question: 20
Skipped Question: 0
Table 26. State Department of Transportation Survey Question 7 and Associated Responses.
Q7. Has your agency developed applications or tools that rely on availability of real-time mobile data from vehicle fleets and/or vehicle-to-infrastructure connectivity?
Associated PM: Number of/percentage of responding agencies using mobile data-based applications in road weather management
| Answer Options |
Percentage |
| Not Sure/Unknown |
15.0% |
| Developed applications that use both real-time data from vehicle fleets and vehicle-to-infrastructure connectivity |
5.0% |
| Developed applications that use real-time data from vehicle fleets |
22.5% |
| Considering applications in either area, but not yet developed |
57.5% |
Answered Question: 40
Skipped Question: 0
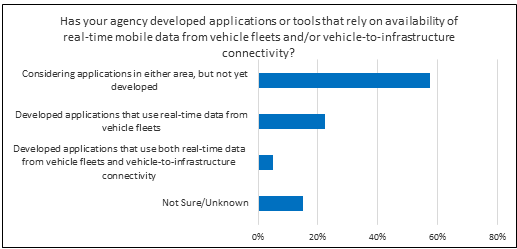 Figure 24. Chart. Responses from State Department of Transportation Survey Question 7.
Table 27. State Department of Transportation Survey Question 8 and Associated Responses.
Q8. How many environmental sensor stations (ESS) does your state agency operate statewide?
Associated PM: Number of State DOTs reporting the use of ESS in operations and maintenance activities
| Total number |
2,473 |
| Answered Question |
40 |
| Skipped Question |
0 |
Table 28. State Department of Transportation Survey Question 9 and Associated Responses.
Q9. Describe how you use your ESS (Check all that apply).
Associated PM: Number of State DOTs reporting the use of ESS in operations and maintenance activities
| Answer Options |
Percentage |
| Not Sure/Unknown |
5.3% |
| Other |
7.9% |
| Use ESS data as input for segment-level forecasts |
57.9% |
| Use ESS data to provide current conditions to traveler information systems |
60.5% |
| Use ESS data to support traffic management and maintenance decision-making |
94.7% |
Answered Question: 38
Skipped Question: 2
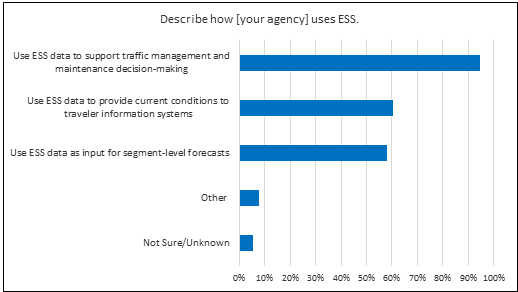 Figure 25. Chart. Responses from State Department of Transportation Survey Question 9.
Another response to Question 9 included "mobile."
Table 29. State Department of Transportation Survey Question 10 and Associated Responses.
Q10. Describe the level of deployment in your agency of the following road weather information strategies.
Associated PM: Number of States disseminating weather advisory and other road weather information to travelers
| Answer Options |
Deployed Statewide (or in all applicable locations) |
Limited or Partial Deployment |
Not Yet Deployed |
Not Sure/ Unknown |
| Atmospheric weather information on dynamic message signs |
10.0% |
25.0% |
55.0% |
10.0% |
| Road condition information on highway advisory radio |
27.5% |
27.5% |
35.0% |
10.0% |
| Road condition information on agency-hosted social media (Twitter, Facebook, etc.) or mobile applications |
55.0% |
22.5% |
15.0% |
7.5% |
| Road condition information on dynamic message signs |
45.0% |
42.5% |
12.5% |
0.0% |
| Road condition information on agency hosted websites or 511 phone systems |
80.0% |
10.0% |
7.5% |
2.5% |
Answered Question: 40
Skipped Question: 0
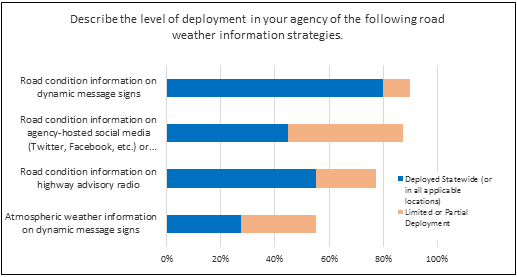 Figure 26. Chart. Responses from State Department of Transportation Survey Question 10.
Table 30. State Department of Transportation Survey Question 11 and Associated Responses.
Q11. Describe the level of deployment in your agency of the following weather responsive traffic management strategies.
Associated PM: Number of agencies using control and treatment strategies during weather events
| Answer Options |
Deployed Statewide (or in all applicable locations) |
Limited or Partial Deployment |
Not Yet Deployed |
Not Sure/ Unknown |
| Adjust ramp meters |
5.0% |
15.0% |
70.0% |
10.0% |
| Adjust traffic signal timing |
0.0% |
30.0% |
55.0% |
15.0% |
| Employ variable speed limits |
7.5% |
37.5% |
52.5% |
2.5% |
| Deploy ITS to determine need to implement temporary restrictions on vehicles |
27.5% |
32.5% |
35.0% |
5.0% |
| Deploy ITS to manage traffic diversions in response to road closures ) |
47.5% |
32.5% |
15.0% |
5.0% |
| Employ traffic incident management practices |
45.0% |
37.5% |
15.0% |
2.5% |
Answered Question: 40
Skipped Question: 0
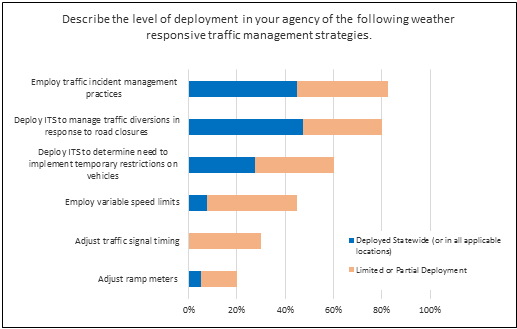 Figure 27. Chart. Responses from State Department of Transportation Survey Question 11.
Table 31. State Department of Transportation Survey Question 12 and Associated Responses.
Q12. Describe your level of interaction with the National Weather Service local forecast offices for road weather management and operations activities.
Associated PM: Number of agencies that coordinate with their local forecast offices for road weather management operations
| Answer Options |
Percentage |
| Not Sure/Unknown |
5.0% |
| Rely only on publicly available information via media and NWS, but no direct connection |
7.5% |
| Limited to no coordination |
12.5% |
| Starting to work with local NWS offices and other weather agencies, but limited to major events |
30.0% |
| Routine coordination with NWS. Have access to meteorological expertise to assist with decision making for most events |
45.0% |
Answered Question: 40
Skipped Question: 0
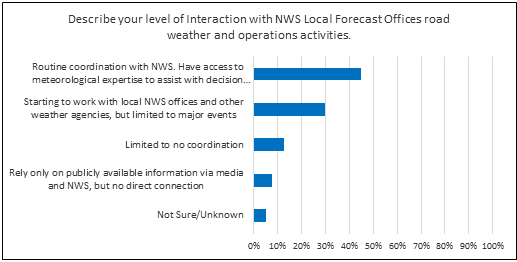 Figure 28. Chart. Responses from State Department of Transportation Survey Question 12.
Table 32. State Department of Transportation Survey Question 13 and Associated Responses.
Q13. Does your agency use a winter Maintenance Decision Support System (MDSS) for snow and ice control? A winter MDSS includes software that provides strategic and tactical weather forecasts, supports treatment decision making and provides summary reports of weather event performance.
Associated PM: Number of agencies adopting MDSS technologies and methods
| Answer Options |
Percentage |
| Not Sure/Unknown |
10.0% |
| No – do not need an MDSS. |
20.0% |
| Yes – use an MDSS, but not statewide. |
22.5% |
| No – need an MDSS, but currently do not have a system. |
22.5% |
| Yes – use an MDSS statewide. |
25.0% |
Answered Question: 40
Skipped Question: 0
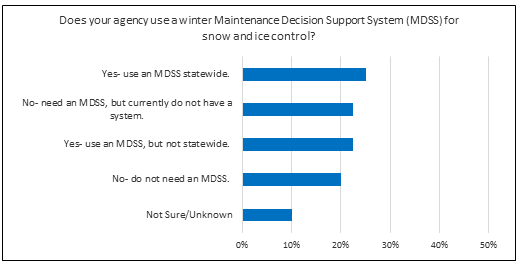 Figure 29. Chart. Responses from State Department of Transportation Survey Question 13.
Table 33. State Department of Transportation Survey Question 14 and Associated Responses.
Q14. Does your agency use other decision support tools (besides a winter MDSS) for road weather management. If yes, what are these tools use for? (Check all that apply)
Associated PM: Number of agencies reporting use of appropriate analysis tools to factor weather impacts and strategies
| Answer Options |
Percentage |
| Other |
2.5% |
| Not Sure/Unknown |
7.5% |
| None |
12.5% |
| Setting seasonal load restrictions |
22.5% |
| Traffic control and management (e.g., speed limit determination, signal timing plans, ramp metering rates) |
27.5% |
| Supporting non-winter maintenance activities (e.g., maintenance scheduling, construction coordination) |
40.0% |
| Coordination with other jurisdictions/agencies |
60.0% |
| Providing traveler information |
77.5% |
Answered Question: 40
Skipped Question: 0
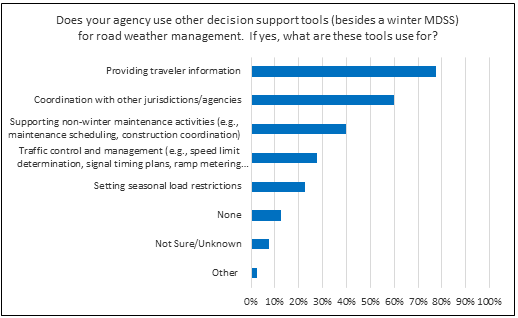 Figure 30. Chart. Responses from State Department of Transportation Survey Question 14.
Another response to Question 14 included "material/labor use tracking, VSL only experimental at this time (Iowa)."
Table 34. State Department of Transportation Survey Question 15 and Associated Responses.
Q15. What types of traffic analysis and simulation tools does your agency use for planning and evaluating road weather management strategies?
Associated PM: Number of agencies reporting use of appropriate analysis tools to factor weather impacts and strategies
| Answer Options |
Percentage |
| Sketch-Planning Analysis Tools |
0.0% |
| Travel Demand Analysis Tools |
0.0% |
| Macroscopic Simulation Models |
0.0% |
| Mesoscopic Simulation Models |
0.0% |
| Microscopic Simulation Models |
0.0% |
| Deterministic Analysis Tools (HCM-Based) |
2.5% |
| Traffic Signal Optimization Tools |
5.0% |
| Other |
5.0% |
| Not Sure/Unknown |
5.0% |
| None |
45.0% |
Answered Question: 40
Skipped Question: 0
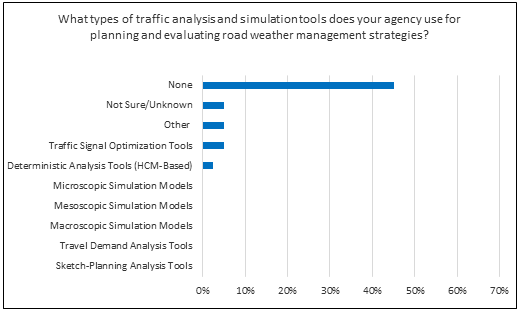 Figure 31. Chart. Responses from State Department of Transportation Survey Question 15.
Table 35. State Department of Transportation Survey Question 16 and Associated Responses.
Q16. Road weather management supports sustainable transportation systems. Which statements below pertain to your agency. (Check all that apply.)
Associated PM: Number of public agencies meeting "INVEST" and/or sustainability criteria related to road weather management
| Answer Options |
Percentage |
| Have not met any goals |
0.0% |
| None of these statements are supported |
0.0% |
| Not Sure/Unknown |
5.0% |
| Have a dedicated road weather management program |
37.5% |
| Have defined goals for road weather management that are monitored regularly |
47.5% |
| Have a documented materials management plan |
50.0% |
| Own and operate a road weather information system |
77.5% |
| Have a documented standard of practice or standard operating procedure (SOP) for snow and ice control |
85.0% |
| Criteria |
Percentage |
| 5 |
18% |
| 4 |
20% |
| 3 |
23% |
| 2 |
28% |
| 1 |
8% |
| Not Sure |
5% |
Answered Question: 40
Skipped Question: 0
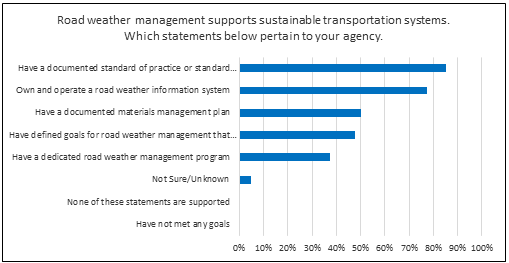 Figure 32. Chart. Responses from State Department of Transportation Survey Question 16a.
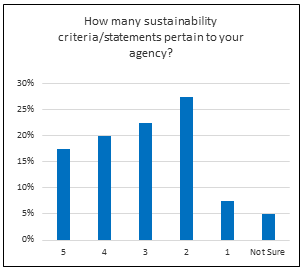 Figure 33. Chart. Responses from State Department of Transportation Survey Question 16b.
Table 36. State Department of Transportation Survey Question 17 and Associated Responses.
Q17. Has your agency participated in extreme weather or climate change adaptation practices? (Check all that apply.)
Associated PM: Number of agencies conducting vulnerability/risk assessment or developing/implementing resiliency plans, for their road weather management infrastructure and processes to respond to climate change and extreme weather; Number of agencies participating in State DOT Climate Adaptation activities sponsored by the FHWA and its partners
| Answer Options |
Percentage |
| Developed/implemented resiliency plans for road weather management infrastructure |
5.1% |
| Conducted a vulnerability/risk assessment for road weather management infrastructure |
15.4% |
| Agency has not participated in development of adaptation practices |
23.1% |
| Participated in State DOT Climate Change Adaptation planning activities |
25.6% |
| Developed/implemented process for responding to extreme weather |
30.8% |
| Not Sure/Unknown |
35.9% |
Answered Question: 39
Skipped Question: 1
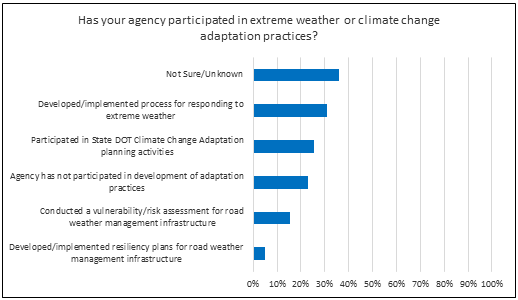 Figure 34. Chart. Responses from State Department of Transportation Survey Question 17.
Table 37. State Department of Transportation Survey Question 18 and Associated Responses.
Q18. Does your agency regularly collect and report road weather performance measures? (This may include dashboards, winter maintenance reports, seasonal summaries, etc.)
Associated PM: Number of agencies that collect and report road weather related performance measures to the public (i.e. winter severity index, mobility index, etc.)
| Answer Options |
Percentage |
| Yes |
59.0% |
| No |
20.5% |
| Not Sure/Unknown |
20.5% |
Answered Question: 39
Skipped Question: 1
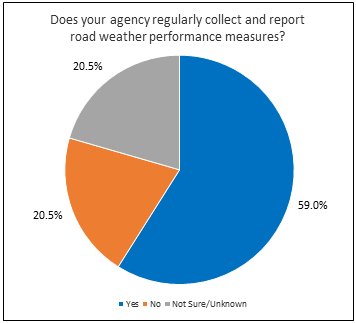 Figure 35. Chart. Responses from State Department of Transportation Survey Question 17.
Table 38. State Department of Transportation Survey Question 19 and Associated Responses.
Q19. Does your agency have a process for evaluating the return on investment (ROI) or net benefits of road weather management investments?
Associated PM: Number of agencies that have a process for evaluating the return on investment (ROI) or net benefit of their road weather management investments
| Answer Options |
Number |
| Yes |
5 |
| No |
24 |
| Not Sure/Unknown |
10 |
Answered Question: 39
Skipped Question: 1
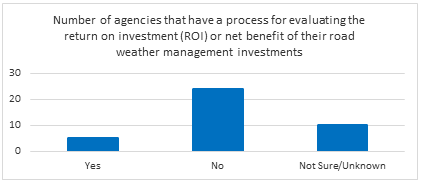 Figure 36. Chart. Responses from State Department of Transportation Survey Question 19.
Table 39. State Department of Transportation Survey Question 20 and Associated Responses.
Q20. Would you be willing to participate in the next update of this survey?
Associated PM: Number of agencies that have a process for evaluating the return on investment (ROI) or net benefit of their road weather management investments
| Answer Options |
Percentage |
| Yes |
97.4% |
| No |
2.6% |
| Not Sure/Unknown |
0.0% |
Answered Question: 39
Skipped Question: 1