Process for Establishing, Implementing, and Institutionalizing a Traffic Incident Management Performance Measurement Program
STEP 1: Review Traffic Incident Management Performance Measures, Definitions, and Data Requirements
The timeline for a typical incident is depicted in Figure 1. (Modified from the incident timeline presented in Conklin, C., et al. Transportation Management Center: Data Capture for Performance and Mobility Measures Guidebook, FHWA-JPO-13-062, USDOT, Washington, D.C., March 2013.) Traffic incident management (TIM) performance can be measured in terms of the various time-based components of the incident timeline, as indicated by the colored arrows. To maintain consistency at a national level, the Federal Highway Administration (FHWA) recommends that agencies collect and report three national TIM performance measures: roadway clearance time (RCT), incident clearance time (ICT), and secondary crashes. RCT and ICT are time-based measures and are shown in Figure 1. The definitions, required data elements, and equations for all three national TIM performance measures are listed in Table 1.
The premise of having three national TIM performance measures is to create a defined, sustainable, and comparable basis for TIM program assessment across the boundaries of any given region, allowing for the analysis of national incident response (IR) trends. Consistent and comparable performance reporting is an essential tool in promoting TIM and funding for TIM resources.
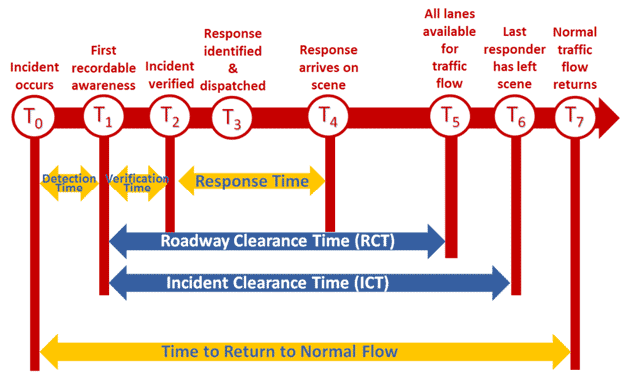 Figure 1. Chart. Incident timeline.
(Source: Federal Highway Administration.)
Figure 1. Chart. Incident timeline.
(Source: Federal Highway Administration.)
Table 1. Federal Highway Administration key traffic incident management performance measures.
| Key Traffic Incident Management Performance Measures |
Definition |
Required Data Elements |
Equation |
| Roadway clearance time (RCT) |
Time between the first recordable awareness of the incident by a responsible agency and the first confirmation that all lanes are available for traffic flow. |
T1 = Time of first recordable awareness of an incident by a responsible agency.
T5 = Time of first confirmation that all lanes are available for traffic flow. |
RCT = T5 - T1 |
| Incident clearance time (ICT) |
Time between the first recordable awareness of the incident by a responsible agency and the time at which the last responder has left the scene. |
T1 = Time of first recordable awareness of an incident by a responsible agency.
T6 = Time at which the last responder has left the scene. |
ICT = T6 - T1 |
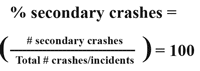
| Secondary crashes |
The number or percentage of unplanned crashes beginning with the time of detection of the primary incident, where a crash occurs as a result of the original incident, either within the incident scene or within the queue in either direction. |
Identification of whether a crash is secondary to a primary crash/incident (e.g., yes/no). |
 |
These three measures are not the only ones that are used for TIM performance measurement. The incident timeline shown in Figure 1 illustrates a number of other time-based TIM performance measures, including incident detection time (IDT), incident verification time (IVT), incident response time (IRT), and time to return to normal traffic flow (NFT). The definitions, required data elements, and equations for these additional time-based performance measures are listed in Table 2.
Table 2. Other time-based traffic incident management performance measures.
| Other Traffic Incident Management Performance Measures |
Definition |
Required Data Elements |
Equation |
| Incident detection time (IDT) |
Time between the first recordable awareness of the incident by a responsible agency and when the incident actually occurs. |
T0 = Time at which incident actually occurs.
T1 = Time of first recordable awareness of incident by a responsible agency. |
IDT = T1 - T0 |
| Incident verification time (IVT) |
Time between when the incident is verified and the first recordable awareness of the incident by a responsible agency. |
T1 = Time of first recordable awareness of incident by a responsible agency.
T2 = Time at which incident is verified. |
IVT = T2 - T1 |
| Incident response time (IRT) |
Time between when the incident is verified and when response arrives on scene. |
T2 = Time at which incident is verified.
T4 = Time at which response arrives on scene. |
IRT = T2 - T4 |
| Time to return to normal flow of traffic (NFT) |
Time between when the incident actually occurs (or the first recordable awareness) and when normal traffic flow returns. |
T0,1 = Time at which incident actually occurs.
T7 = Time of first recordable awareness of incident by a responsible agency. |
NFT = T7 - T0
or
NFT = T7 - T1 |
In addition, there are different ways of characterizing secondary crashes, including:
Crash secondary to a primary incident
An incident-to-crash relationship where the primary event is a crash or some other type of incident, such as a disabled vehicle.
Crash secondary to a primary crash
A crash-to-crash relationship where the primary event is a crash only (this category is a subset of the previous category).
Secondary crash involving a first responder
(e.g., struck-by)
Beyond the data elements required to calculate the TIM performance measures, there are a number of data elements that, while not required, are useful for putting TIM performance into context. For example, TIM performance at a minor fender-bender can look very different than TIM performance at a catastrophic incident that involves closing an urban freeway for several hours. Therefore, performance can be better understood when expressed in terms of different incident, locational, or environmental characteristics. In order to do this, however, these characteristics also need to be captured and associated with incidents.
Notes on secondary crashes
The original FHWA definition has recently been modified from secondary incidents to secondary crashes. Ideally, crashes as a result of a primary incident would be identified; however, if it simplifies the process, agencies can focus on identifying those crashes that are secondary to a primary crash (crash-to-crash relationship).
 (Photo Source: Virginia Department of Transportation.)
Examples of data elements for characterizing Traffic Incident Management performance include:
Type of incident
(e.g., crash, stalled vehicle, debris on roadway)
Incident severity, duration, or impact
(e.g., minor, intermediate, major)
Injury severity
(e.g., property damage only, minor injury, major injury, fatality)
Incident location
(e.g., roadway type/classification, roadway name)
Number of lanes blocked
(e.g., none/shoulder-only, one-lane, full roadway closure)
Arrival and departure times of different responders
(e.g., law enforcement, fire/Emergency Medical Services (EMS), towing)
Virginia Department of Transportation—Statewide Performance Measures Approach
Within the State of Virginia, the regional operations director and district administrators meet to determine performance targets, look at historical data, and work on definitions. The Virginia Department of Transportation (VDOT) central office went through a process with regional and district stakeholders to determine the best measures to "tell the story" of the incident management process at the regional/district level for the Chief Engineer's Report. While the performance measures are the same across the State, the performance targets vary between regions to reflect the needs and challenges of each region. In addition to RCT, ICT, and others, VDOT is introducing reliability (vehicle hours of delay) as a performance measure.
Wisconsin Department of Transportation Performance Measures—Thinking Outside the Box
The Wisconsin Department of Transportation (WisDOT) currently is collecting and reporting RCT and ICT, amongst other TIM performance measures. In addition, WisDOT is examining the potential use of TIM performance measures related to the following:
- Duration—More qualitative than RCT and ICT, WisDOT would like to examine work flows or processes to determine if there is any lag during the response to incidents, and if so, where.
- Safety—In addition to secondary crashes, WisDOT is considering the use of after-action reports to identify safety performance issues, such as the incorrect use of traffic control devices or not wearing high visibility apparel.
- Incident impact—The same incident can have a different impact depending on when and where it occurs. For example, an incident with a long clearance time may have little impact at night, but the same incident could cause major delays during the day. Being able to quantify the impact of incidents is something that needs further investigation.
- Communications/coordination—WisDOT is considering scoring incidents based on intra- and interagency coordination and communications, such as qualitative analyses of work flows/processes to identify "choke points."